Below is a daily Euro chart with RSI under.
Overlayed on the 14 period RSI is a faint yellow line which I have not been able to determine what it is.
The info indicates RSI 14 and also SMA ,14 ,2.
Is SMA a simple moving average or a smoothed moving average? I have not been able to duplicate that line by displaying SMA 14 elsewhere on the chart and dont have the option of creating a smoothed moving average.
Any help appreciated.
John
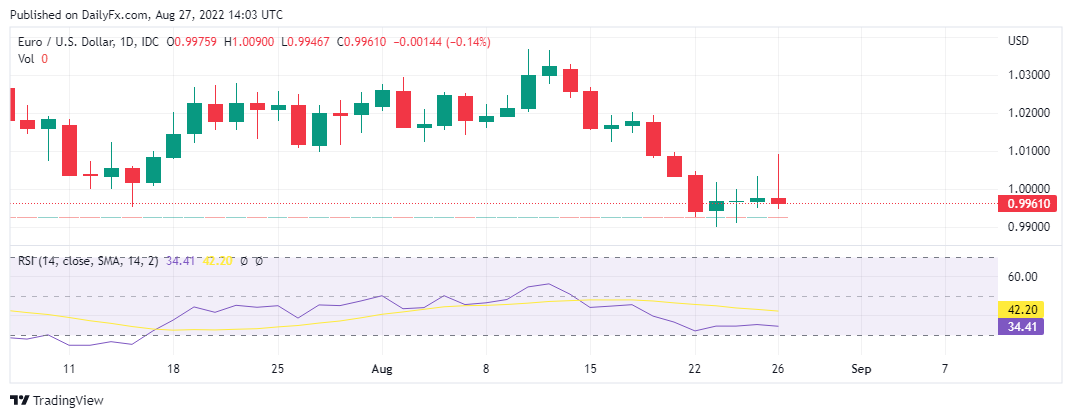
Lookis like it comparing the RSI to the simple moving average,then plotting it on a zero to hundred scale. The sma is moving some what faster than the RSI.
Thanks MTP
Ill have to look into it further.
The cross for entry appears to be worth investigation regarding 30 and 60 min charts.
John
Edit : your adjustments mentioned above are interesting
Or rather the adjustments in your other post
I should have posted the 30 or 60 min chart
You could always try the Richard "Wycoff Method" for chart reading. imho, the only true way to read a chart. I have known about for a while but just starting to study it in depth... https://duckduckgo.com/?q=wyckoff+method+pdf&ia=web
Thanks rockitck
I had briefly explored Wyckoff in the past and just didnt seem to fit me.
Prolly deserves a second look