So we get yet another hot inflation number above expectations and the premarket futures get hammered.
But now an hour and 40 minutes into the session we are flirting with unchanged. That is bullish action. Nasdaq still lower (interest rate sensitive).
Thanks joj!
You're describing a market that has dialed in all the bad news for now with a potential selling exhaustion.
High prices remain top of mind for many Americans in the last quarter of a year marked by across-the-board volatility in food, gasoline and energy costs.
While the Biden administration has sought to address the issue through measures like the Inflation Reduction Act, the provisions contained in that law are set to take effect over a period of 10 years, and at least two separate models predict its actual impact on inflation would be statistically insignificant.
meteormike: All they did was take The Climate Change Act 2021, and rename it the Inflation Reduction Act 2022 after inflation became a problem in 2022. Dishonest politics at its worst. That bill will have no effect on inflation, in fact, considering what it WILL do to energy prices from killing fossil fuels(high energy prices always cause inflation) it should be renamed the Inflation CAUSING Act.
The only way for that not to come true is if the energy forced consequences of the Inflation Reduction Act cause our country to go into a deep depression.
https://www.iea.org/policies/13518-federal-climate-change-act-2021
For America to decarbonize, it must reindustrialize.
https://www.theatlantic.com/science/archive/2022/08/climate-law-manchin-industrial-policy/671183/
https://www.marketforum.com/forum/topic/85535/#85776
"Gregory provides a tentative number for the additional storage costs that could be necessary for full electrification of the United States system, with all current fossil fuel generation replaced by wind and solar. That number is $433 trillion. Since the current U.S. annual GDP is about $21 trillion, you will recognize that the $433 trillion represents more than 20 times full U.S. annual GDP. In the post I will give some reasons why Gregory may even be underestimating what the cost would ultimately prove to be."
https://finance.yahoo.com/quote/%5EDJI/
Green means higher over the period, red means lower.
1 day below%20Charts%20Data%20%26%20News%20-%20Yahoo%20Finance.png)
5 days below
%20Charts%20Data%20%26%20News%20-%20Yahoo%20Finance.png)
1 month below
%20Charts%20Data%20%26%20News%20-%20Yahoo%20Finance.png)
6 months below
%20Charts%20Data%20&%20News%20-%20Yahoo%20Finance.png)
1 year below
%20Charts%20Data%20&%20News%20-%20Yahoo%20Finance.png)
5 years below
%20Charts%20Data%20&%20News%20-%20Yahoo%20Finance.png)
30 years below:
%20Charts%20Data%20&%20News%20-%20Yahoo%20Finance.png)
Related to the earlier post:
https://www.investopedia.com/terms/e/exhausted-selling-model.asp
The exhausted selling model is a technique used to estimate when a period of declining prices for a security has reached its end—or when sellers have exhausted their ability to sell any further. It is employed by investors who seek to profit from a turnaround following a period of intense selling pressure.
Exhaustion occurs when almost everyone who wants to be long or short already is, leaving very few people to support or continue pushing the price in the current direction.
Great call joj!
The stock market sold off at Thursday's open after September core prices jumped to a 40-year high. But indexes made an impressive reversal and were higher at midday, along with many major stocks.
The Nasdaq composite plummeted more than 3% at the open but was up 1.2% before the noon hour on Wall Street. The S&P 500 rallied 1.5%. The Dow Jones Industrial Average, which undercut its Sept. 30 low early today, bounced back 1.7%.
Thanks Mike.
To be clear.... This isn't a bell ringing the all clear signal to put money into the market for the long haul (investing).
It's a simple swing trade which could be good for days, weeks or months. The signal yesterday was when the market went unchanged on the day. Market bucks the news go with the price action. It often happens with individual stocks on quarterly earning reports.
Good trades.
Thanks, , I get that.
It was one of the most astute observations here ever WHILE THE MARKET WAS TRADING.
Bullish reaction to bearish news in a massive way and during the action, not just at the end of the day.
https://www.cnbc.com/2022/10/12/stock-futures-are-up-as-investors-await-inflation-data.html
Regardless of whether we have follow thru with a higher close today or not(we're lower at the moment) yesterday's observation was powerful enough to have a major upward reaction during the 2nd half of yesterday's trading session.
Was the signal only good for yesterdays session?
Possibly but you weren't calling for a time frame(as you confirmed earlier), just seeing the signature of a daily reversal bar before it finished.
Other traders yesterday noted the same thing at the same time which really amplified the reversal up during the later half of the trading session on Thursday.
That's somebody tuned into the market at that point in time.
On Friday, traders are focusing on something else.
https://www.cnbc.com/2022/10/13/stock-market-futures-open-to-close-news.html
If a big part of the reason for the reversal yesterday was traders feeling the worst news is behind us and already dialed in, then the market would need confirmation that the worst news is in.
If the market gets additional news that suggests it going to get even worse, that might be enough to invalidate the reversal higher.
The other thing is the buy the rumor, sell the fact action. Or in this case sell the rumor buy the fact.
In an oversold market, with a lot of people that already sold and others looking for the first reason to buy, which could have happened when the selling dried up.
As we've seen in all the markets, moves at every time frame get overdone in one direction because of positive feedback technical signals that set off new buying/selling signals from traders that follow short term momentum indicators.
Crude is getting crushed today too.
https://www.cnbc.com/2022/10/13/stock-market-futures-open-to-close-news.html
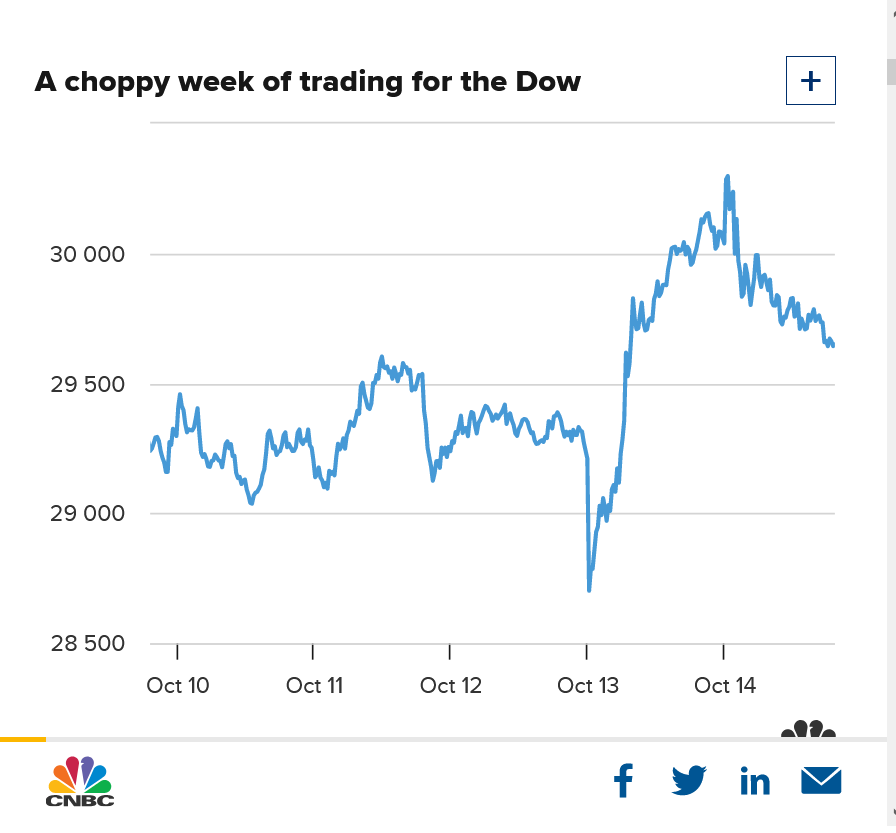
Stocks slumped Friday, capping off a volatile week of trading, a day after posting a historic turnaround rally as investors digested inflation expectations.
The Dow Jones Industrial Average fell 422 points, or 1.41%, but was still on track to end the week higher after Thursday’s gains. The S&P 500 shed 2.23%, on track to end the week down. The Nasdaq Composite slipped 2.74%, weighed down by losses in Tesla and Lucid Motors, which each declined more than 5%.
![]()
Stocks fell to session lows after a consumer survey from the University of Michigan showed inflation expectations were increasing, sentiment that the Federal Reserve is likely watching closely. The tech-heavy Nasdaq led declines as growth companies are most sensitive to interest rate hikes.
At the same time, bond yields spiked, with the 10-year U.S. Treasury year topping 4% for the second time in two days as investors react to higher inflation expectations.
Markets whipsawed throughout the week as investors weighed new inflation data that will inform the Fed as it continues to hike interest rates to cool off price increases. On Thursday, stocks staged a major turnaround. The Dow ended Thursday’s session up 827 points after being down more than 500 points at the intraday low. The S&P 500 rose 2.6% to break a six-day losing streak, and the Nasdaq Composite jumped 2.2%.
Thursday marked the fifth largest intraday reversal from a low in the history of the S&P 500, and it was the fourth largest for the Nasdaq, according to SentimenTrader.
The moves followed the release of the consumer price index, a key U.S. inflation reading that came in hotter than expected for the month of September. Initially, this weighed on markets as investors braced themselves for the Federal Reserve to continue with its aggressive rate-hiking plan. Later, however, they shrugged off those worries.
Still, persistent inflation remains a problem for the Fed and for investors’ worries around the central bank’s policy tightening.
“With core CPI still moving in the wrong direction and the labor market strong, the conditions are not in place for a Fed policy pivot, which would be one of the conditions for a sustained rally in the equity market,” wrote UBS global wealth management chief investment officer Mark Haefele in a Friday note. “Moreover, as inflation remains elevated for longer and the Fed hikes further, the risk increases that the cumulative effect of policy tightening pushes the US economy into recession, undermining the outlook for corporate earnings.”
++++++++++++
metmike:
From a technical perspective below: Todays slow, grinding fall still stayed above the previous highs this week. This does NOT negate yesterdays reversal higher because we are still above the weekly highs, PRIOR to the reversal.
A definitive close below this weeks lows or highs would shed more light on the picture. I have never traded stock market futures but am just applying basic technical market interpretations.
From a psychological standpoint, the fact that we couldn't follow up with a strong day today, after yesterdays incredibly powerful technical reversal tells us that we couldn't convince many traders to get bullish this market....yet. So the overall mentality must still be pretty bearish.
Pretty ugly today. If I had gotten long (I didn't) I would be throwing in the towel today.
Reports from one Fed member set the tone early who said "We are NOT looking at the stock market".
The market has validated the daily reversal bar higher that you noted, joj when starting this thread earlier in October.
https://finance.yahoo.com/quote/%5EDJI/
Here we go with the charts. The 1 MONTH chart and sooner time frames have turned solidly positive!
6 month and 1 year still negative.
Longer periods still positive. Green is bullish/uptrend, red is bearish downtrending. You can see the time frame just above the graph highlighted in blue.
%20Charts%20Data%20&%20News%20-%20Yahoo%20Finance.png)
++++++++++++++++
%20Charts%20Data%20&%20News%20-%20Yahoo%20Finance.png)
+++++++++++
%20Charts%20Data%20&%20News%20-%20Yahoo%20Finance.png)
++++++++++++++++++++++++
%20Charts%20Data%20&%20News%20-%20Yahoo%20Finance.png)
%20Charts%20Data%20&%20News%20-%20Yahoo%20Finance.png)
+++++++++++++++++++++++++
%20Charts%20Data%20&%20News%20-%20Yahoo%20Finance.png)