The NWS came out with their extended outlook updates today. The Winter forecast is quite cold from the Northwest to, especially the Upper Midwest.
Long range projections like this don't have great skill but this one is predicated on the downstream impact of the extremely long lived La Nina.
November is seen as mild for the southwest half of the country.....and dry there, not good news for major drought relief.
https://www.cpc.ncep.noaa.gov/products/forecasts/


Here's the Winter Outlook below.....also not good news for relief from the major drought.
++++++++++++++
Get the comprehensive short term weather here:
Here's the huge problem right now:
https://www.marketforum.com/forum/topic/83844/#83853
Soilmoisture anomaly:
These maps sometimes take a day to catch up to incorporate the latest data(the bottom map is only updated once a week).
https://www.cpc.ncep.noaa.gov/products/Soilmst_Monitoring/US/Soilmst/Soilmst.shtml#
![]()


++++++++++++++++++++++++++++
https://mrcc.purdue.edu/cliwatch/watch.htm#curMonths

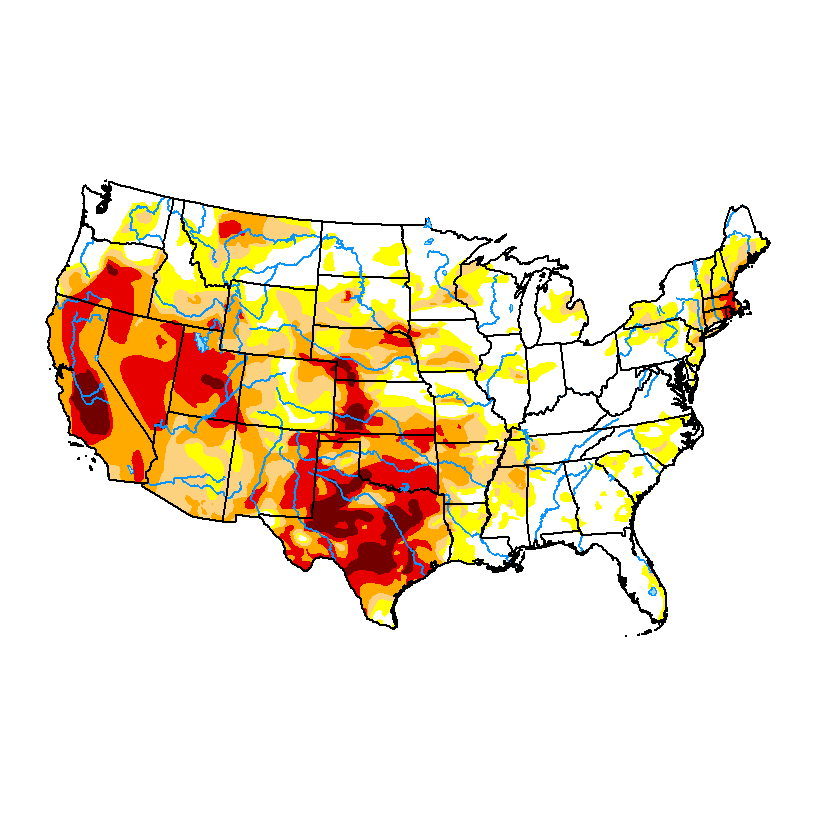
October 18, 2022 Below
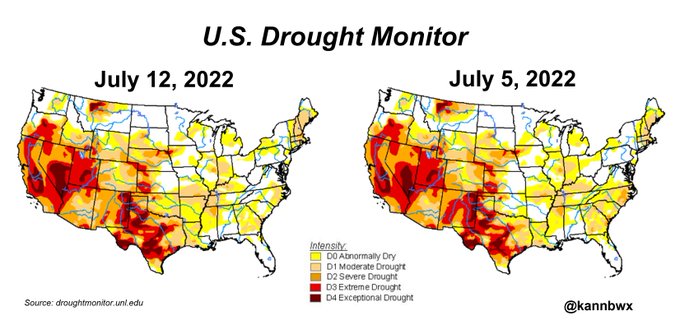
Drought worsening!!
https://droughtmonitor.unl.edu/Maps/CompareTwoWeeks.aspx

AUGUST 16, 2022 BELOW
Drought is worse in the WCB compared to 3 weeks earlier
July 26, 2022-update
U.S. Drought Monitor
https://droughtmonitor.unl.edu/Maps/CompareTwoWeeks.aspx

Drought monitor previous years:
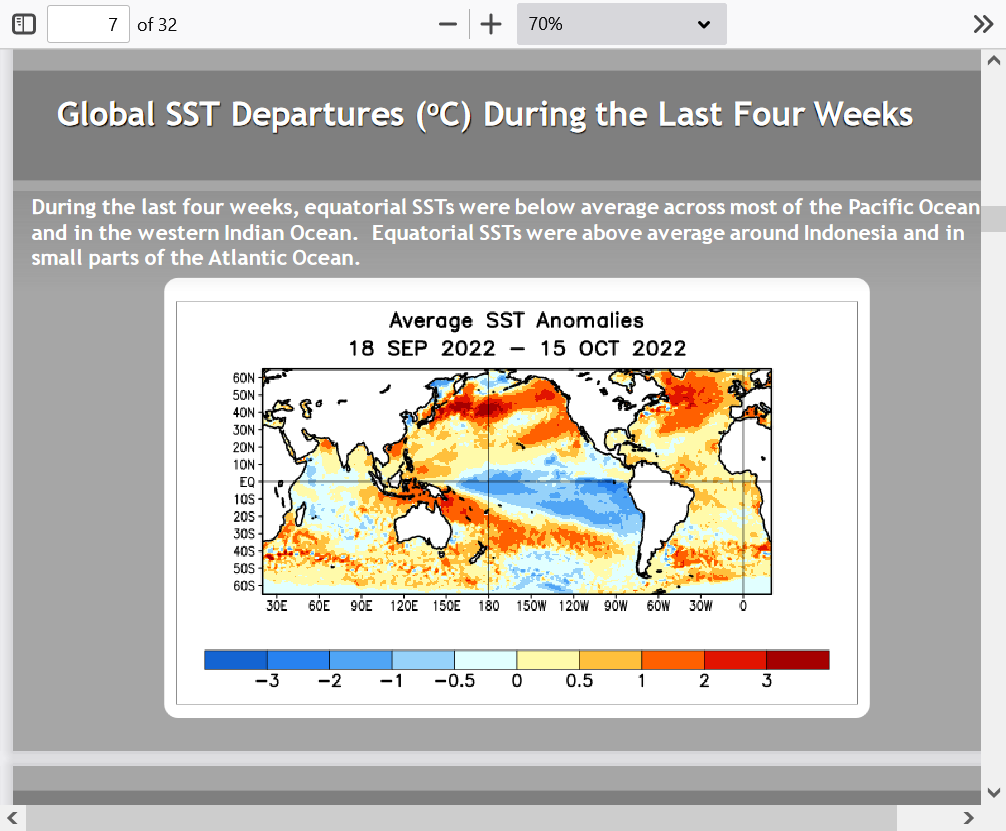
Let's look at the driver of this drought, the extremely long lived La Nina..........cold water anomalies in MUCH of the Tropical Pacific.
ENSO: Recent Evolution,
Current Status and Predictions
Update prepared by:
Climate Prediction Center
Summary
La Niña is present.*
Equatorial sea surface temperatures (SSTs) are below average across most of
the Pacific Ocean.
The tropical Pacific atmosphere is consistent with La Niña.
There is a 75% chance of La Niña during the Northern Hemisphere winter
(December-February) 2022-23, with a 54% chance for ENSO-neutral in
February-April 2023.*
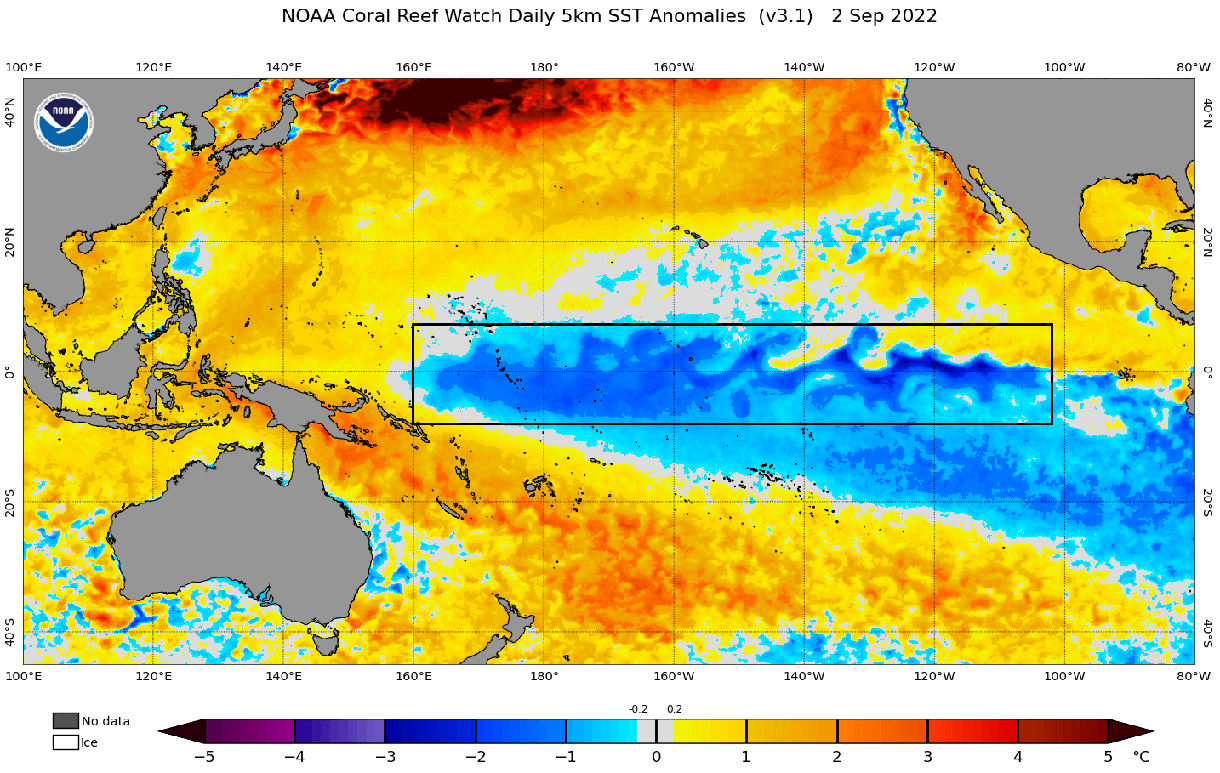
Every Nino region is solidly below average and the trend in the 3 months is even cooler

Huge pool of below average temperatures in the tropical Pacific

Here it is on a global scale

The negative anomalies are at the surface and at depth, so they are not going away for awhile.


Here are some model forecasts. We should note that every model has killed the La Nina too soon for well over the last year now. I'll have to check but this is probably still the 2nd or 3rd longest La Nina.


Which one do I believe? None of them, they've all been wrong the past year but the La Nina can't go on forever.
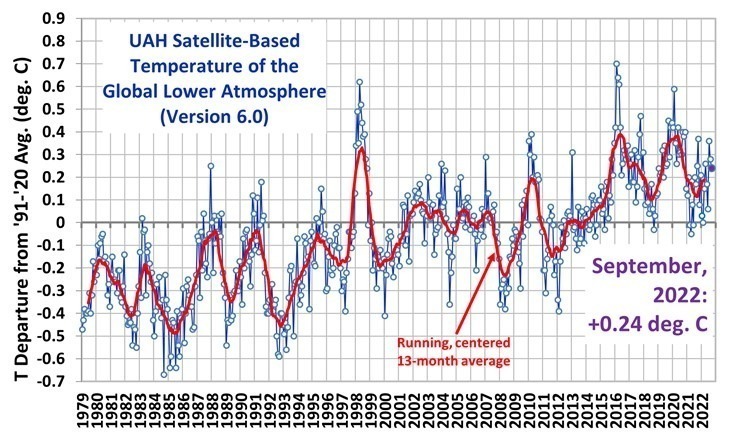
Just a quick reality check:
More La Nina lessens the chances for drought relief and continues the chances for the global warming pause of the last 6 years to continue. It's also expected compared to last month but NOT expected in the era of global warming and previous El Nino's dominating ….at least not expected by those ignoring the -PDO in the Pacific Ocean.
This La Nina has been responsible for or enhanced the US drought and played a key role in much of the recent drought from the West to the Midwest as well as some of the recent extreme weather. This extreme weather and the La Nina are part of natural variation.
The modest greenhouse gas warming the last 100 years has added 1 degree C to heat waves and 7% more moisture to some rain events.
However, the beneficial growing weather during this climate optimum and increase in CO2 is also, literally feeding 1 billion people and countless other creatures on the planet.
Going back to the old climate, 100 years ago would reduce heat waves by 1 deg. C (2 deg. F) and extreme rain amounts by 7%......but 1 billion people would starve to death and most animals would have less food, including the polar bears that have increased 30% since 2005...especially from the increase in phytoplankton growth, which means more food for the entire Arctic food chain, including polar bears.
The irrefutable scientific law of Photosynthesis has not been repealed. All creatures eat plants or eat something that ate plants. CO2 is the building block for all of life and a beneficial gas.
It was this warm 1,000 years ago during the Medieval WARM period, also the Roman WARM period, 2,000 years ago. The Holocene Climate OPTIMUM between 9,000 and 5,000 years ago featured temperatures at times that were 2 deg. C warmer than this in the higher latitudes. There was less Arctic Ice.
Blah, blah blah, you've read me state it 100 times but I'm also a practicing, active environmentalist that actually practices what the hypocritical energy guzzling fake environmentalists preach because we DO over consume natural resources.
https://www.marketforum.com/forum/topic/27864/
We're returning this network back to the topic of La Nina, weather and authentic climate (-:
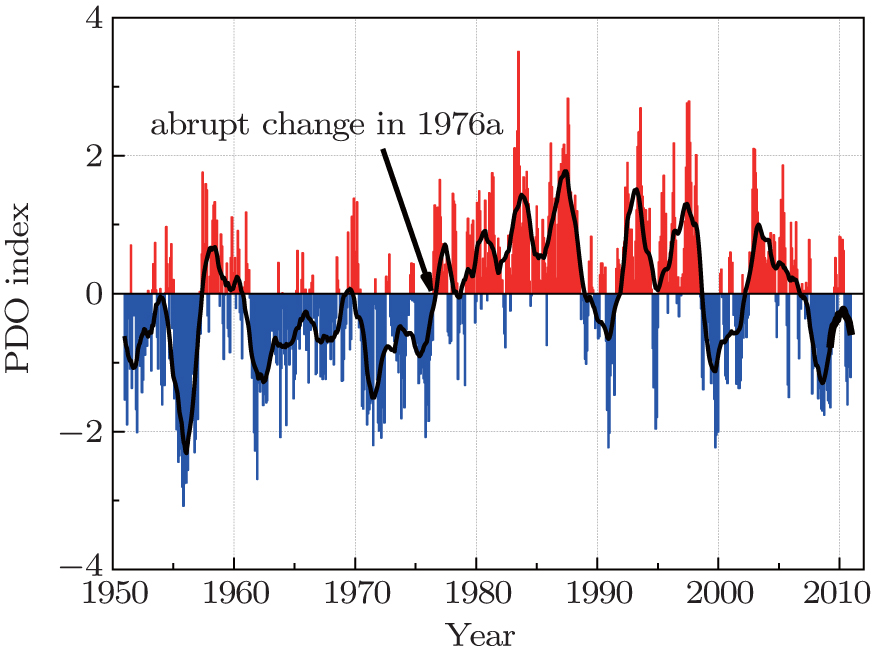
Starting with the -PDO (that lasts for decades) right now causing the favored La Nina cooling of the tropical Pacific and the pause in global warming since 2016.
https://www.marketforum.com/forum/topic/89418/
Notice how the pattern above is not a perfect, classical -PDO like below but still features the big warm anomalies north and cold anomalies south. This La Nina is warm along the West Coast but its never a perfect match.
https://legacy.climate.ncsu.edu/climate/patterns/pdo

-PDO regimes can last for 3+ decades and they CAUSE more La Nina's. +PDO regimes also last for decades and are the opposite temperature pattern in the Pacific, also causing more El Nino's..........just like we had in the 1980'/90's.
+++++++++++++++++
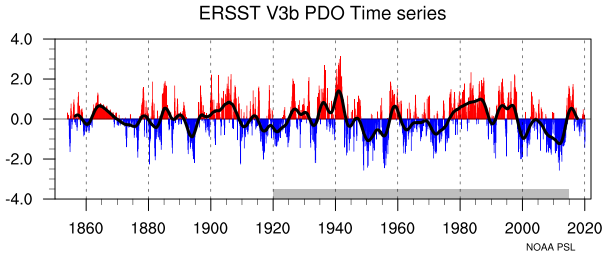
This is the PDO index below. There was modest global cooling in the 1950s/60s/early-mid 70's. Global warming from CO2 increasing was enhanced in the 1980's/90's by El Nino's with the +PDO regime.
We are back in a -PDO Regime which favors more La Nina's and much longer La Nina's!
http://cpb.iphy.ac.cn/article/2015/cpb_24_8_089201/cpb150091f2_hr.jpg.html
++++++++++++++
The main reason for the dryness in the West to Midwest during the past 3 years is the long lived La Nina. La Nina's change the course of winds and weather systems downstream. The closer to the La Nina, usually the stronger the impact.
La Nina's correlate strongly to persistent upper level high pressure domes in the West that, at times can shift farther east into the Plains and Midwest during the growing season.
The last 2 widespread, major droughts in the Midwest were caused by the La Nina's in 2012 and 1988. The record long period in between those droughts (24 years) represented the best crop growing weather in recorded history for this extremely high producing region. This has been part of the climate change that we never read about. During that time, we had a great deal of El Nino's during a mainly +PDO regime.
La Nina's feature COOL/NEGATIVE water temperature anomalies in the E/C tropical Pacific Ocean. They are NOT caused by global warming!
I'd be willing to bet my house that when we have our next major El Nino, the precipitation out West will increase and likely help ease the drought in the West and increase levels on Lake Meade, especially if water use cuts are maintained for awhile and ESPECIALLY if we had an EL Nino that was moderate/strong for an entire Winter. 2 Winters like that and I'll bet my life on it (-:
However, it's difficult to have El Nino's especially a long lived El Nino when the PDO is solidly negative as it is right now. +PDO correlates strongly with El Ninos(warm temp anomalies in the E/C tropical Pacific) and favorable weather in the US growing season/less drought.
This guy has some wonderful stuff!
By: Author Andrej Flis
Posted on Published:
Categories Long range / seasonal forecast
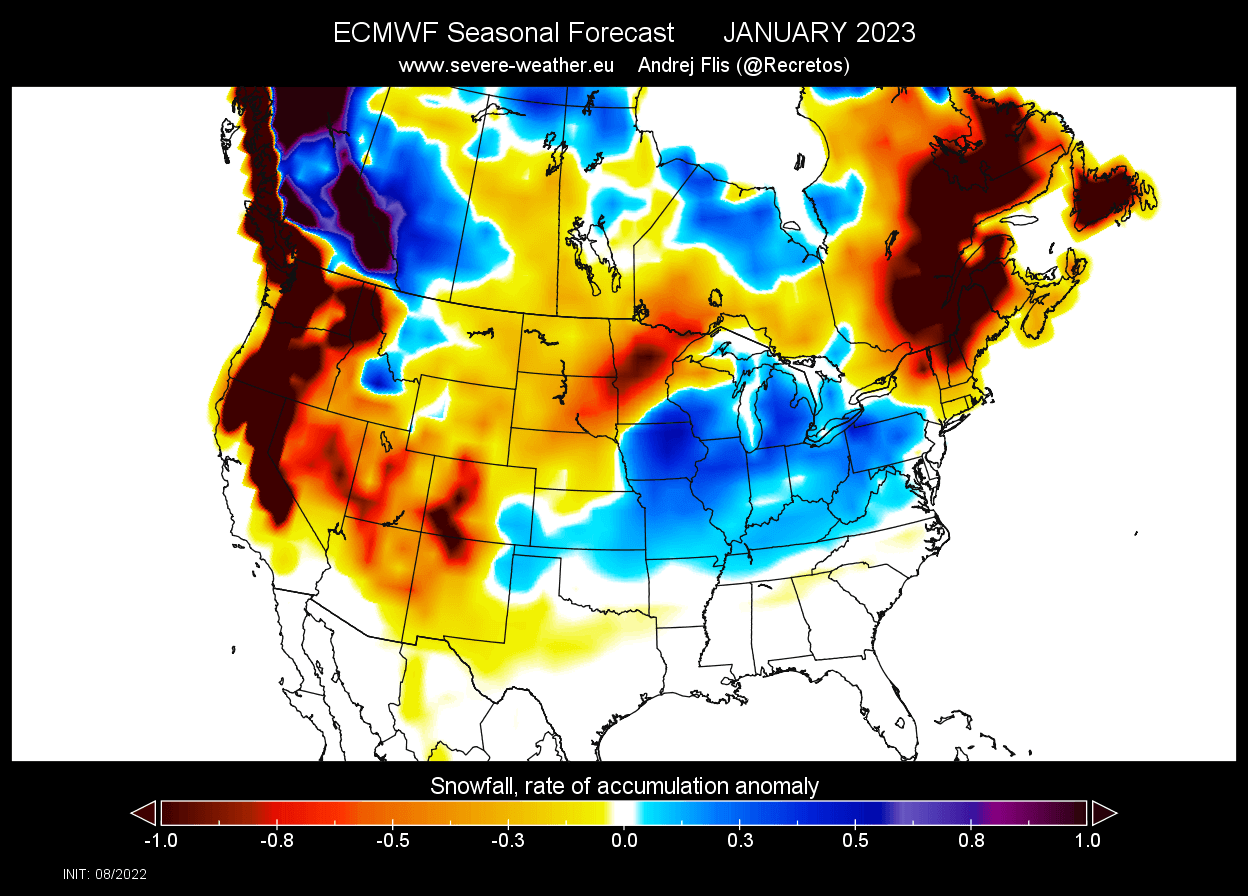
Winter 2022/2023 snowfall predictions show a global climate signal from the La Nina, now active for a third consecutive year. From Canada to the United States and across the Atlantic to Europe, we will look at the snowfall forecast and trends for the upcoming Winter.
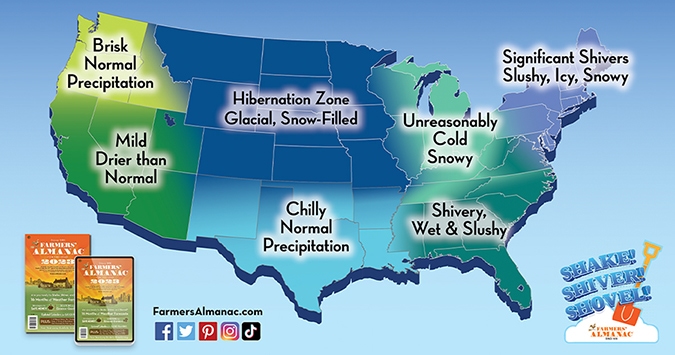
FWIW... FARMER'S ALMANAC
https://www.farmersalmanac.com/farmers-almanac-releases-an-extreme-winter-forecast-for-2022-23
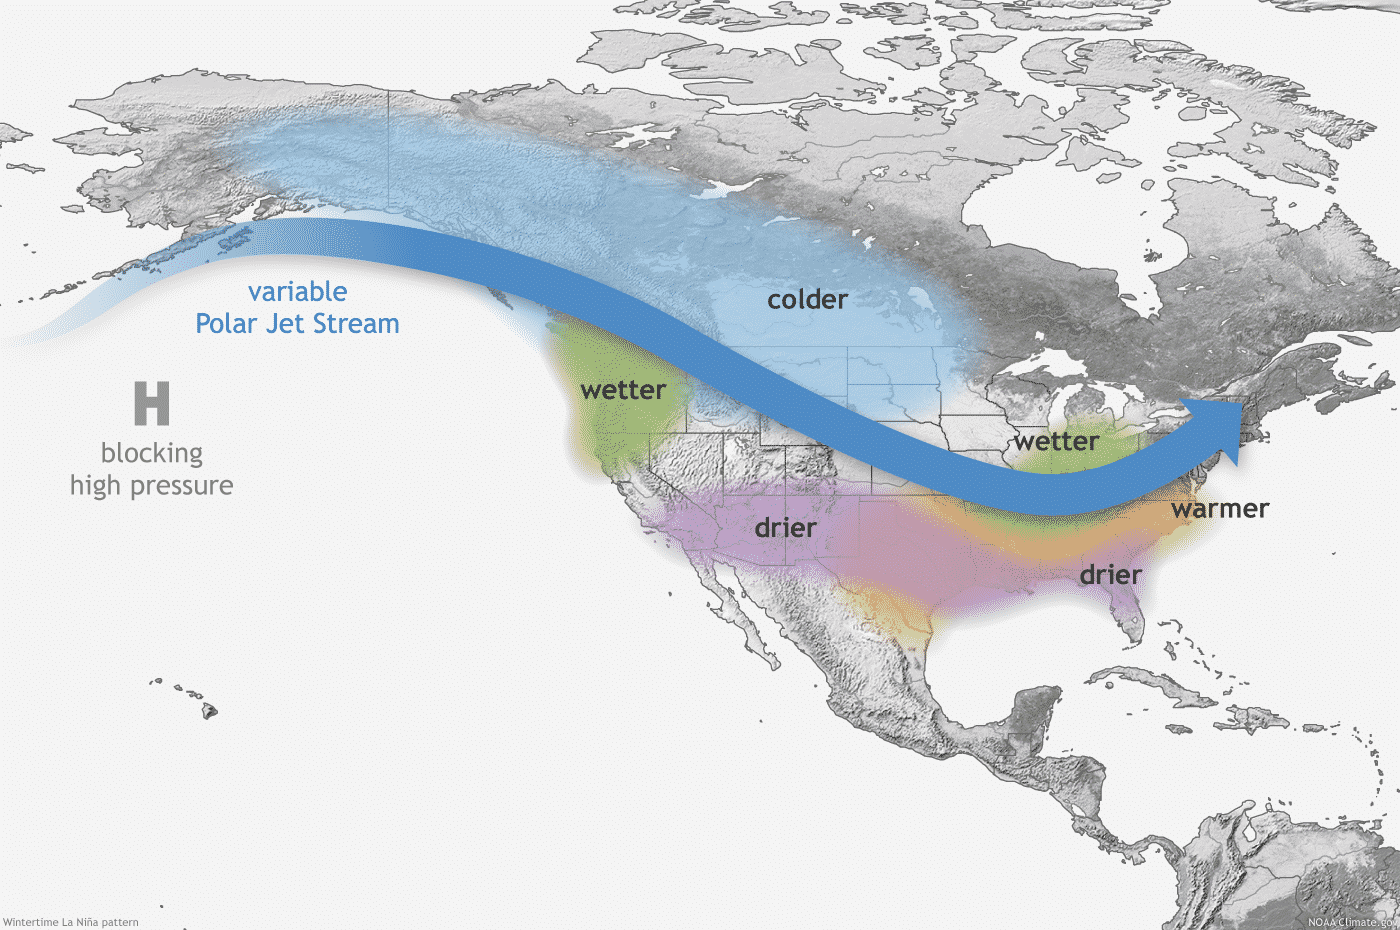
Historically, a strong blocking high-pressure system in the North Pacific is the most typical effect of a cold ENSO phase (La Nina). That usually redirects the polar jet stream down over the northern United States.
The image below shows the average pressure pattern during the last few La Nina winters. We can see a strong high-pressure system in the North Pacific and a low-pressure area over Canada and the northern United States. Images by NOAA Physical Sciences Laboratory (PSL).
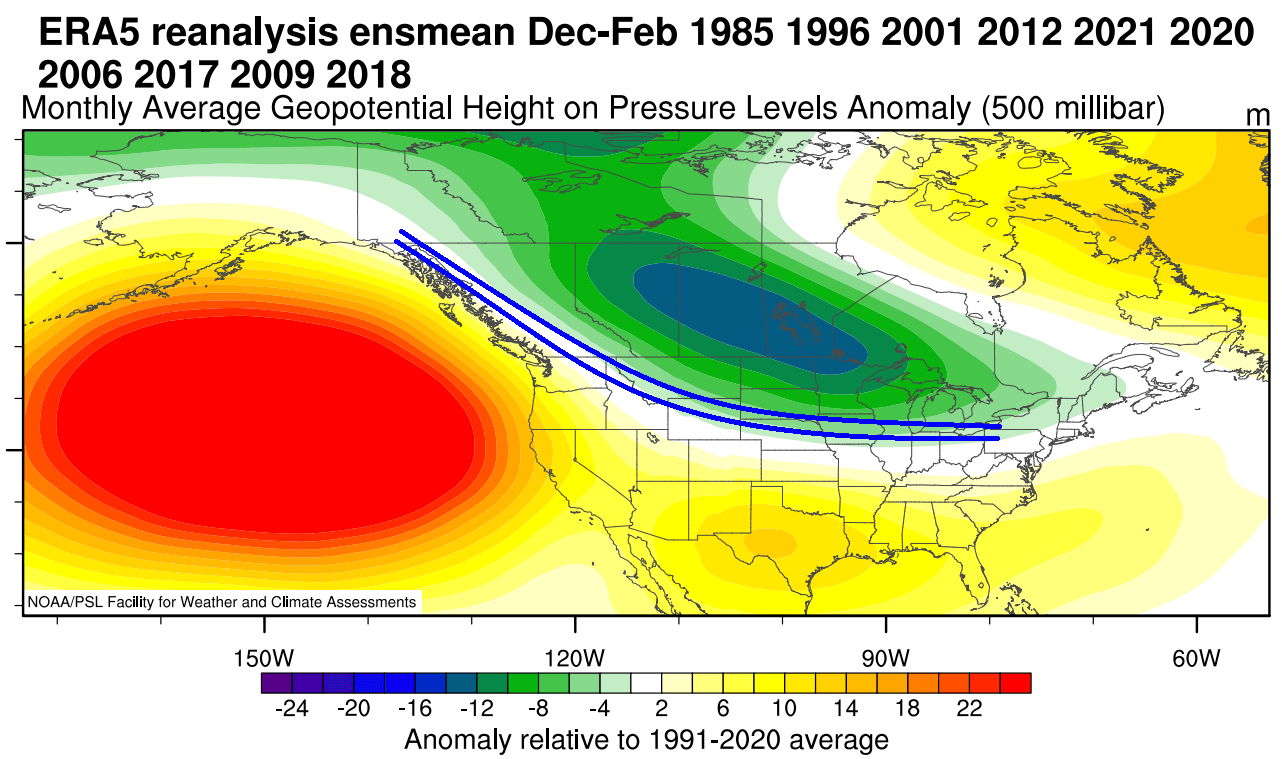
The circulation of the strong high-pressure system promotes the development of a low-pressure region over Alaska and western Canada. It curves the jet stream downwards between the two pressure systems, marked by the blue lines.
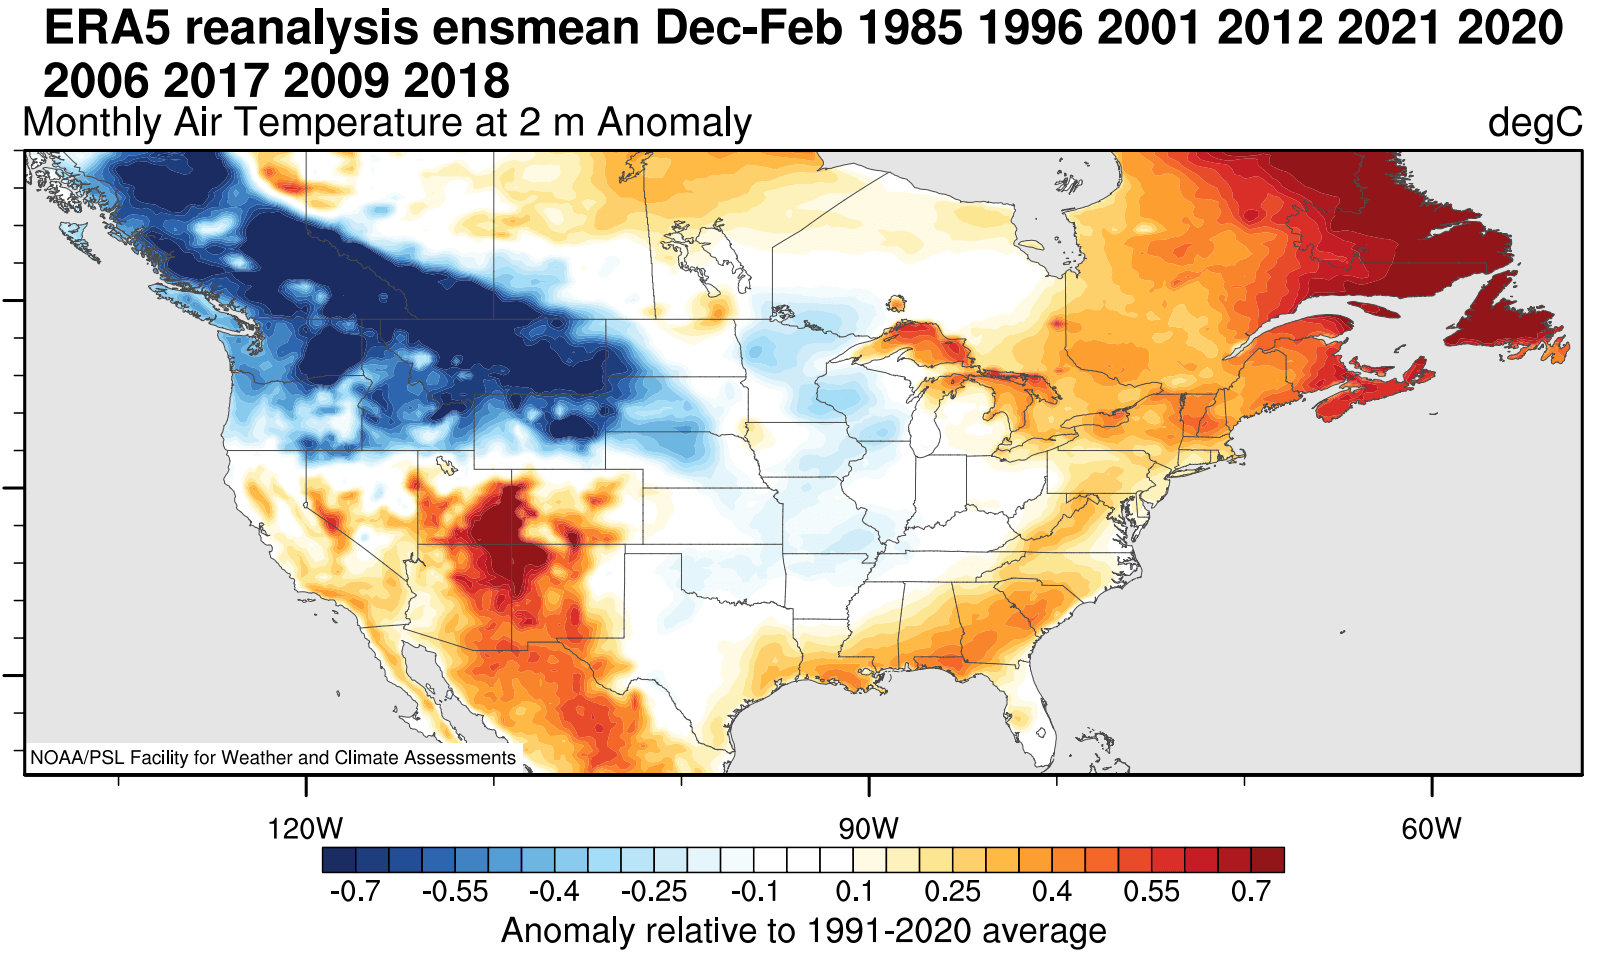
Warmer than normal weather and mild winter conditions are typically over the southwestern United States, eastern United States, and Canada. The main winter weather “battle zones” are usually in the Midwest and the central United States.
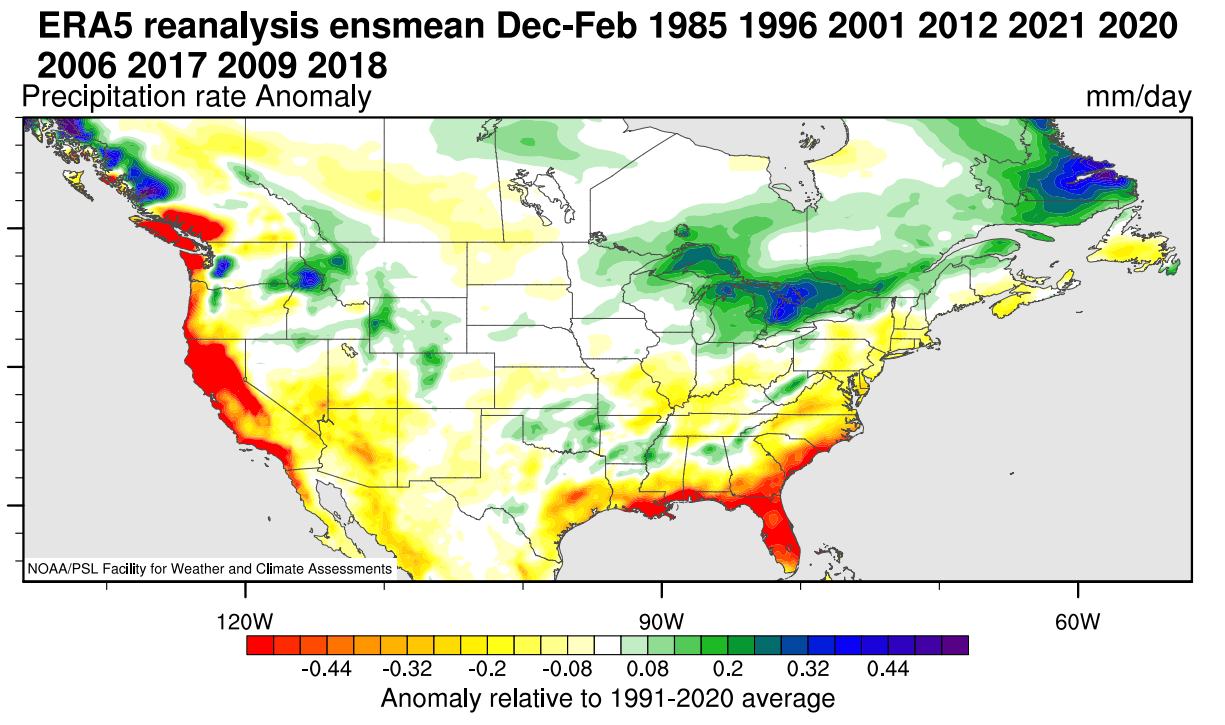
Precipitation-wise, drier La Nina winters are usually over the southwestern United States and Canada. Drier conditions are also found in the southeastern United States, as La Nina means a weaker subtropical jet stream and less moisture for the east. More precipitation is typical over the northwestern United States, the Great Lakes, and parts of the northeast.
But speaking of precipitation, what about snowfall? The data shows that the La Nina jet stream also changes the snowfall potential over North America as the pressure systems take a different path.
The colder air is more easily accessible to the northern United States, which increases the snowfall potential if moisture is available. In the graphic below by NOAA-Climate. You can see the average snowfall pattern for weak La Nina years, as expected this Winter season.
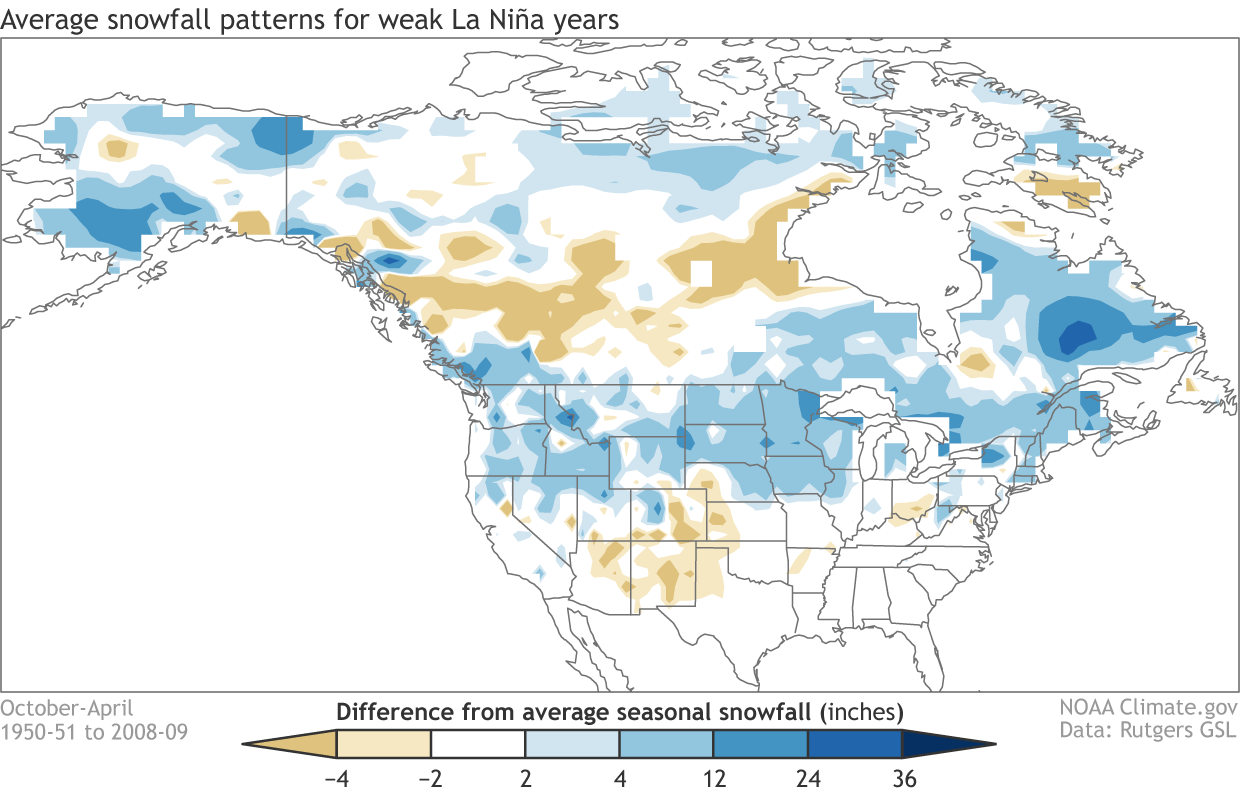
Besides the northwestern United States and the Midwest, we can see more snowfall potential over the northeastern United States and eastern Canada.
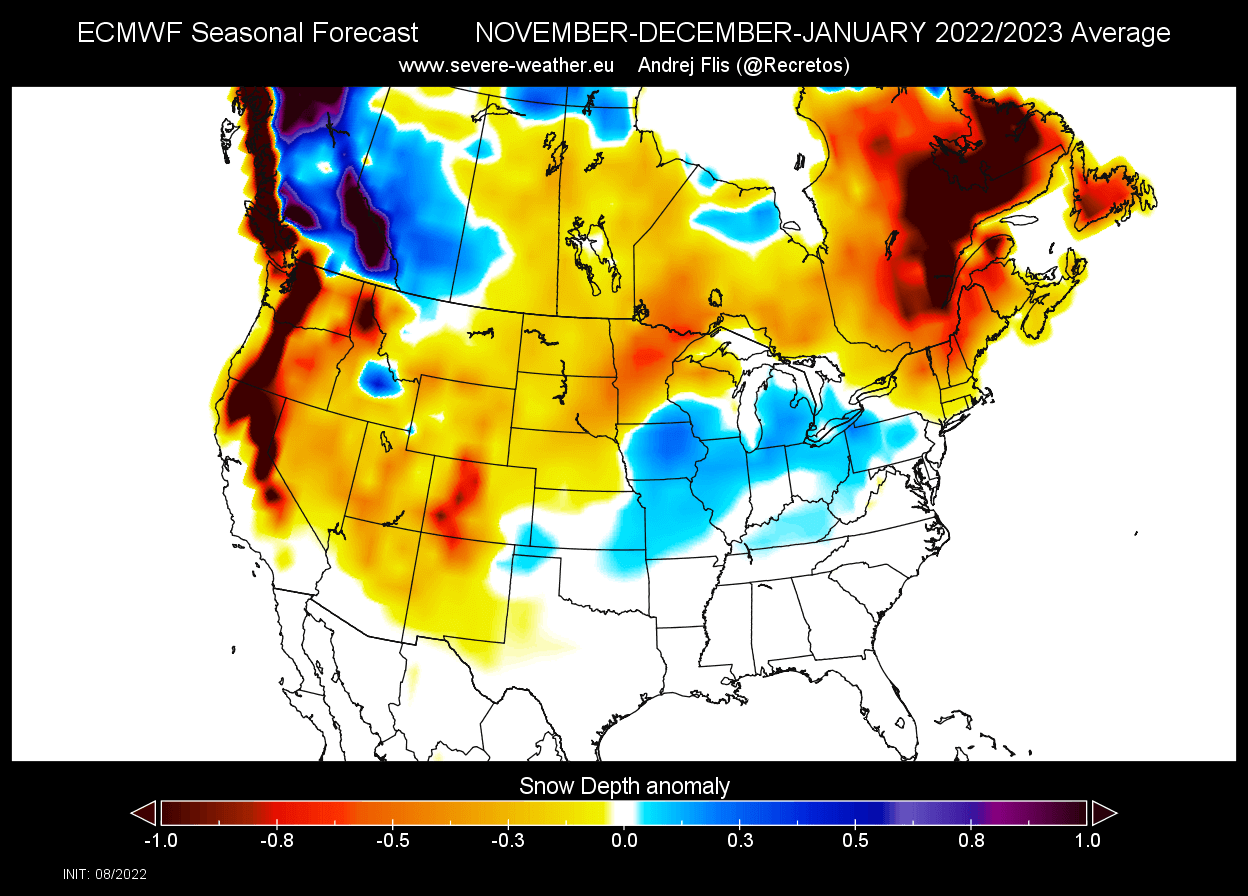
But now, we will look at some early Winter snowfall predictions from actual forecast models. We know what to expect now from historical data.
Starting with the average image for the United States and Canada, we can see more snowfall over western Canada and the eastern United States. Surprisingly, we can see less snowfall forecast over the western United States. This is potentially very bad news for Lake Mead and the Western Drought.
metmike: I'm thinking that the Upper Midwest will see more snow than this but seasonal forecasts are low skill by their nature and with this being a seasonal snow forecast, even lower skill. Trying to fine tune it is more speculation than weather forecasting.
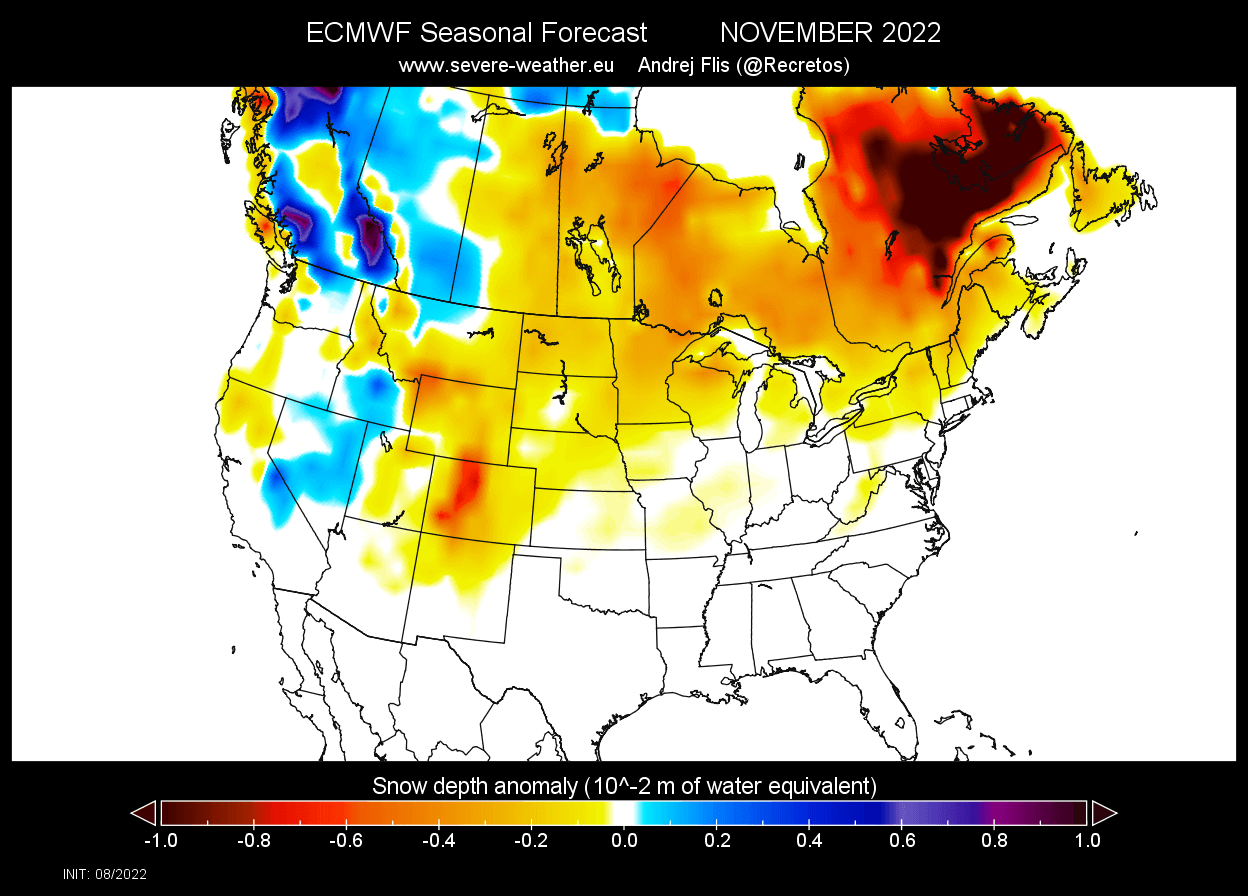
The November snowfall forecast shows some increased snowfall potential over the higher elevations of the western United States and Canada. However, in late Fall, less snowfall is seen over much of central and eastern Canada and the Midwestern United States.
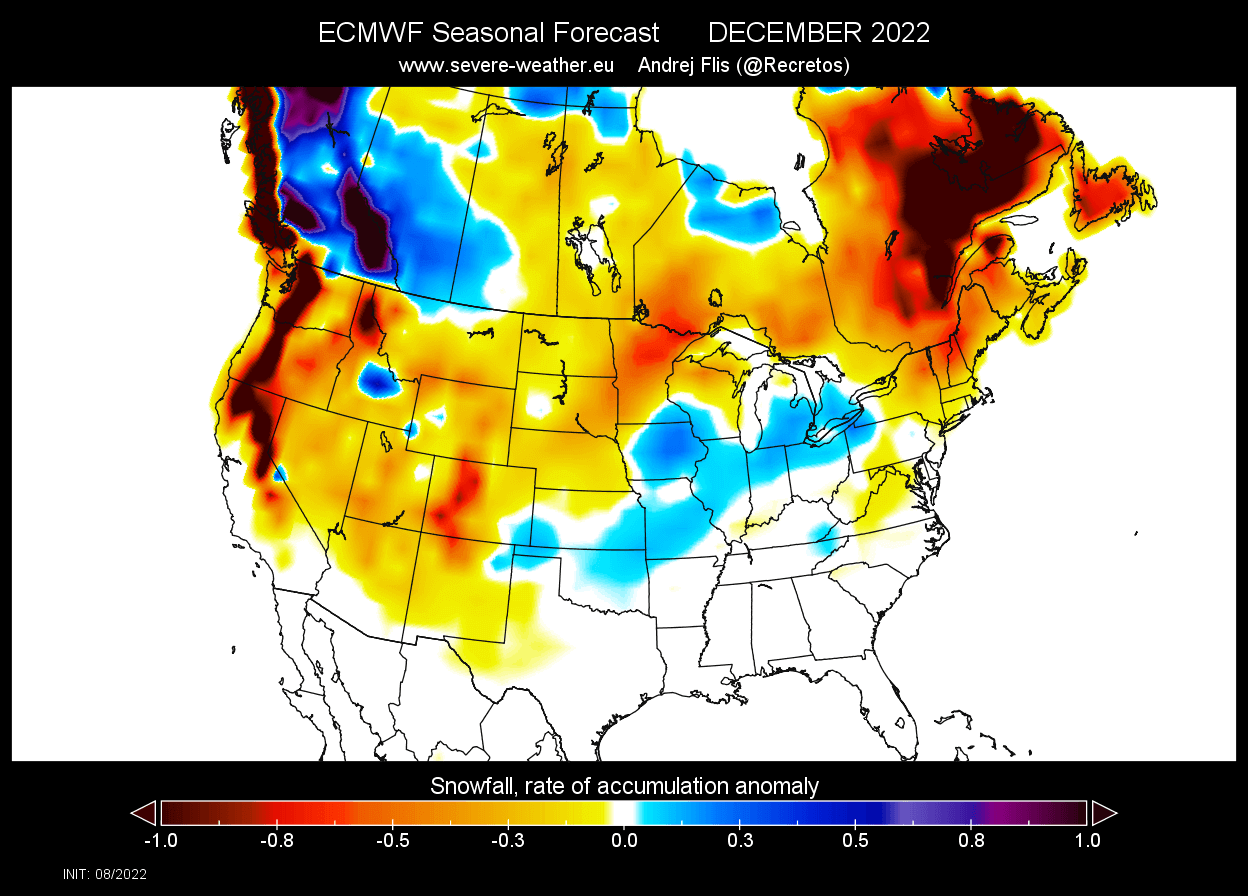
The December snowfall forecast shows the potential increase over the south-central United States, expanding over parts of the Midwest into the Great Lakes. Less snowfall is shown in this forecast run over the western United States.
January snowfall forecast shows an even stronger pattern, with more snowfall in the same regions as the previous month. But the lack of snowfall over the upper Midwest and the northwestern United States is surprising in a La Nina winter. This is likely to be corrected in future runs.
Thanks much Jean!
Maybe in recent years The Farmers Almanac is using some technology that they didn't decades ago when they had such poor skill?
Their Winter 2022/23 forecast actually makes sense based on the La Nina.
From what I remember, the Farmers Almanac seemed to miss the most from being too cold and snowy more than any other types of weather.
Here it is again:
by Farmers' Almanac Staff Updated: August 1, 2022
https://www.farmersalmanac.com/farmers-almanac-releases-an-extreme-winter-forecast-for-2022-23
Here's another sharp person's analysis:
Call it what you like—triple-dip, three-peat, three-bean salad—we are facing the third La Niña winter in a row. This is the third time in our historical record of ENSO (El Niño-Southern Oscillation, the whole El Niño and La Niña system), which dates back to 1950, that we have had three La Niña winters in a row. That’s a lot of threes! The other stretches were 1973–1976 and 1998–2001.
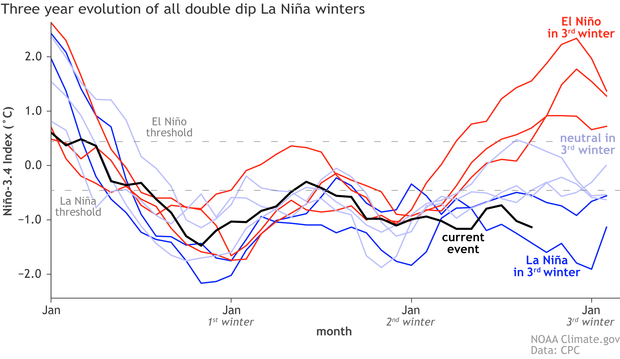
Three-year history of sea surface temperatures in the Niño-3.4 region of the tropical Pacific for 8 previous double-dip La Niña events. The color of the line shows the ENSO state in the third winter (red: El Niño, darker blue: La Niña, lighter blue: neutral). The black line shows the current event. Monthly Niño-3.4 index is from CPC using ERSSTv5. Time series comparison was created by Michelle L’Heureux, and modified by Climate.gov.
+++++++++++++There are many different things that go into a seasonal forecast, but the two biggies are ENSO and recent trends, meaning the tendency of temperature and rain/snow over the recent 10 or 15 years. Tom described how the recent trends work, so take a look at that post for details.
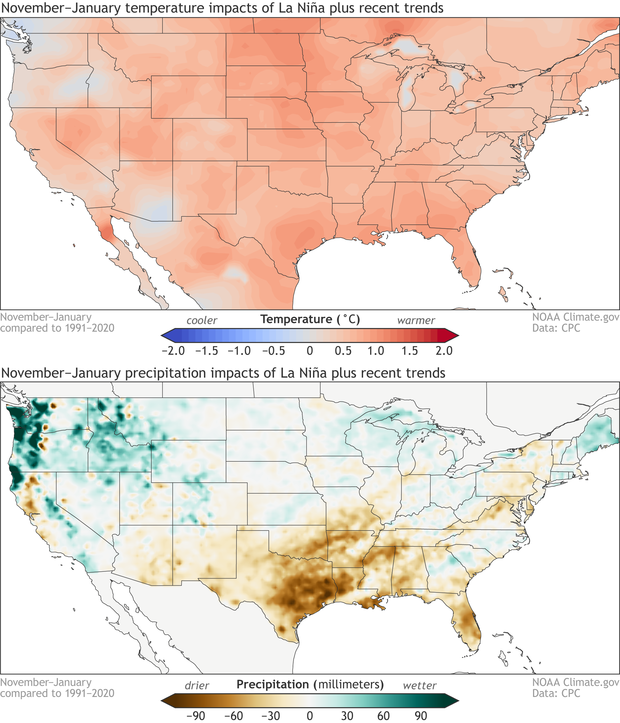
November–January average temperature (top) and precipitation (bottom) compared to the long-term average for the combination of historical La Niña events and climate trends. Data is based on the CPC ENSO composites and modified by Climate.gov.
Clearly, when you combine the characteristic temperature pattern of La Niña with recent trends, you end up with a warmer-than-average pattern during November–January over nearly the entire contiguous U.S. (You can see maps with La Niña and trends separated here.) Also, the southern plains tend to be drier than average, with more rain and snow falling in the northwest. (Separated maps here.) The Climate Prediction Center’s updated outlook for the November–January and upcoming winter will be released next Thursday.
I'VE ALWAYS JUST PAID ATTENTION TO NATURE, FOR THE MOST PART.... THEN, I GO READ THE 1-3 DAY FORECAST. NATURE IS PRETTY SMART!! LOL
MY DUCKS WERE EXCELLENT FORECASTERS. THEY'D ALL LAY FACING THE SAME WAY,10-12 HOURS BEFORE SNOW OR RAIN STORMS, WITH A LOT OF WIND. THEY ALWAYS FACED THE DIRECTION THE WIND WOULD EVENTUALLY COME FROM. WHY? TO KEEP THE WIND FROM GETTING UNDERNEATH THEIR FEATHERS. THEY'D LAY LIKE THAT THROUGHOUT THE DURATION OF SNOW STORMS.... AND WIND UP ALMOST BURIED IN THE SNOW.
SADLY ~ THE EAGLES, MINK, COYOTES, HAWKS & SNAPPING TURTLES GOT THEM ALL WITHIN A 2 YEAR TIME SPAN.
NOW, I MAINLY PAY ATTENTION TO BIRD MIGRATION. THE BUZZARDS HEADIN' SOUTH, WERE ABOUT A MONTH EARLY, THIS YEAR, & TODAY ~ I SAW MY 1ST JUNCO... A MONTH EARLY.(THEY STAY ALL WINTER) MY HUMMINGBIRDS DISAPPEARED 3 WEEKS EARLY.
TIME WILL TELL
