Previous threads:
Drought in Argentina-NOT in Brazil!
27 responses |
Started by metmike - Oct. 20, 2022, 12:19 a.m.
https://www.marketforum.com/forum/topic/89848/
Beans
12 responses |
Started by Jim_M - Nov. 15, 2022, 10:26 a.m.
https://www.marketforum.com/forum/topic/90664/
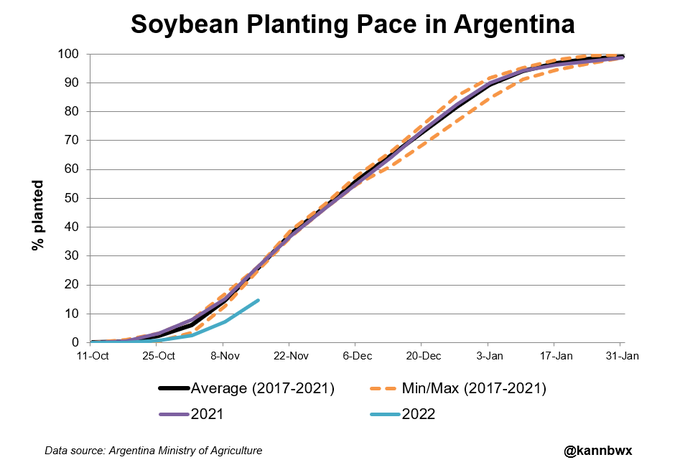
#Argentina's planting pace of #soybeans is usually very reliable, i.e. not too much difference from year to year. But things are significantly slower this year, with planting 17% complete this week versus averages near 30%. Soil conditions have been very dry.
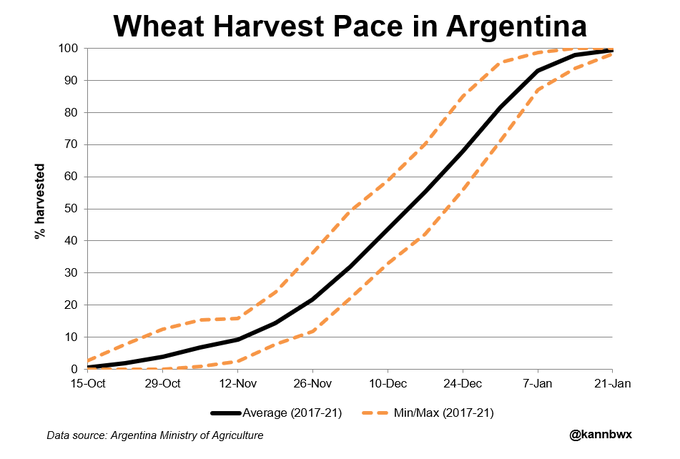
I don't see #wheat harvest progress data yet (usually near 15% complete by now), but this is what the season looks like. #Argentina's ministry Thursday pegged the crop at 13.4 mmt, down 39% on the year due to extreme drought. USDA's current estimate is 15.5 mmt.
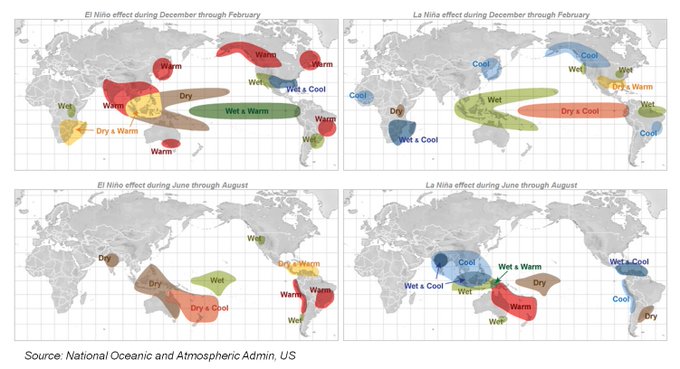
Here's how La Nina/El Nino impact weather globally in diff seasons. Effects in USA clearer in winter. If you want a refresher, ENSO broadly encompasses air pressure differences, trade wind patterns & sea surface temps across the Pacific Ocean, and it influences weather globally.
+++++++++++++
La Nina for Winter is the top right map.
Am I looking at this map right? Looks like Argentina is going to get some rain next week?
Nope! Just the opposite, Jim!
That's just the operational GFS model too.
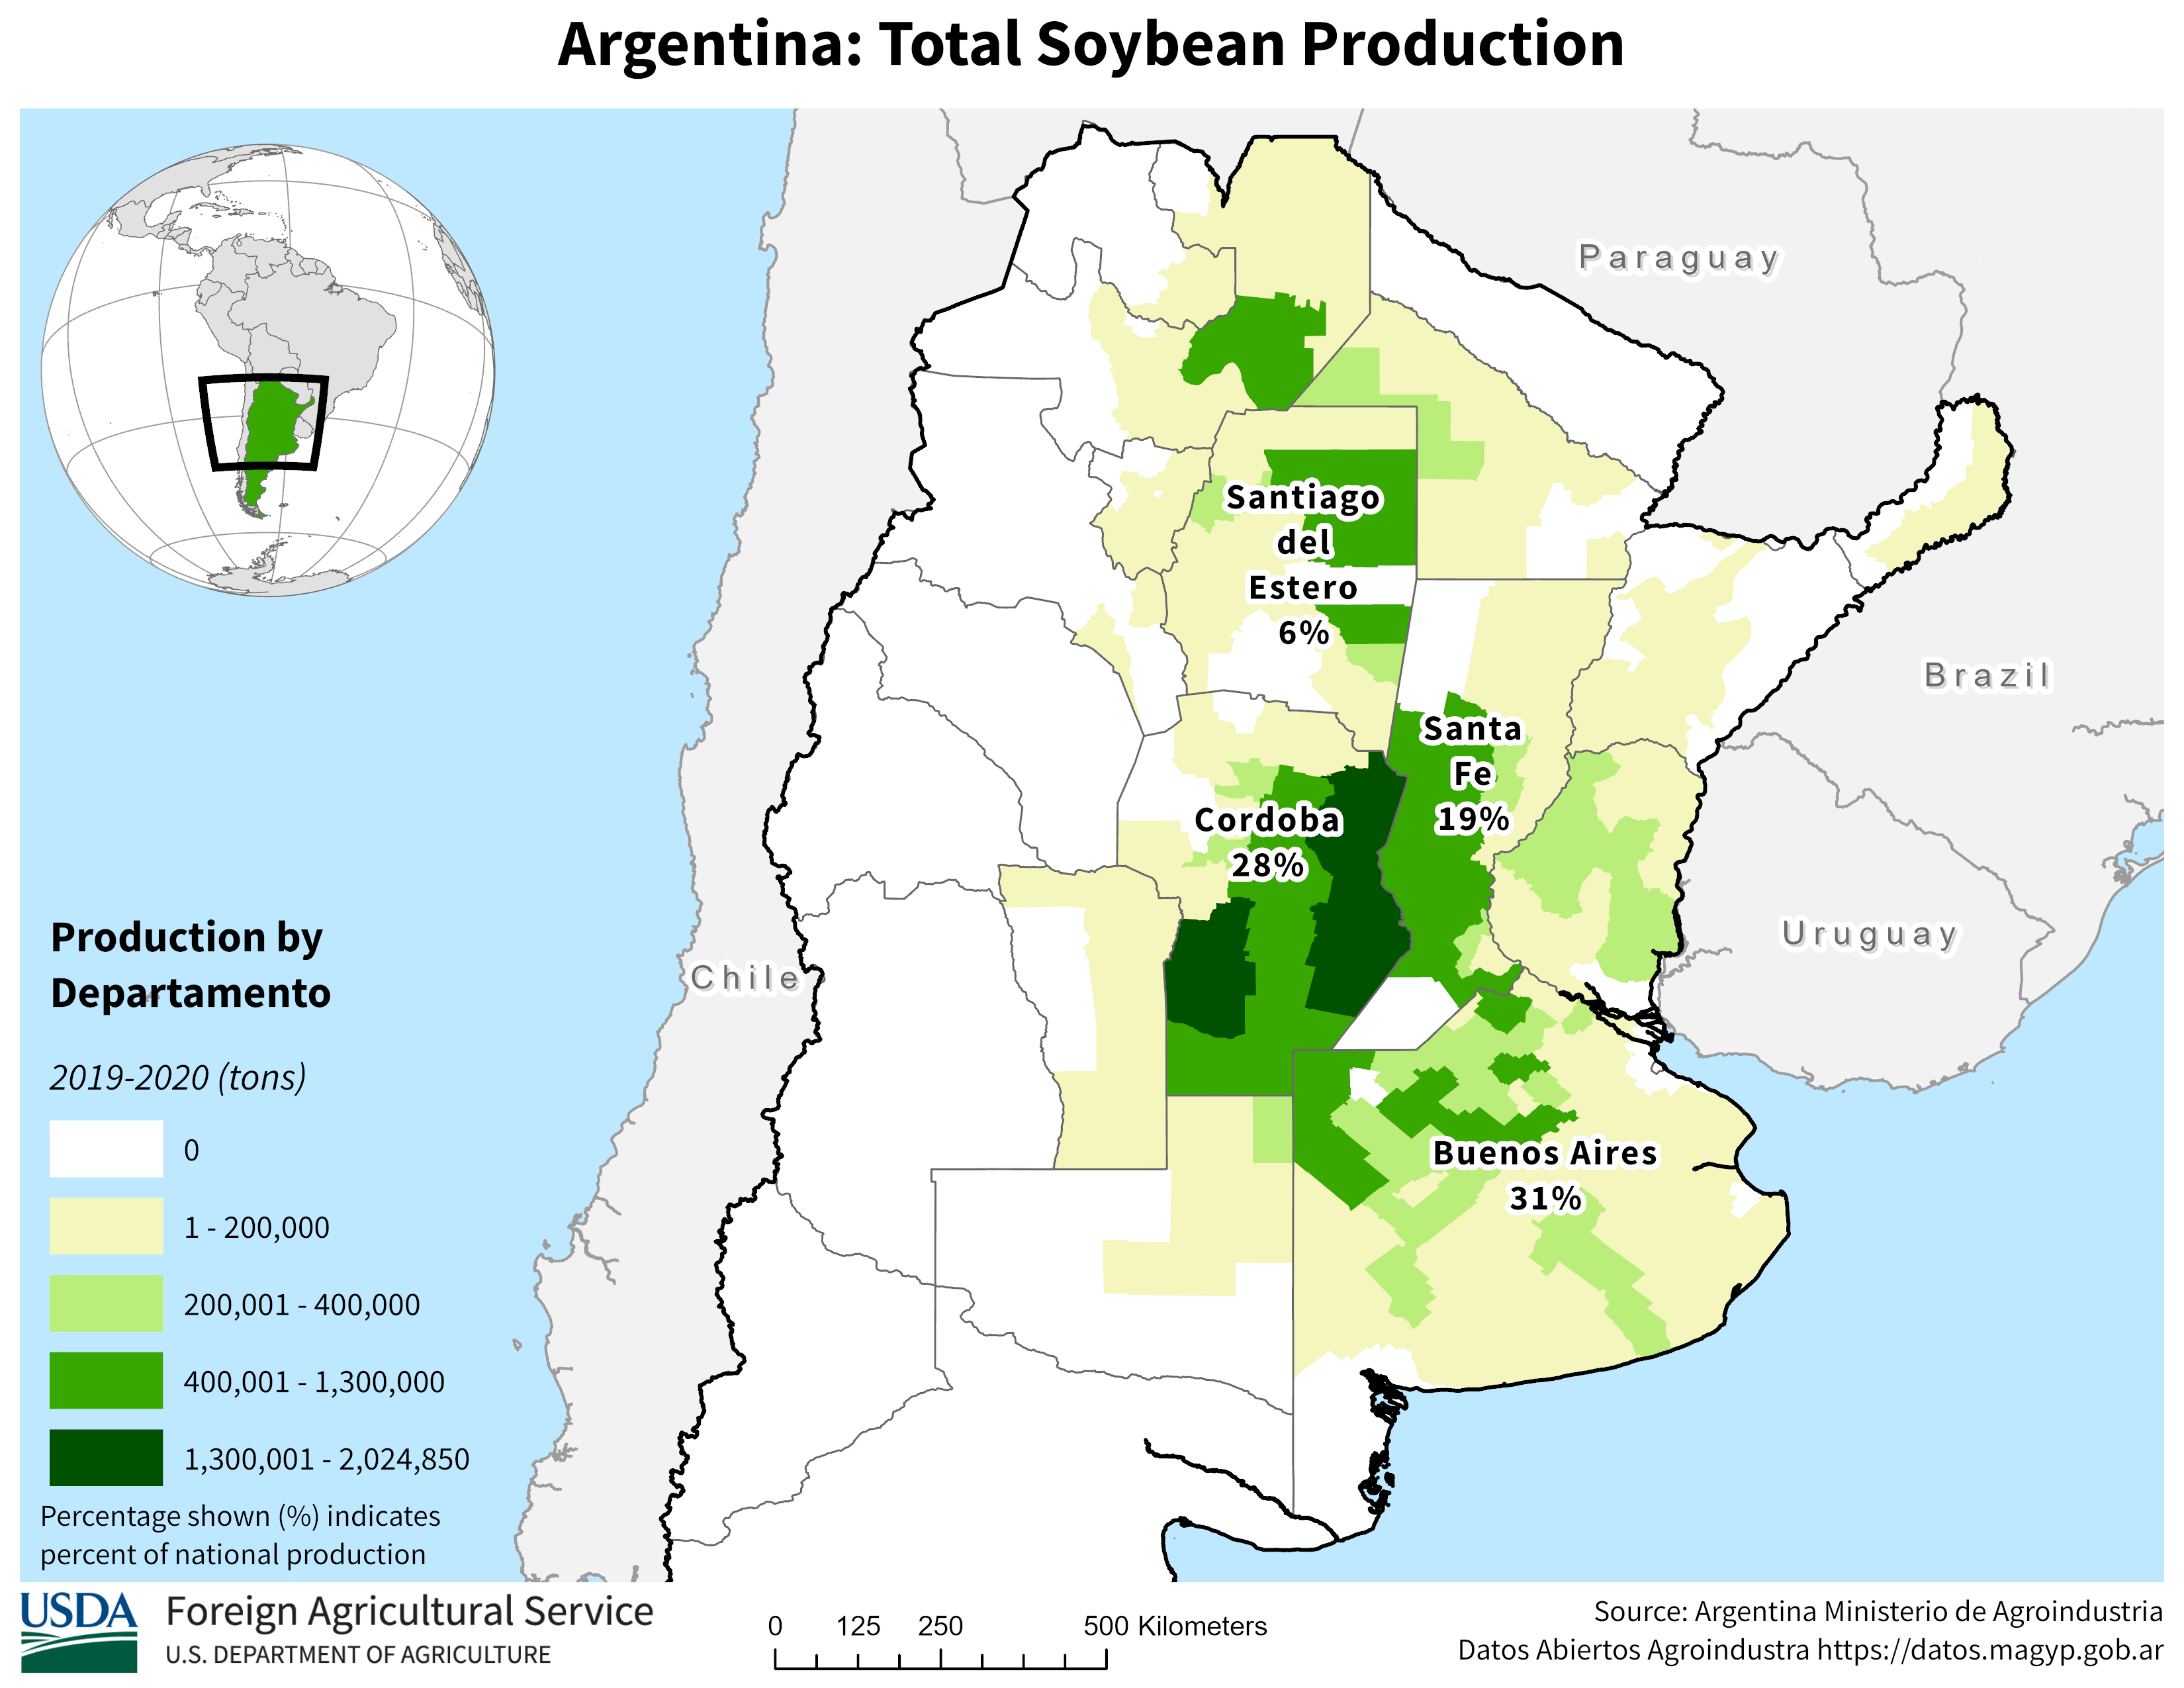
Here's more. This is where they grow soybeans in Argentina.
https://ipad.fas.usda.gov/rssiws/al/ssa_cropprod.aspx

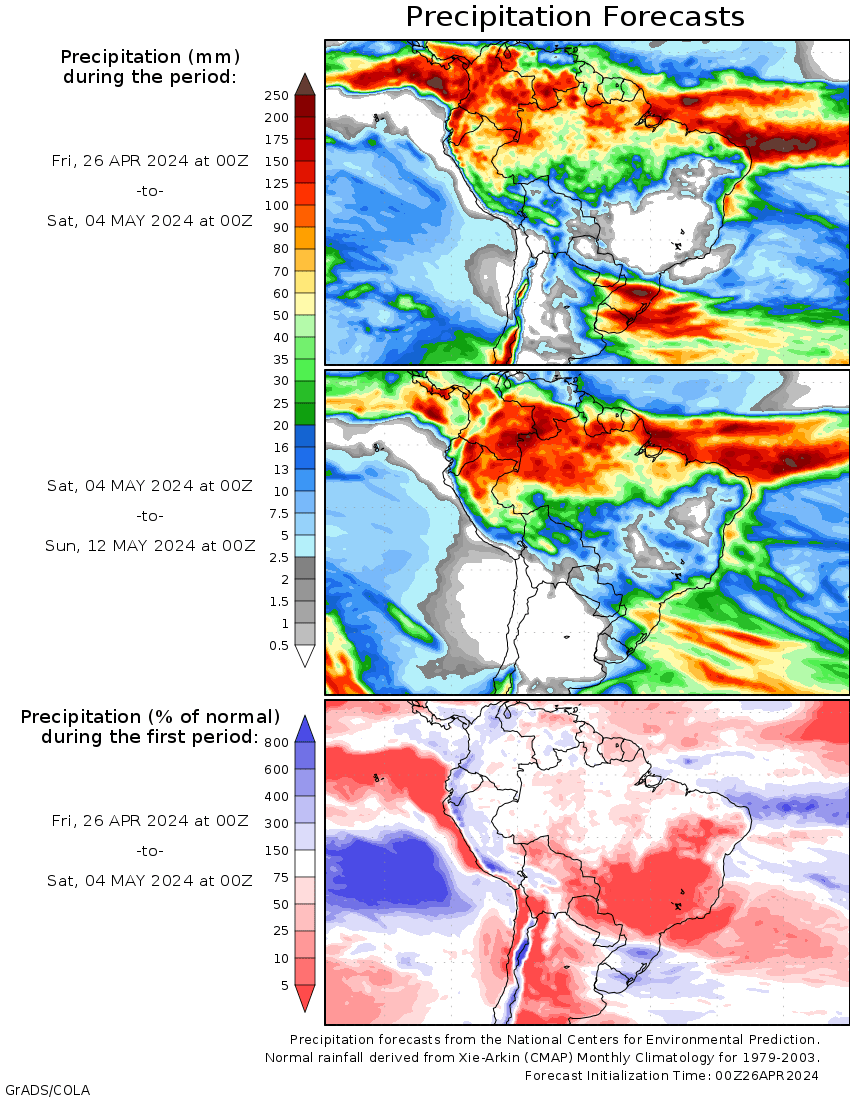
Here's your maps again, with the update as well as the very bullish negative departure from average(which you decided not to pass on with your maps).
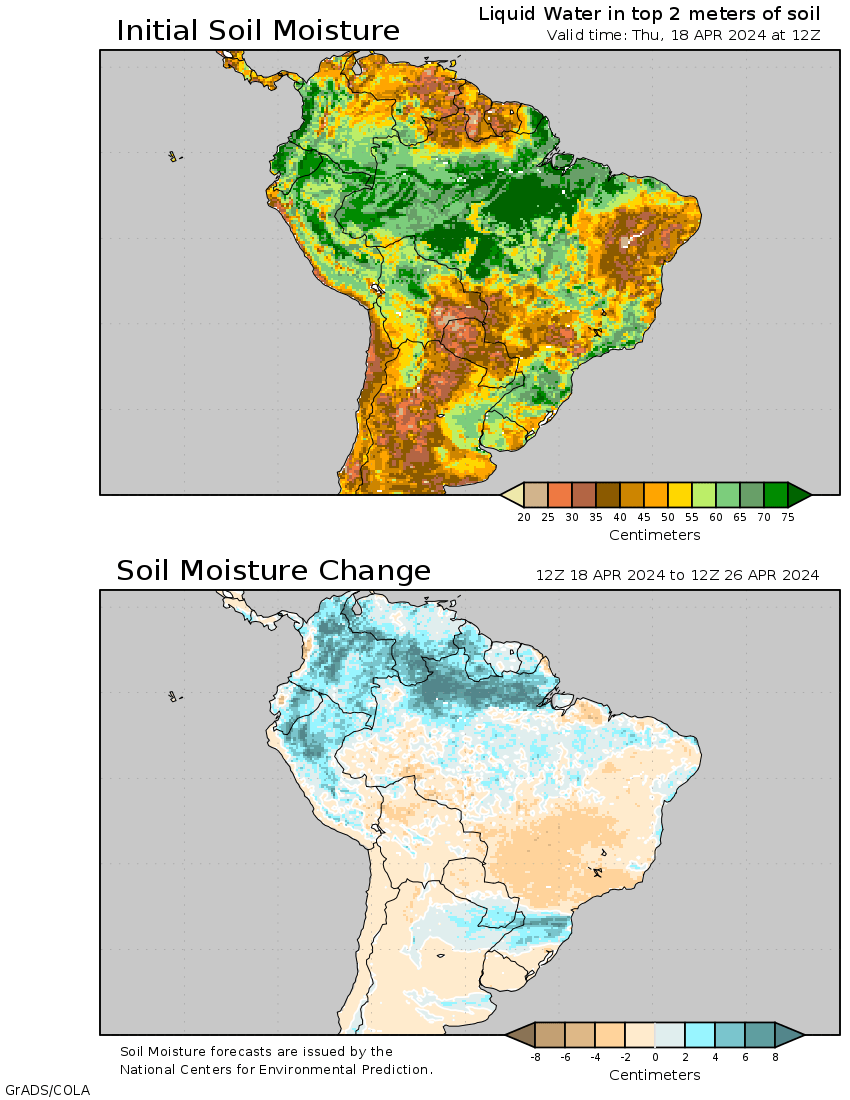
Also the change in soil moisture-very bullish, which is at the same site that you copied but didn't send that. You must be short for that interpretation.
http://wxmaps.org/outlooks.php
 ++++++++++++++++++++++++
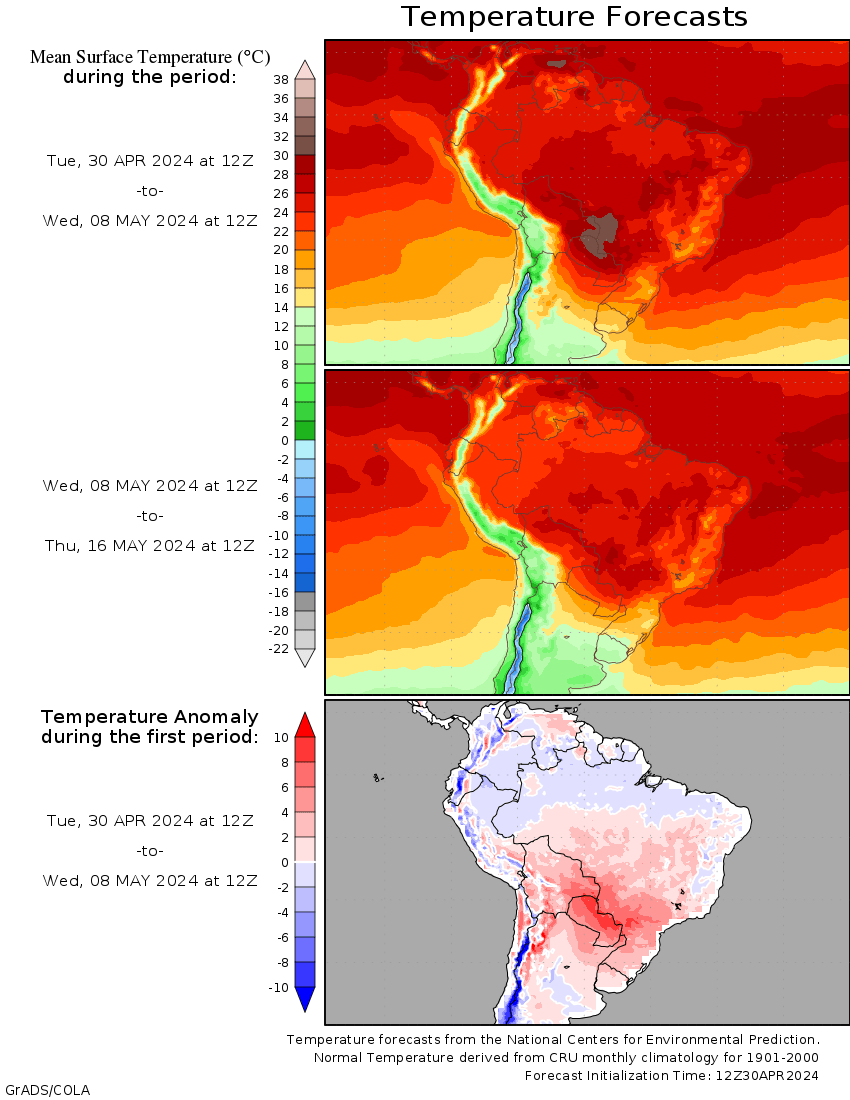
In addition, here's the temps from your link. This is pretty bullish for beans.
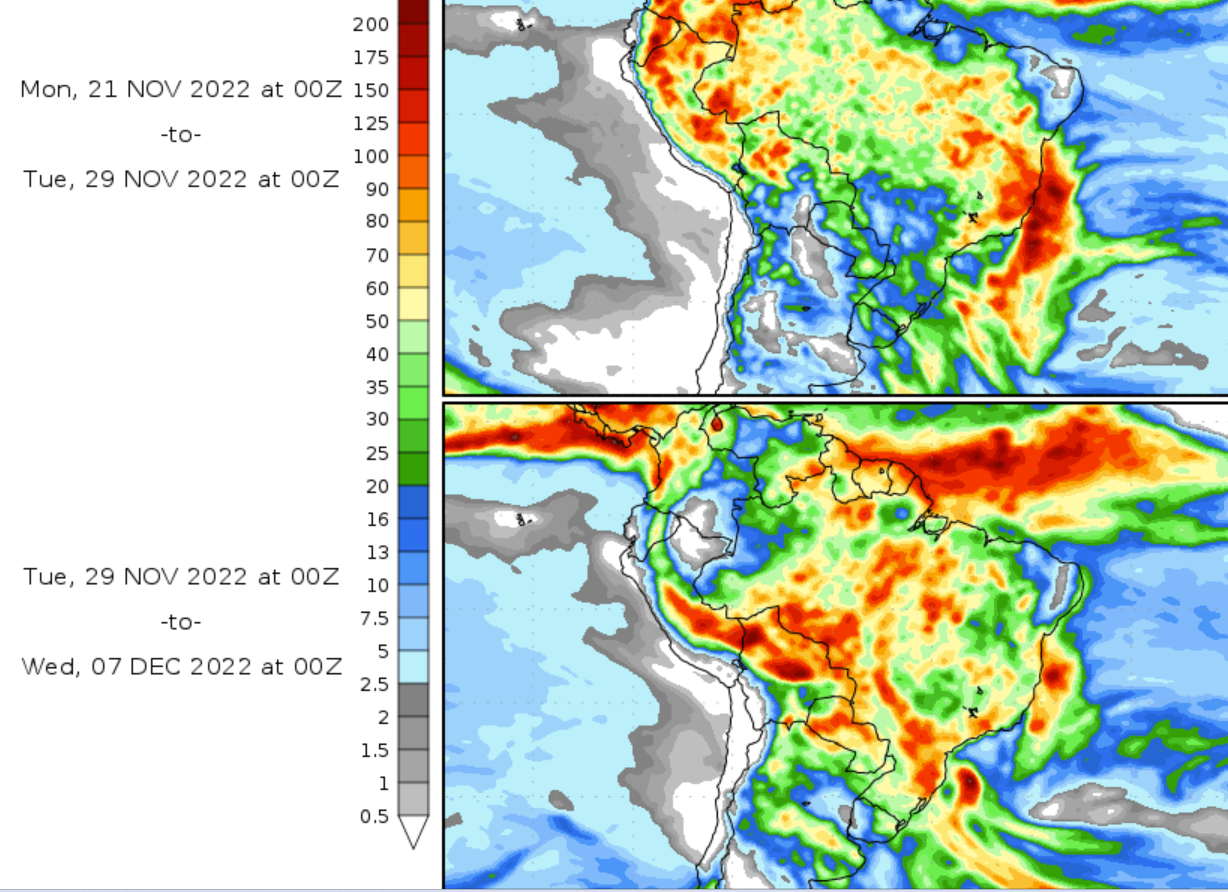
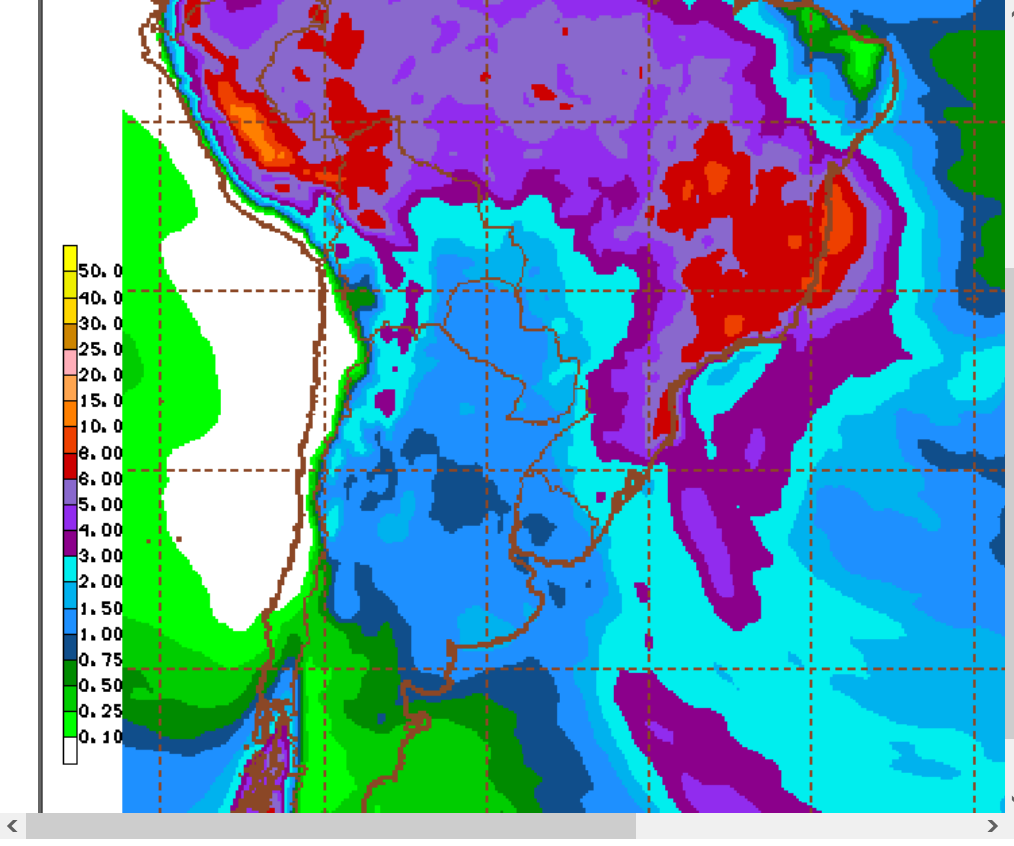
Here's the last 12z GFS ensemble solution. Maybe an inch of rain in some places over the next 2 weeks, which is less than half of normal. Others places, event less than that. Bullish weather for beans.
https://mag.ncep.noaa.gov/Image.php
++++++++++++++++
Here's more maps showing how dry it's been in N.Argentina this year. Pretty major drought!
Global precip. % of normal for different periods from 7 days to 180 days(6 months). Note the droughts in the US and key soybean production areas of N.Argentina.
https://www.cpc.ncep.noaa.gov/products/Global_Monsoons/gl_obs.shtml
https://www.cpc.ncep.noaa.gov/products/Precip_Monitoring/Figures/global/n.7day.figb.gif
I didn't decide to omit any maps. The one I pasted was the only one I really ever look at. I don't have the expertise in that area that you do. That's why I asked. :)
Plant in the dust, bins will bust! :)
OK, sorry Jim.
Maybe I can help out a bit here.
You must not be getting it from the main source that I use and post or doing something different because it's actually impossible forme to not get all 3 maps and only get just the 2 that you showed when I cut and paste like this below. Also, I note that yours are not updated, so they were selected differently by a source as a frozen image. Your 2 maps have the OLD solution from last night. The ones at the very bottom of this page will update every 12 hours, just like the ones in the posts above.
I can post it 1 time in a thread and it updates every 12 hours automatically.
To get these maps, do this:
Here's the same link that I always provide:
http://wxmaps.org/outlooks.php
After going there, what you want to do is select "South America" for domain, then for parameter, you can pick precipitation, temperature or soil moisture:
I saved a frozen image of the entire screen below.
Then use copy image to cut it and paste it if desired. I hope that makes sense, Jim.
I only snipped what I could see on my screen to induce conversation. I use the same web site and see the same maps.
I was just looking for your opinion. It’s all good.
I just spent 30 minutes typing and copying stuff for you and lost it from an internet issue as it was about to got out!@#@#
So here goes again(abbreviated this time)......you're worth it!
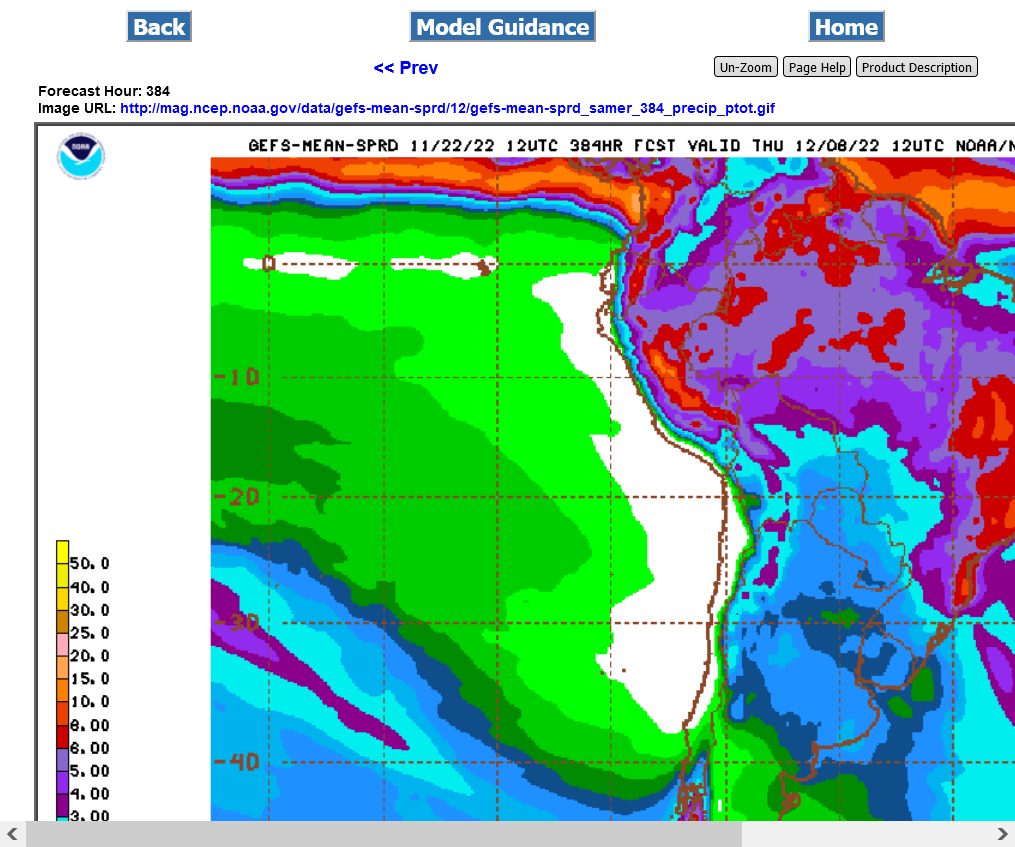
The link we are discussing is the Operational GFS. Just 1 model and very unreliable in week 2.
This is why I use the GFS ensemble model which is an average of a couple dozen individual model solutions. MUCH more reliable. Here is how to get/use it.
Main page:
Pick this
https://mag.ncep.noaa.gov/model-guidance-model-area.php
Then pick
and
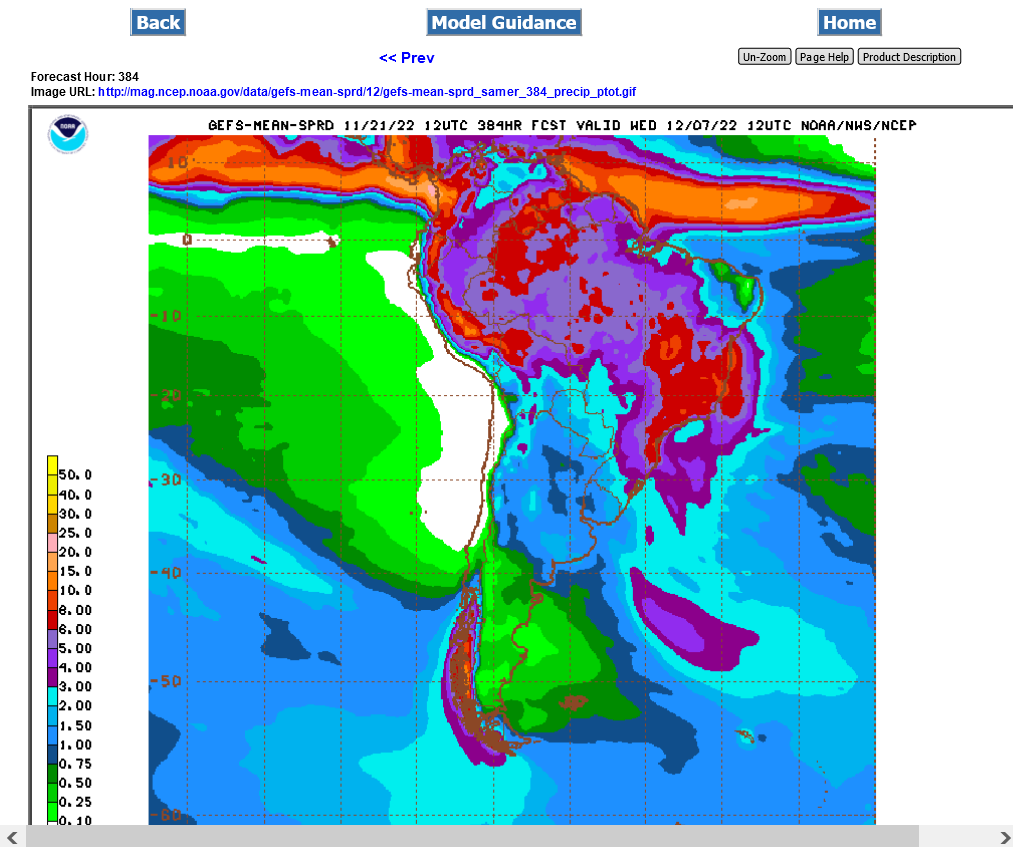
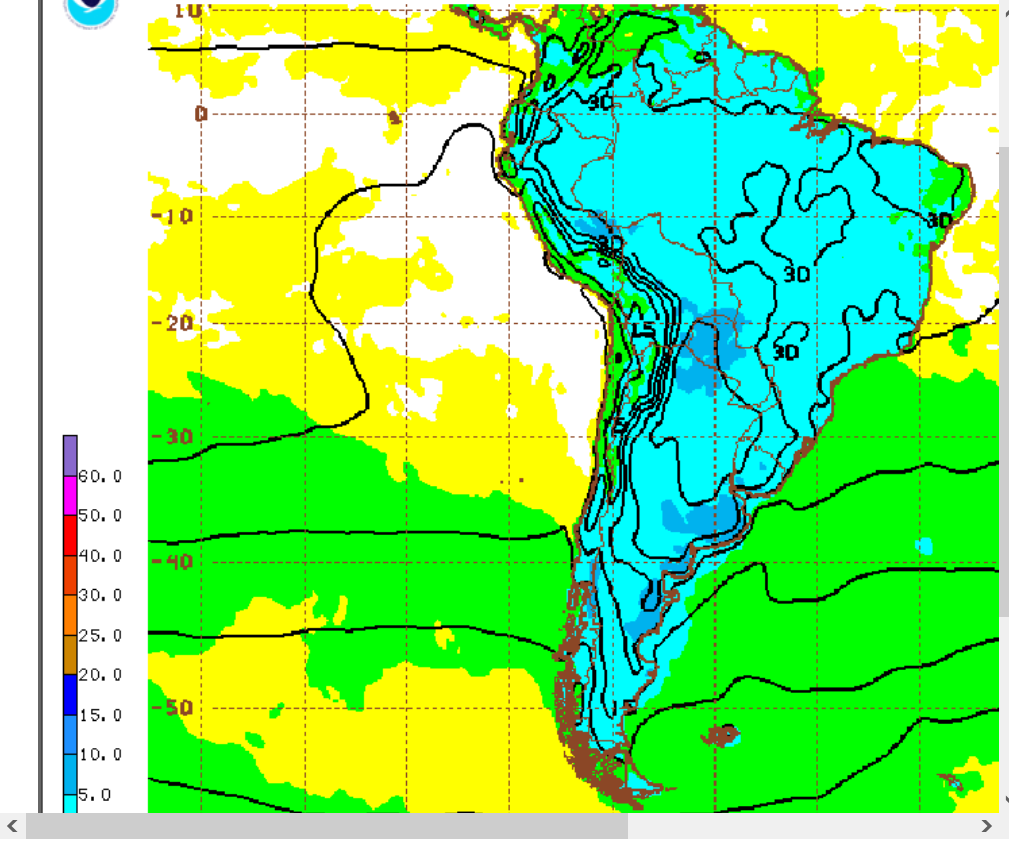
You've be here: Pick precio-ptot and 384 hours to get total precip thru December 7th.
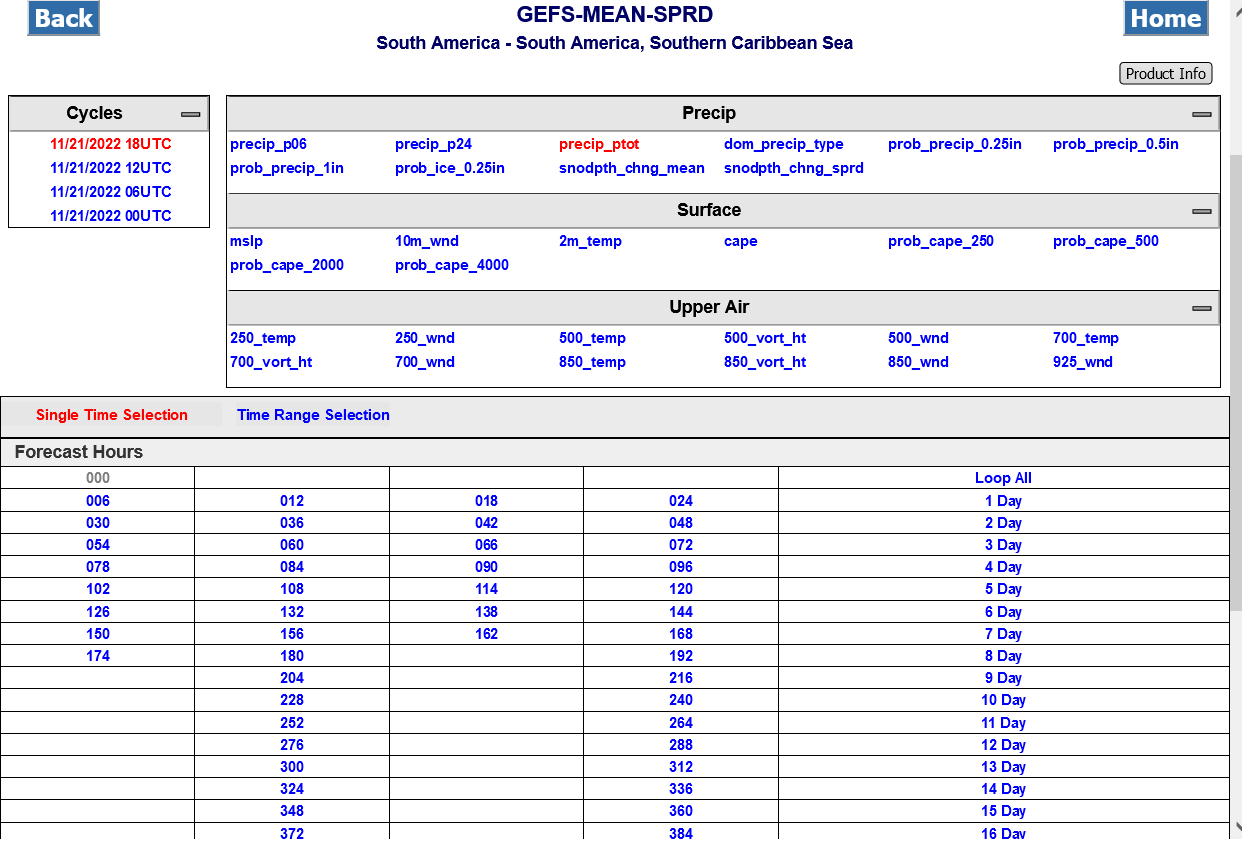
This is the map: The green in the center is less than .75" or less than 25% normal rains.

Here's another map below. Hit
| | 2m_temp |
This is the temp in C at around 6 feet above the ground. The area in the center is the 35 deg. C isotherm or 95+ deg. F. This would be around mid afternoon on Dec 7th. Some areas inside that area will be 100+ F!!!
F isn't for Fahrenheit, it's what the farmers in Argentina are saying about this weather forecast(-:
When you see the 40 deg. isotherm, that means 104 deg F or hotter.
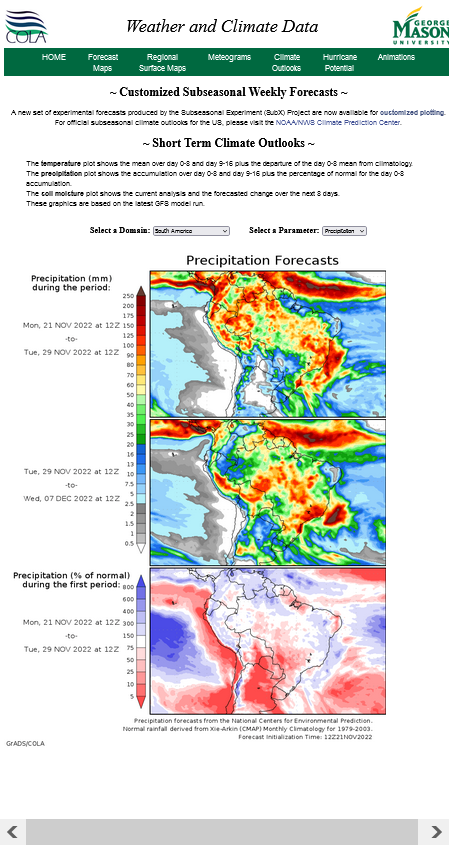
For those interested in obtaining the maps we discussed earlier.
Go to this link:
http://wxmaps.org/outlooks.php
Then make the choices below.
Domain: South America
Select a parameter: either temp, precip or soil moisture. Below is precip, saved
as a frozen frame. I did this so you can see the entire page.
Map 1 = week 1
Map 2 = week 2
May 3 is % normal precip from week 1.
All 3 maps come together.
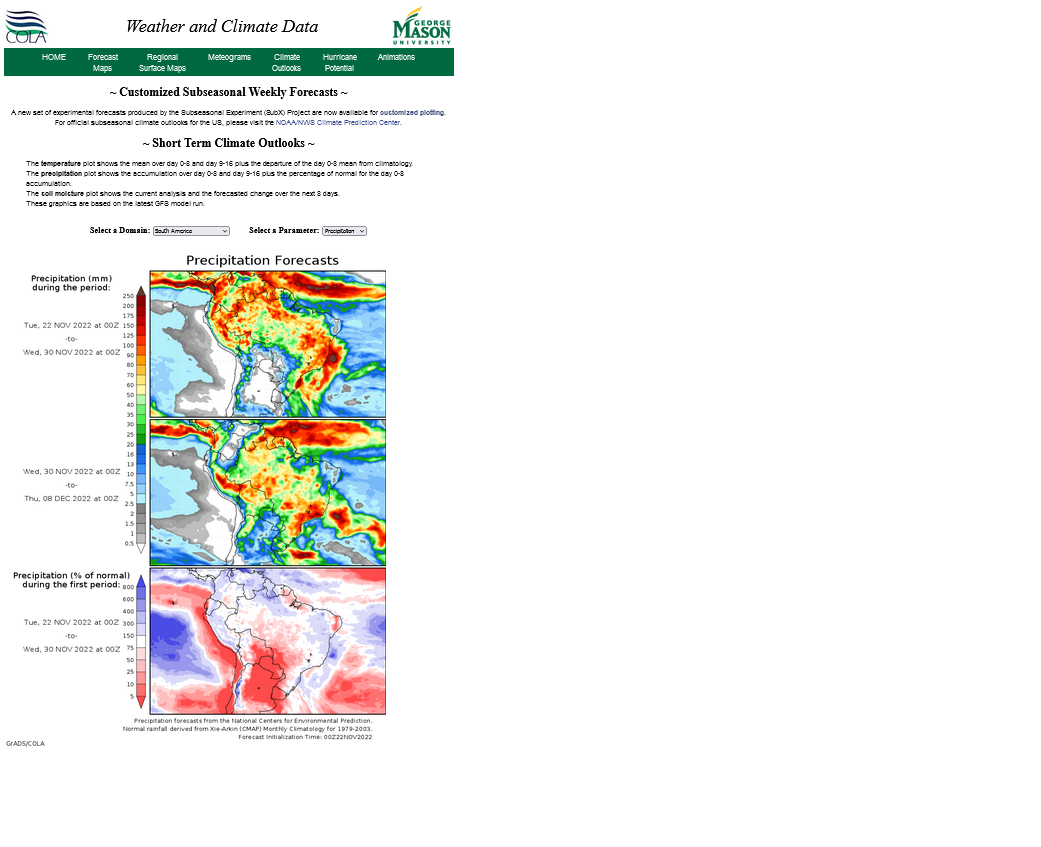
Here is the same map cut and pasted as an image, so that it will be constantly updated here. This was the last 0z GFS. In 12 hours, it will be updated with the 12z GFS.
This is an individual model and not nearly as good as the GFS ensemble posted above. This last run has taken out some of the wimpy week 2 rains from 24 hours ago.
Here's the last GFS ensemble. It's a frozen frame and won't be updated:
Unlike the operational model above, it actually ADDED a bit of rain......filling in the green that was on the previous run above.
https://mag.ncep.noaa.gov/Image.php
Thanks for the information Mike! I still think one of the many agricultural organizations is going to call 160 mmt before it is all said and done.
I sure wouldn't want to be long beans if Argentina's rains increase.
Here's the last 12z ensemble.
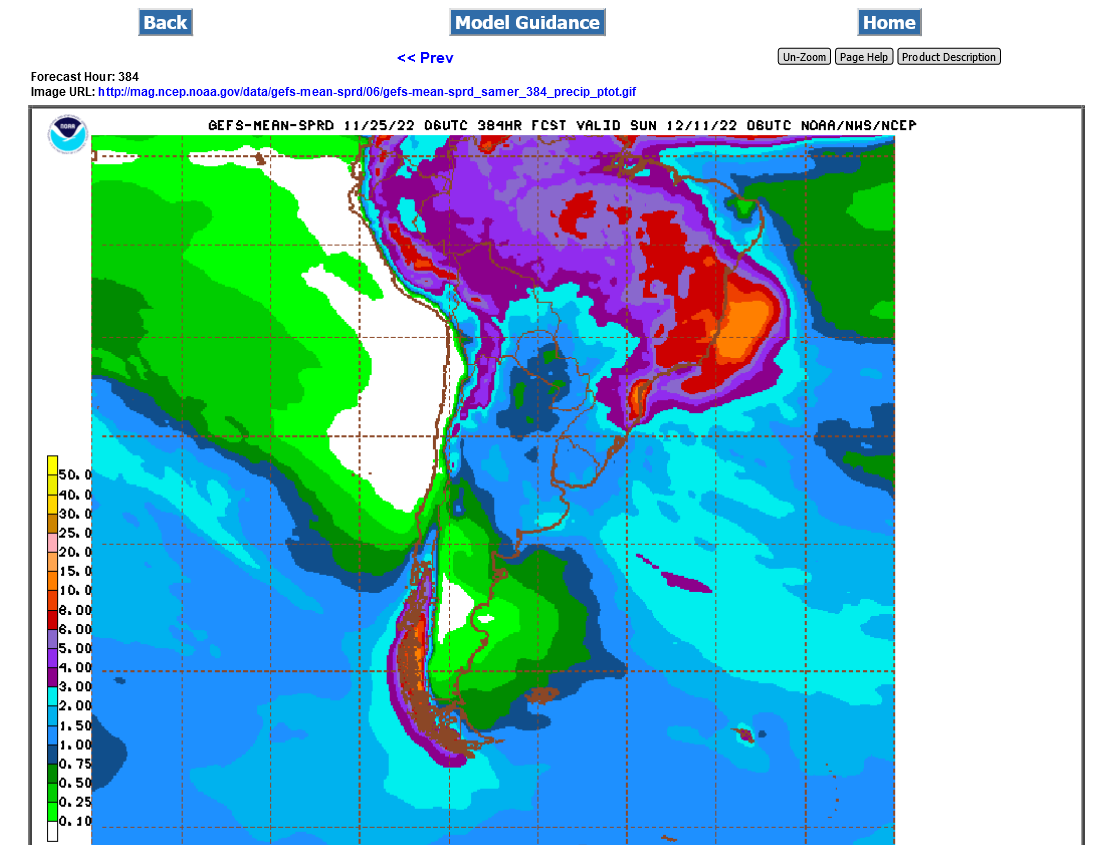
Latest 6z GFS, rains shifted slightly northwest. A tiny bit more for Argentina beans.
Maybe more of a model run variation instead of a pattern change to wetter.
https://mag.ncep.noaa.gov/Image.php