KEY EVENTS TO WATCH FOR:
Monday, December 5, 2022
9:45 AM ET. November US Services PMI
PMI, Services (previous 47.8)
10:00 AM ET. November ISM Report On Business Services PMI
Services PMI (previous 54.4)
Business Activity Idx (previous 55.7)
Prices Idx (previous 70.7)
Employment Idx (previous 49.1)
New Orders Idx (previous 56.5)
10:00 AM ET. November Employment Trends Index
ETI (previous 119.57)
ETI, Y/Y%
10:00 AM ET. October Manufacturers' Shipments, Inventories & Orders (M3)
Total Orders, M/M% (previous +0.3%)
Orders, Ex-Defense, M/M% (previous +0.8%)
Orders, Ex-Transport, M/M% (previous -0.1%)
Durable Goods, M/M%
Durable Goods, M/M%
11:00 AM ET. November Global Services PMI
PMI, Services (previous 49.2)
The STOCK INDEXES? http://quotes.ino.com/ex?changes/?c=indexes
The Dow closed higher on Friday and remains poised to extends the rally off October's low. The high-range close sets the stage for a steady to slightly lower opening when Monday's night session begins trading. Stochastics and the RSI are overbought but remain neutral to bullish signaling that sideways to higher prices are possible near-term. If the Dow extends the rally off October's low, the 75% retracement level of the January-October decline crossing at 34,893.55. Closes below the 20-day moving average crossing at 33,689.99 would signal that a short-term top has been posted. First resistance is Wednesday's high crossing at 34,589.77. Second resistance is the 75% retracement level of the January-October decline crossing at 34,901.54. First support is the 20-day moving average crossing at 33,689.99. Second support is the November 9th low crossing at 32,478.87.
The March NASDAQ 100 closed lower on Friday. Today's high-range close sets the stage for a steady to slightly lower opening when Monday's night session begins trading. Stochastics and the RSI are overbought but remain neutral to bullish signaling sideways to higher prices are possible. If March renews the rally off November's low, the 62% retracement level of the August-October decline crossing at 12,618.67 is the next upside target. Closes below the 50-day moving average crossing at 11,507.20 would signal that a short-term top has been posted. First resistance is the 50% retracement level of the August-October decline crossing at 12,229.32. Second resistance is the 62% retracement level of the August-October decline crossing at 12,618.67. First support is the 20-day moving average crossing at 11,731.84. Second support is the 50-day moving average crossing at 11,507.20.
The March S&P 500 closed slightly lower on Friday. The high-range close sets the stage for a steady to higher opening when Monday's night session begins trading. Stochastics and the RSI are overbought but remain neutral to bullish signaling that sideways to higher prices are possible near-term. If March extends the aforementioned rally, the September 13th high crossing at 4194.25 is the next upside target. Closes below the 20-day moving average crossing at 3993.70 would signal that a short-term top has been posted. First resistance is Thursday's high crossing at 4142.50. Second resistance is the September 13th high crossing at 4194.25. First support is the 20-day moving average crossing at 3993.70. Second support is the 50-day moving average crossing at 3852.87.
INTEREST RATES? http://quotes.ino.com/ex?changes/?c=interest ""
March T-bonds closed up 19-pts. at 130-03.
March T-bonds closed higher on Friday as they extend the rally off October's low. The high-range close sets the stage for a steady to higher opening when Monday's night session begins trading. Stochastics and the RSI are overbought but remain neutral to bullish signaling that sideways to higher prices are possible near-term. If March extends the rally off November's low, the 50% retracement level of the August-November decline crossing at 130-25 is the next upside target. Closes below the 20-day moving average crossing at 124-26 would signal that a short-term top has been posted. First resistance is today's high crossing at 130-09. Second resistance is the 50% retracement level of the August-October decline crossing at 130-25. First support is the 10-day moving average crossing at127-08. Second support is the 20-day moving average crossing at 124-26.
March T-notes closed up 50-pts. at 114.245.
March T-notes closed higher on Friday as it extends the rally off October's low. The high-range close sets the stage for a steady to higher opening when Monday's night session begins trading. Stochastics and the RSI are overbought but remain neutral to bullish signaling that sideways to higher prices are possible near-term. If March extends the rally off October's low, the 50% retracement level of the August-November decline crossing at 115.090 is the next upside target. Closes below the 20-day moving average crossing at 112,194 would signal that a short-term top has been posted. First resistance is the 50% retracement of the August-October decline crossing at 115.090. Second resistance is the 62% retracement of the August-October decline crossing at 116.232. First support is the 20-day moving average crossing at 112.194. Second support is the 50-day moving average crossing at 111.305.
ENERGY MARKETS? http://quotes.ino.com/ex?changes/?c=energy ""
January crude oil closed lower on Friday as it paused a four-day rally off Monday's low. The low-range close sets the stage for a steady to lower opening when Monday's night session begins. Stochastics and the RSI are neutral to bullish signaling that sideways to higher prices are possible near-term. Closes above the 50-day moving average crossing at $83.55 would signal that a short-term low has been posted. If January renews this month's decline, the 50% retracement level of the 2020-2022 rally crossing at $72.40 is the next downside target. First resistance is the 50-day moving average crossing at $83.55. Second resistance is the November 11th high crossing at $89.20. First support is Monday's low crossing at $73.60. Second support is the 50% retracement level of the 2020-2022 rally crossing at $72.40.
January heating oil closed lower on Friday as it consolidated some of the rally off Tuesday's low. The low-range close sets the stage for a steady to lower opening when Monday's night trading session begins. Stochastics and the RSI are turning neutral to bearish signaling that sideways to lower prices are possible near-term. If January renews this month's decline, the 87% retracement level of the September-November rally crossing at $3.0325 is the next downside target. Closes above the 50-day moving average crossing at $4.4045 would signal that a short-term low has been posted. First resistance is the 50-day moving average crossing at $3.4045. Second resistance is the November 15th high crossing at $4.5789. First support is Monday's low crossing at $3.1082. Second support is the 87% retracement level of the September-November ally crossing at $3.0325.
January unleaded gas closed lower on Friday. The low-range close sets the stage for a steady to lower opening when Monday's night session begins trading. Stochastics and the RSI have turned neutral to bullish signaling that sideways to higher prices are possible near-term. Closes above the 20-day moving average crossing at $2.4280 would signal that a short-term low has been posted. If January renews the decline off November's high, September's low crossing at 2.1536. First resistance is the 20-day moving average crossing at $2.4280. Second resistance is the November 14th high crossing at $2.5317. First support is Monday's low crossing at $2.2196. Second support is September's low crossing at $2.1536.
January Henry natural gas closed lower on Friday as it extends the decline off November's high. The low-range close sets the stage for a steady to lower opening when Monday's night session begins trading. Stochastics and the RSI are neutral to bearish signaling that sideways to lower prices are possible near-term. If January extends this week's decline, the November 9th low crossing at 6.131 is the next downside target. If January renews the rally off October's low, the 62% retracement level of the August-November decline crossing at 8.449 is the next upside target.First resistance is November's high crossing at 8.177. Second resistance is the 62% retracement level of the August-November decline crossing at 8.449. First support is the November 14th low crossing at 6.131. Second support is October's low crossing at 5.645.
CURRENCIES? http://quotes.ino.com/ex?changes/?c=currencies ""
The March Dollar closed lower on Friday as it extended the decline off September's high. The low-range close sets the stage for a steady to lower opening when Monday's nights session begins trading. Stochastics and the RSI are oversold but remain neutral to bearish signaling that sideways to lower prices are possible near-term. If March extends the decline off September's high, the 75% retracement level of the January-September rally crossing at $101.331 is the next downside target. Closes above the November 21st high crossing at 107.500 would signal that a short-term low has been posted. First resistance is the November 21st high crossing at $107.500. Second resistance is the 50-day moving average crossing at $109.565. First support is the 62% retracement level of the January-September rally crossing at $103.643. Second support is 75% retracement level of the January-September rally crossing at $101.331.
The March Euro closed slightly higher on Friday as it extends the rally off September's low. The high-range close sets the stage for a steady to higher opening when Monday's night session begins trading. Stochastics and the RSI overbought but are turning neutral to bullish signaling that sideways to higher prices are possible near-term. If March extends the rally off September's low, the 25% retracement level of the 2018-2022 decline crossing at $1.07982 is the next upside target. Closes below the 20-day moving average crossing at 1.03851 would signal that a short-term top has been posted. First resistance is today's high crossing at $1.06245. Second resistance is the 25% retracement level of the 2018-2022 decline crossing at $1.07982 is the next upside target. First support is the 20-day moving average crossing at $1.03851. Second support is the 50-day moving average crossing at $1.01121.
The March British Pound closed lightly higher on Friday as it extends the rally off September's low. The high-range close sets the stage for a steady to higher opening when Monday's night session begins trading. Stochastics and the RSI are overbought but remain neutral to bullish signaling sideways to higher prices are possible near-term. If March extends the rally off September's low, the 50-week moving average crossing at 1.2438 is the next upside target. Closes below the 20-day moving average crossing at 1.1891 would confirm that a short-term top has been posted. First resistance is August's high crossing at 1.2324. Second resistance is the 50-week moving average crossing at 1.2438. First support is the 20-day moving average crossing at 1.1891. Second support is the 50-day moving average crossing at 1.1511.
The March Swiss Franc closed slightly lower on Friday. The mid-range close sets the stage for a steady to lower opening when Friday's night session begins trading. Stochastics and the RSI are overbought but remain neutral to bullish signaling that sideways to higher prices are possible near-term. If March extends the rally off November's low, August's high crossing at 1.08700 is the next upside target. Closes below the 20-day moving average crossing at 1.06099 would signal that a short-term top has been posted. First resistance is today's high crossing at 1.08460. Second resistance is August's high crossing at 1.08700. First support is the 20-day moving average crossing at 1.06099. Second support is the 50-day moving average crossing at 1.03776.
The March Canadian Dollar closed slightly lower on Friday. The mid-range close sets the stage for a steady to higher opening when Monday's night session begins trading. Stochastics and the RSI are turning neutral to bullish signaling that sideways to higher prices are possible near-term. Closes above last-Friday's high crossing at 75.16 would signal that a short-term low has been posted. Close below Tuesday's low crossing at 73.42 would open the door for a possible test of the November 3rd low crossing at 72.58. First resistance is last-Friday's high crossing at 75.16. Second resistance is November's high crossing at 75.71. First support is Tuesday's low crossing at 73.42. Second support is the November 3rd low crossing at 72.58.
The March Japanese Yen closed higher on Friday as it extends the rally off October's low. The mid-range close sets the stage for a steady to higher opening when Monday’s night session begins trading. Stochastics and the RSI are overbought but remain neutral to bullish signaling that sideways to higher prices are possible near-term. If March extends the rally off October's low, the 87% retracement level of the August-October decline crossing at 0.076735 is the next upside target. Closes below the 20-day moving average crossing at 0.072278 would confirm that a short-term top has been posted. First resistance is the 75% retracement level of the August-October decline crossing at 0.075398. Second resistance is the 87% retracement level of the August-October decline crossing at 0.076735. First support is the 20-day moving average crossing at 0.072278. Second support is the 50-day moving average crossing at 0.070653.
PRECIOUS METALS? http://quotes.ino.com/ex?changes/?c=metals ""
February gold posted an inside day with a lower close on Friday as it consolidated some of the rally off November's low. The mid-range close sets the stage for a steady to lower opening when Monday's night session begins trading. Stochastics and the RSI are neutral to bullish signaling that sideways to higher prices are possible near-term. If February extends the rally off November's low, August's high crossing at $1836.70 is the next upside target. Closes below the 20-day moving average crossing at $1762.80 would signal that a short-term top has been posted. First resistance is today's high crossing at $1818.70. Second resistance is August's high $1836.70. First support is the 20-day moving average crossing at $1762.80. Second support is the 50-day moving average crossing at $1713.20.
March silver closed higher for the fourth-day in a row on Friday as it extends the rally off September's low. The high-range close sets the stage for a steady to higher opening when Monday's night session begins trading. Stochastics and the RSI have turned neutral to bullish signaling that sideways to higher prices are possible near-term. If March extends the rally off October's low, the 75% retracement level of the March-August decline crossing at 24.779 is the next upside target. Closes below Tuesday's low crossing at 21.060 would confirm that a short-term top has been posted while opening the door for additional weakness near-term. First resistance is the 62% retracement level of the March-September decline crossing at 23.503. Second resistance is the 75% retracement level of the March-September decline crossing at 24.779. First support is Tuesday's low crossing at 21.060. Second support is last-Monday's low crossing at 20.790.
March copper closed higher on Friday as it extended the rally off Monday's low.The high-range close sets the stage for a steady to higher opening when Monday's night session begins trading. Stochastics and the RSI are neutral to bullish signaling that sideways to higher prices are possible near-term. If March renews the rally off September's low, the 50% retracement level of the March-July decline crossing at 4.0343 is the next upside target. If March renews the decline off November's high, the 50-day moving average crossing at 3.5255 is the next downside target. First resistance is November's high crossing at 3.9470. Second resistance is the 50% retracement level of the March-July decline crossing at 4.0343. First support is the 50-day moving average crossing at 3.5255. Second support is October's low crossing at 3.2980.
GRAINS? http://quotes.ino.com/ex?changes/?c=grains "
March Corn closed down $0.14 1/4-cents at $6.46 1/4.
March corn closed sharply lower on Friday marking a downside breakout of the trading range of the past three-weeks as it renewed the rally off October's high. The low-range close sets the stage for a steady to lower opening when Monday's night session begins trading. Stochastics and the RSI are neutral to bearish signaling that sideways to lower prices are possible near-term. If March renews the decline off October's high, the 50% retracement level of the July-October rally crossing at $6.40 is the next downside target. Closes above the 50-day moving average crossing at $6.80 1/4 would signal that a short-term low has been posted. First resistance is the 50-day moving average crossing at $6.80 1/4. Second resistance is the October 31st high crossing at $7.04 3/4. First support is the 50% retracement level of the July-October rally crossing at $6.40. Second support is the August 18th low crossing at $6.11 1/2.
March wheat closed down $0.22-cents at $7.61.
March wheat closed sharply lower on Friday as it extends the decline off October's high. The low-range close sets the stage for a steady to lower opening when Monday's night session begins trading. Stochastics and the RSI are oversold and remain neutral to bearish signaling that sideways to lower prices are possible near-term. If March extends this month's decline, psychological support crossing at $7.50 is the next downside target. Closes above the 20-day moving average crossing at $8.18 3/4 would signal that a short-term low has been posted. First resistance is the 20-day moving average crossing at $8.18 3/4. Second resistance is the 50-day moving average crossing at $8.60 3/4. First support is today's low crossing at $7.56 3/4. Second support is psychological support crossing at $7.50.
March Kansas City Wheat closed down $0.19 1/2 at $8.70 3/4.
March Kansas City wheat closed lower on Friday as it extended the decline off October's high. The low-range close sets the stage for a steady to lower opening when Monday's night session begins trading. Stochastics and the RSI are oversold but remain neutral to bearish signaling that sideways to lower prices are possible near-term. If March extends the decline off October's high, the August's low crossing at $8.18 3/4 is the next downside target. Closes above the 50-day moving average crossing at $9.44 is the next upside target.First resistance is the 50-day moving average crossing at $9.44. Second resistance is November's high crossing at $9.87 1/2. First support is today's low crossing at $8.60 1/4. Second support is August's low crossing at $8.18 3/4.
March Minneapolis wheat closed down $0.16 3/4-cents at $9.21 1/4.
March Minneapolis wheat closed lower on Friday. The low-range close sets the stage for a steady to lower opening when Monday's night session begins trading. Stochastics and the RSI are oversold but remain neutral to bearish signaling that sideways to lower prices are possible near-term. If March extends this week's decline, the September 19th low crossing at $9.15 is the next downside target. Closes above the 50-day moving average crossing at $9.64 1/4 would signal that a short-term low has been posted. First resistance is the 50-day moving average crossing at $9.64 1/4. Second resistance is the November 15th high crossing at $9.91 1/4. First support is today's low crossing at $9.19 1/4. Second support is the September 19th low crossing at $9.15.
SOYBEAN COMPLEX? http://quotes.ino.com/ex?changes/?c=grains "
January soybeans closed up $0.10 3/4-cents at $14.40 1/2.
January soybeans closed sharply lower on Thursday due to profit taking after testing resistance marked by the 62% retracement level of the June-July decline crossing at $14.76 3/4 on Wednesday. The low-range close sets the stage for a steady to lower opening when Friday's night trade begins. Stochastics and the RSI are overbought and are turning neutral to bearish signaling that sideways to lower prices are possible near-term. Closes below the November 17th low crossing at $14.06 3/4 would renew the decline off November's high. If January extends the rally off October's low, the September 21st high crossing at $14.93 1/2 is the next upside target. First resistance is the 62% retracement level of the June-July decline crossing at $14.76 3/4. Second resistance is the 75% retracement level of the June-July decline crossing at $15.15 1/2. First support is the November 17th low crossing at $14.06 3/4. Second support is the October 28th low crossing at $13.80 1/2.
January soybean meal closed up $3.40 at $425.00.
January soybean meal closed higher on Friday as it extends the rally off November's low. The high-range close sets the stage for a steady to higher opening when Monday's night session begins trading. Stochastics and the RSI are neutral to bullish signaling that sideways to higher prices are possible near-term. If January extends the aforementioned rally, October's high crossing at $430.00 is the next upside target. Closes below Monday's low crossing at $403.30 would signal that a short-term top has been posted. First resistance is Thursday's high crossing at $426.50. Second resistance is October's high crossing at $430.00. First support is Monday's low crossing at $403.30. Second support is the November 15th low crossing at $399.00.
January soybean oil closed down 219-pts. At 65.19.
January soybean oil gapped down and closed sharply lower for the third day in a row on Friday. The low-range close sets the stage for a steady to lower opening when Monday's night session begins trading. Stochastics and the RSI are neutral to bearish signaling that sideways to lower prices are possible near-term. If January extends the decline off November's high, the 62% retracement level of the July-November rally crossing at 62.60 is the next downside target. Closes above the 20-day moving average crossing at 72.05 would signal that a short-term low has been posted. First resistance is the 50-day moving average crossing at 68.51. Second resistance is the 20-day moving average crossing at 72.05. First support is today's low crossing at 64.50. Second support is the 662% retracement level of the July-November rally crossing at 62.60.
LIVESTOCKhttp://quotes.ino.com/exchanges/?c=livestock
February hogs closed up $1.23 at $90.43.
February hogs closed higher for the third-day in a row on Friday. The high-range close sets the stage for a steady to higher opening when Monday's session begins trading. Stochastics and the RSI are neutral to bullish signaling that sideways to higher prices are possible near-term. If February extends the rally off Wednesday's low, the November 17th high crossing at $91.35 is the next upside target. If February renews the decline off November's high, the 62% retracement level of the October rally crossing at $82.29 is the next downside target. First resistance is the November 17th high crossing at $91.35 Second resistance is the October 26th high crossing at $91.80. First support is the 50% retracement level of the October rally crossing at $84.12. Second support is the 62% retracement level of the October rally crossing at $82.29.
February cattle closed up $0.38 at $155.80.
February cattle closed higher on Friday. The high-range close sets the stage for a steady to higher opening on Monday. Stochastics and the RSI are neutral to bullish signaling that sideways to higher prices are possible near-term. If February renews the rally off September's low, monthly resistance crossing at $159.54 is the next upside target. Closes below the 50-day moving average crossing at $153.90 would confirm that a short-term top has been posted. First resistance is October's high crossing at $154.25. Second resistance is monthly resistance crossing at $159.54. First support is the 50-day moving average crossing at $153.90. Second support is the October 14th low crossing at $146.72.
January Feeder cattle closed up $1.35 at $182.43.
January Feeder cattle closed higher on Friday and the high-range close sets the stage for a steady to higher opening when Monday's session begins trading. Stochastics and the RSI are neutral to bullish signaling that sideways to higher prices are possible near-term. If January extends this week's rally, the 62% retracement level of the August-October decline crossing at $184.60 is the next upside target. Closes below the 50-day moving average crossing at $178.83 would signal that a short-term top has been posted. First resistance is November's high crossing at $181.50. Second resistance is the 62% retracement level of the August-October decline crossing at $184.56. First support is the November 15th low crossing at $176.33. Second support is October's low crossing at $172.10.
FOOD & FIBERhttp://quotes.ino.com/ex changes/?c=food
March coffee closed lower on Friday following yesterday's key reversal down signaling that a short-term top was posted with Thursday's high. The low-range close sets the stage for a steady to lower opening on Monday. Stochastics and the RSI are turning neutral to bearish signaling sideways to lower prices are possible near-term. If March renews the decline off August's high, the 75% retracement level of the 2020-2022 rally crossing at $14.74 is the next downside target. If March extends the rally off November's low, November's high crossing at $17.82 is the next upside target. First resistance is November's high crossing at $17.82. Second resistance is the 50-day moving average crossing at $18.30. First support is the 75% retracement level of the 2020-2022 rally crossing at $14.74. Second support is the 87% retracement level of the 2020-2022 rally crossing at $13.04.
March cocoa closed higher on Friday as it extends the rally off the November 23rd low. The high-range close sets the stage for a steady to higher opening on Monday. Stochastics and the RSI are neutral to bullish signaling sideways to higher prices are possible near-term. If March extends this week's rally, November's high crossing at 25.77 is the next upside target. If March renews this month's decline, the 50-day moving average crossing at 23.92 is the next downside target.
March sugar closed slightly lower on Friday. The mid-range close sets the stage for a steady to slightly lower opening on Monday. Stochastics and the RSI remain neutral to bearish signaling that sideways to lower prices are possible near-term. Closes below Monday's low crossing at 19.05 would renew the decline off November's high while opening the door for additional weakness near-term. If March renews the rally off September's low, April's high crossing at 20.63 is the next upside target.
March cotton closed lower on Friday as it consolidates some of the rally off Monday's low. The low-range close sets the stage for a steady to lower opening on Monday. Stochastics and the RSI have turned neutral to bullish signaling that sideways to higher prices are possible near-term. If March renews the rally off October's low, the reaction high crossing at 97.77 is the next upside target. If March extends the decline off November's high, October's low crossing at 70.10 is the next downside target.
Thanks tallpine!
Beans had a bounce today after the crash lower yesterday but only recovered a fraction of the losses.
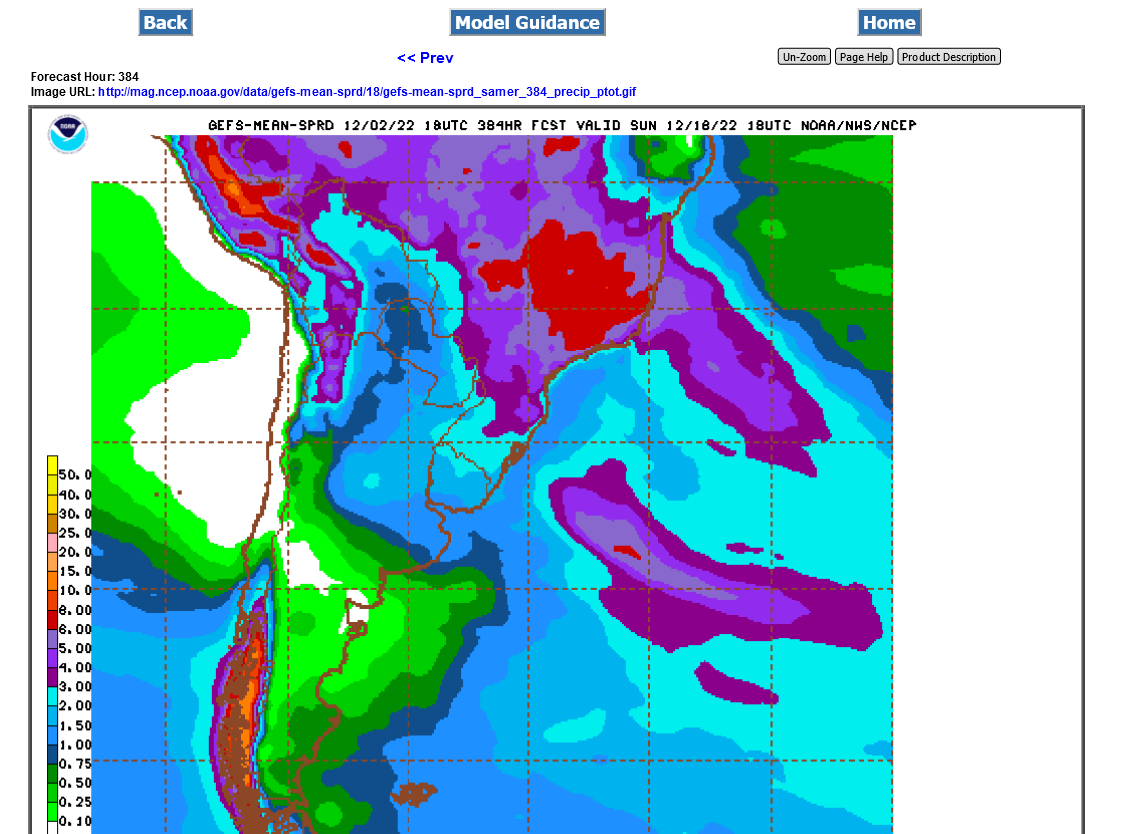
Models were drier overnight/early morning but the last one, 18z GEFS was a bit wetter again for drought stricken N.Argentina.
Beans
https://www.marketforum.com/forum/topic/90664/
Natural gas was crushed from models moderating the upcoming cold a great deal, which continued with this last 18z GEFS being -10 HDDs.
That's a drop of almost -50 HDDs from the peak around 4 runs and 2 days ago.