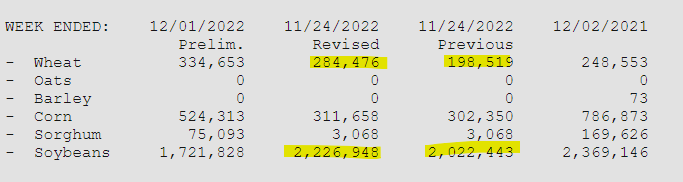
There were some notable upgrades to the previous week's numbers for wheat and soybeans:
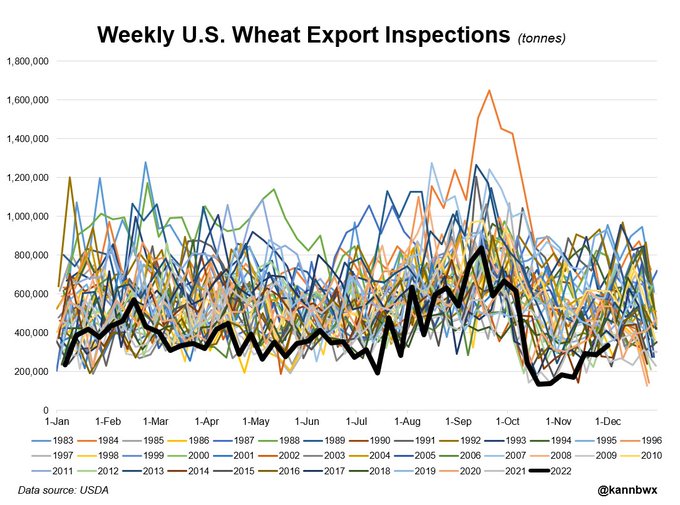
U.S. #wheat inspections remain historically low but have recently climbed above the near-record low levels in late October. Those two weeks were the 3rd and 4th lightest ever. (This is the "#AgTwitter made me do it" chart)
++++++++++
That orange spike is Sept. 1984, when U.S. #wheat exports hit their all-time monthly record of 6.6 million tonnes. 30% was to USSR, 9% to Japan, 8% to China. To put that in context, monthly U.S. wheat exports have exceeded 4 mmt only twice in the last 15 years.
++++++++++++
These are the U.S. #wheat class breakdowns for calendar year 2022 inspections to date (through Dec. 1): Hard red winter 35% Hard red spring 26% Soft white winter 21% Soft red winter 16%
Demand is weak across the board.
From Friday:
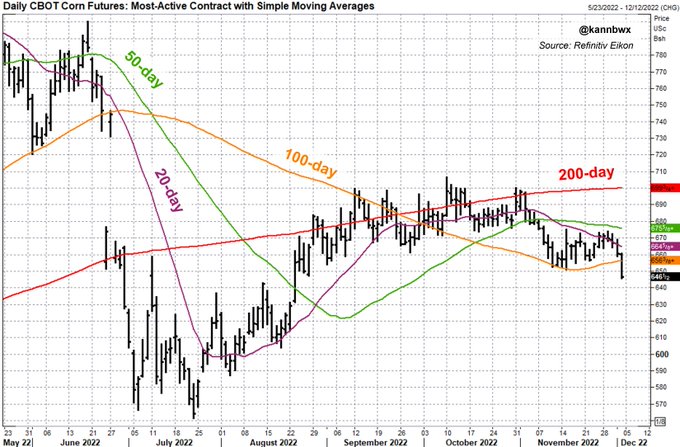
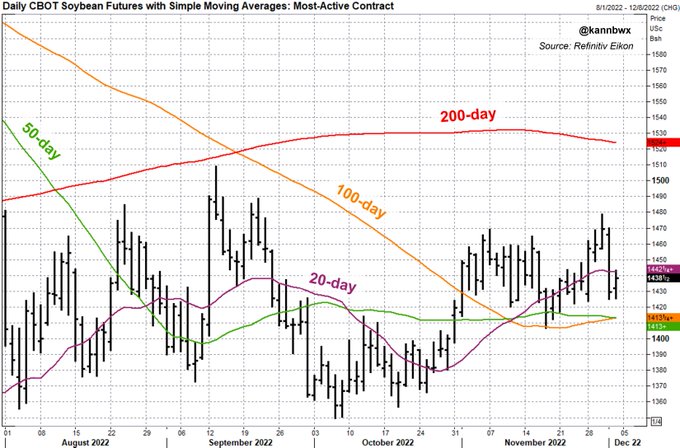
CBOT #wheat hit its lowest levels since Aug. 19, settling at $7.61/bu Friday. The contract dropped 2.8%, the largest one-day fall in exactly a month. Wheat is now trading well below all relevant averages.
+++++++++++++++++++++
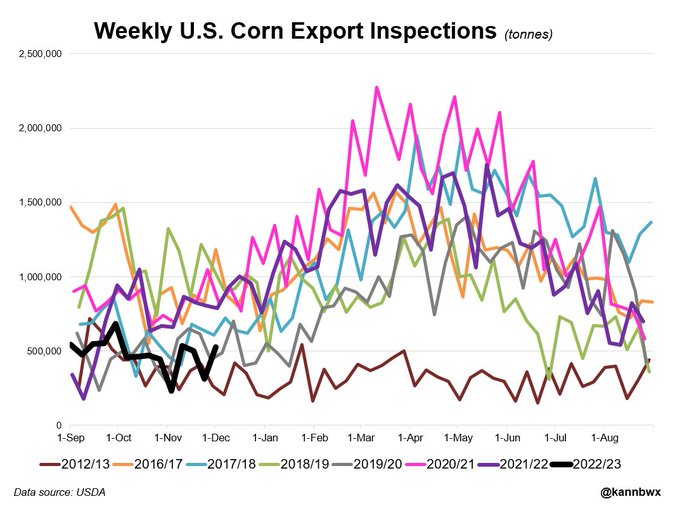
Dec. 2: Tough day for CBOT #corn futures with the most-active contract falling 2.2%, the biggest single-day decline since Aug. 16, closing at $6.46-1/4 per bushel. Dec23 notched its first sub-$6 settle ($5.98) since Aug. Wheat was also weak, pressured by Black Sea competition.
+++++++++++
Turned out to be a decent day for CBOT #soybeans considering the weakness in grains and oil. Contract ended up fractionally Friday at $14.38-1/2 per bu after falling 2.7% Thursday - the largest one-day decline since Sept. 30. Nov23 closed at $13.77-3/4.
·
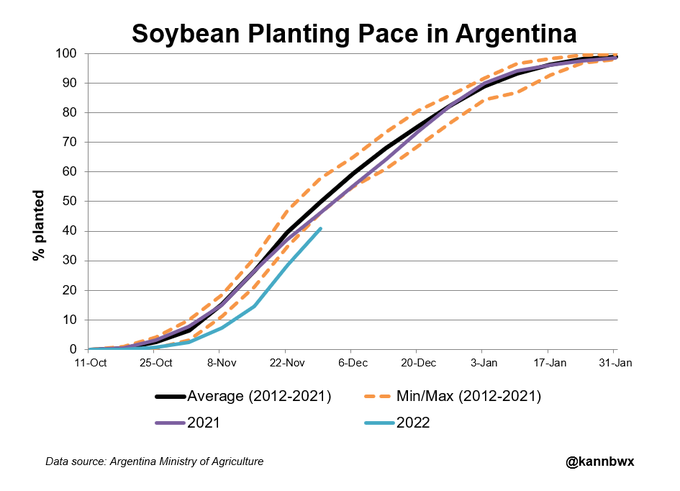
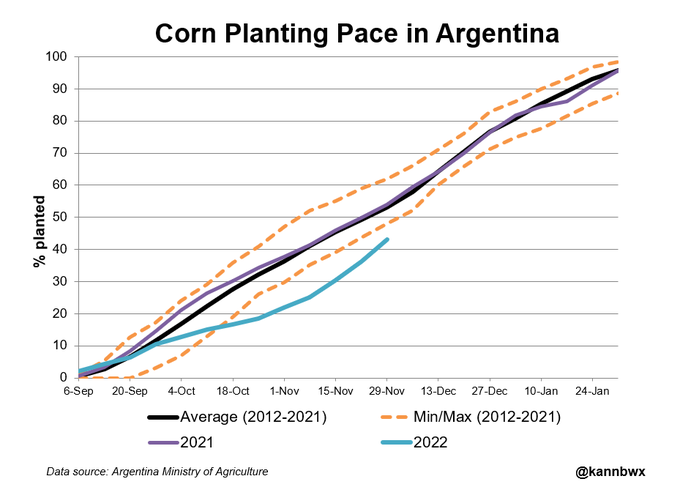
Planting paces of #soybeans & #corn in #Argentina is still slower than normal, but they are at least advancing and not falling further behind. As of Thursday the ag ministry reports 44% of soy and 45% of corn planted for harvest in early 2023.
++++++++++++
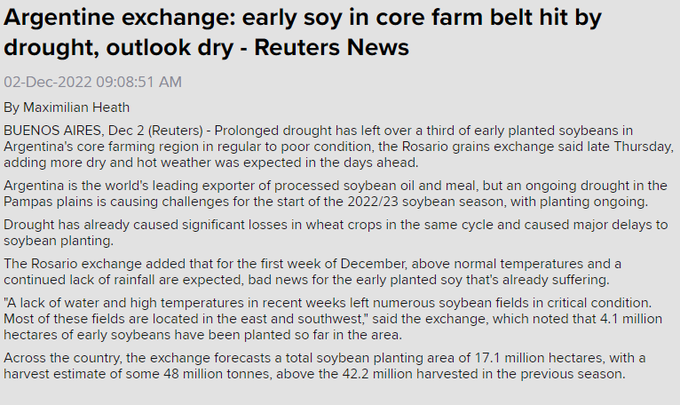
A third of early planted #soybeans in #Argentina are already in regular/poor condition due to dry weather. There are no substantial rain chances in the current forecast for at least 2 weeks, and next week looks to be pretty hot.
Today is a "mapiversary" - 7 years in the making! I've been tracking traffic outside #Brazil's 2nd busiest port Paranagua since 2015. These images are literally worth 1,000 words, but I'll keep it shorter. 1.9 mmt of grain/oilseed await shipment in rest of Dec, 2nd to 2015 (cont)
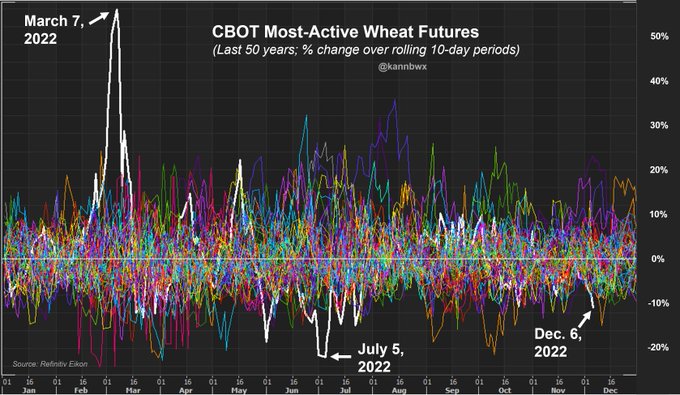
If this chart doesn't emphasize how unprecedented 2022 has been for CBOT #wheat, then such a chart doesn't exist. Showing % changes over 10-day periods. All you need to see is how often the white line (2022) pokes out from the rest. Wheat has lost an unusual 11% in last 10 days.
++++++++++++++++++
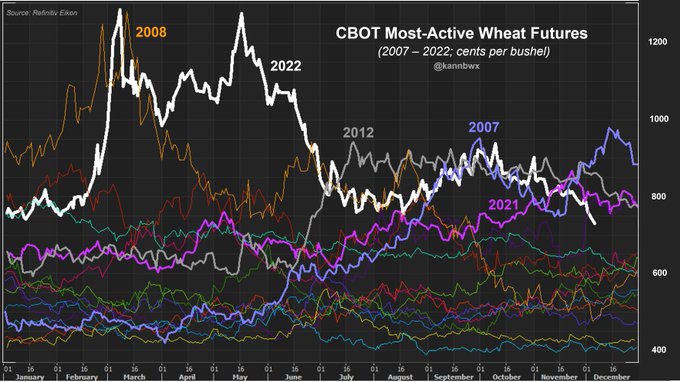
I've posted this chart throughout the year, helpful for the 2022-2008 comparison, esp. back in March. #Wheat traded at nearly the same level back then (but 2022 slightly higher), though the run up was MUCH faster in 22 than 08. Cause was the Russia-Ukraine invasion.
For anyone out there new to U.S. grain markets, this page from USDA is a good summary of the difference between the daily and weekly sales reporting, and what the volume requirements are for daily sales: