KEY EVENTS TO WATCH FOR:
Tuesday, December 6, 2022
8:30 AM ET. October U.S. International Trade in Goods & Services
Trade Balance (USD) (previous -73.28B)
Exports (USD) (previous 258.00B)
Exports, M/M% (previous -1.1%)
Imports (USD) (previous 331.29B)
Imports, M/M% (previous +1.5%)
8:55 AM ET. Johnson Redbook Retail Sales Index
Ret Sales Mo-to-Date, M/M%
Ret Sales Mo-to-Date, Y/Y% (previous +8.1%)
Latest Wk, Y/Y% (previous +10.4%)
4:30 PM ET. API Weekly Statistical Bulletin
Crude Stocks, Net Chg (Bbls) (previous -7.9M)
Gasoline Stocks, Net Chg (Bbls) (previous +2.9M)
Distillate Stocks, Net Chg (Bbls) (previous +4.0M)
Wednesday, December 7, 2022
7:00 AM ET. MBA Weekly Mortgage Applications Survey
Composite Idx (previous 208.1)
Composite Idx, W/W% (previous -0.8%)
Purchase Idx-SA (previous 181)
Purchase Idx-SA, W/W% (previous +3.8%)
Refinance Idx (previous 325.5)
Refinance Idx, W/W% (previous -12.9%)
8:30 AM ET. 3rd Quarter Revised Productivity & Costs
Non-Farm Productivity (previous -4.1%)
Unit Labor Costs (previous +10.2%)
10:00 AM ET. 3rd Quarter Quarterly Financial Report - Retail Trade
10:00 AM ET. 3rd Quarter Quarterly Financial Report - Industry
10:00 AM ET. November Online Help Wanted Index
10:30 AM ET. EIA Weekly Petroleum Status Report
Crude Oil Stocks (Bbl) (previous 419.084M)
Crude Oil Stocks, Net Chg (Bbl) (previous -12.581M)
Gasoline Stocks (Bbl) (previous 213.768M)
Gasoline Stocks, Net Chg (Bbl) (previous +2.77M)
Distillate Stocks (Bbl) (previous 112.648M)
Distillate Stocks, Net Chg (Bbl) (previous +3.547M)
Refinery Usage (previous 95.2%)
Total Prod Supplied (Bbl/day) (previous 19.717M)
Total Prod Supplied, Net Chg (Bbl/day) (previous -0.161M)
3:00 PM ET. October Consumer Credit
Consumer Credit Net Chg (USD) (previous +25.0B)
Thursday, December 8, 2022
8:30 AM ET. Unemployment Insurance Weekly Claims Report - Initial Claims
Jobless Claims (previous 225K)
Jobless Claims, Net Chg (previous -16K)
Continuing Claims (previous 1608000)
Continuing Claims, Net Chg (previous +57K)
8:30 AM ET. U.S. Weekly Export Sales
10:00 AM ET. 3rd Quarter Quarterly Services
10:00 AM ET. SEC Investor Advisory Committee Quarterly Meeting
10:30 AM ET. EIA Weekly Natural Gas Storage Report
Working Gas In Storage (Cbf) (previous 3483B)
Working Gas In Storage, Net Chg (Cbf) (previous -81B)
4:30 PM ET. Federal Discount Window Borrowings
4:30 PM ET. Foreign Central Bank Holdings
Friday, December 9, 2022
8:30 AM ET. November PPI
PPI, M/M% (previous +0.2%)
Ex-Food & Energy PPI, M/M% (previous +0%)
Personal Consumption (previous +0.4%)
10:00 AM ET. October Monthly Wholesale Trade
Inventories, M/M% (previous +0.6%)
10:00 AM ET. December University of Michigan Survey of Consumers - preliminary
Mid-Mo Sentiment (previous 54.7)
Mid-Mo Expectations (previous 52.7)
Mid-Mo Current Idx (previous 57.8)
12:00 PM ET. World Agricultural Supply & Demand Estimates (WASDE)
Corn, End Stocks (Bushels)
Soybeans, End Stocks (Bushels)
Wheat, End Stocks (Bushels)
Cotton, End Stocks (Bales)
The STOCK INDEXES? http://quotes.ino.com/ex?changes/?c=indexes
The STOCK INDEXES: The March NASDAQ 100 was steady to slightly higher overnight and sets the stage for a steady to higher opening when the day session begins trading. Stochastics and the RSI have turned neutral to bearish signaling that sideways to lower prices are possible near-term. Closes below the 20-day moving average crossing at 11,819.08 would signal that a short-term top has been posted. If March extends the rally off October's low, the 62% retracement level of the August-October crossing at 12,618.87 is the next upside target. First resistance is the 50% retracement level of the August-October crossing at 12,229.32. Second resistance is the 62% retracement level of the August-October crossing at 12,618.87. First support is the 20-day moving average crossing at 11,819.08. Second support is the 50-day moving average crossing at 11,526.33.
The March S&P 500 was steady to slightly lower overnight as it consolidates some of the rally off October's low. Overnight trading sets the stage for a steady to lower opening when the day session begins trading. Stochastics and the RSI have turned neutral to bearish signaling that sideways to lower prices are possible near-term. Closes below the 20-day moving average crossing at 4014.36 would signal that a short-term top has been posted. If March extends the rally off the October 13th low, the 75% retracement level of the August-October decline crossing at 4153.96 is the next upside target. First resistance is the 75% retracement level of the August-October declinecrossing at 4153.96. Second resistance is the September 13th high crossing at 4194.25. First support is the 20-day moving average crossing at 4014.36. Second support is the 50-day moving average crossing at 3865.57.
INTEREST RATES http://quotes.ino.com/ex changes/?c=interest"
INTEREST RATES: March T-bonds were higher overnight and sets the stage for a higher opening when the day session begins trading. Stochastics and the RSI are overbought but remain neutral to bullish signaling that sideways to higher prices are possible near-term. If March extends the rally off October's low, the 50% retracement level of the August-October decline crossing at 130-25 is the next upside target. Closes below the 20-day moving average crossing at 125-26 would signal that a short-term top has been posted. First resistance is last-Friday's high crossing at 130-09. Second resistance is the 50% retracement level of the August-October decline crossing at 130-25. First support is last-Wednesday's low crossing at 126-00. Second support is the 20-day moving average crossing at 125-26.
March T-notes were higher overnight as they consolidates some of Monday's decline. Overnight trading sets the stage for a higher opening when the day session begins trading. Stochastics and the RSI have turned neutral to bearish signaling that sideways to lower prices are possible near-term. Closes below the 20-day moving average crossing at 112.314 would signal that a short-term top has been posted. If March extends the rally off October's low, the 50% retracement level of the August-October decline crossing at 115.090 is the next upside target. First resistance is last-Friday's high crossing at 114.285. Second resistance is the 50% retracement level of the August-October decline crossing at 115.090. First support is the 20-day moving average crossing at 112.314. Second support is the 50-day moving average crossing at 112.007.
ENERGY MARKETS? http://quotes.ino.com/ex?changes/?c=energy ""
ENERGIES:Januarycrude oil was lower overnight as it extends the decline off last-Thursday's high. Overnight trading sets the stage for a lower opening when the day session begins trading. Stochastics and the RSI are neutral to bearish signaling that sideways to lower prices are possible near-term. If January renews the decline November's high, the 50% retracement level of the 2020-2022 rally crossing at $72.40 is the next downside target. Closes above the 50-day moving average crossing at $83.54 would signal that a short-term low has been posted. First resistance is the 50-day moving average crossing at $83.54. Second resistance is the November 11th high crossing at $89.20. First support is last-Monday's low crossing at $73.60. Second support is the 50% retracement level of the 2020-2022 rally crossing at $72.40.
January heating oil was lower overnight as it extends the decline off last-Thursday's high. Overnight trading sets the stage for a lower opening when the day session begins trading. Stochastics and the RSI are oversold but remain neutral to bearish signaling that sideways to lower prices are possible near-term. If January extends the decline off November's high, September's low crossing at $2.9301 is the next downside target. Closes above the 20-day moving average crossing at $3.3269 would signal that a short-term low has been posted. First resistance is the 10-day moving average crossing at $3.1974. Second resistance is the 20-day moving average crossing at $3.3269. First support is the overnight low crossing at $2.9476. Second support is September's low crossing at $2.9301.
January unleaded gas was lower overnight as it extends the decline off November's high. Overnight trading sets the stage for a lower opening when the day session begins trading. Stochastics and the RSI are oversold but remain neutral to bearish signaling that sideways to lower prices are possible near-term. If January extends the decline off November's high, September's low crossing at $2.1536 is the next downside target. Closes above the 50-day moving average crossing at $2.4191 would confirm that a short-term low has been posted. First resistance is the 50-day moving average crossing at $2.4191. Second resistance is the November 14th high crossing at $2.5951. First support is the overnight low crossing at $2.1756. Second support is September's low crossing at $2.1536.
January natural gas was lower overnight as it extends the decline off November's high. Overnight weakness sets the stage for a lower opening when the day session begins trading. Stochastics and the RSI are oversold but remain neutral to bearish signaling that sideways to lower prices are possible near-term. If January extends the decline off November's high, the 75% retracement level of the 2020-2022 rally crossing at 4.501 is the next downside target. Closes above the 10-day moving average crossing at 6.785 would signal that a short-term low has been posted. First resistance is the 50-day moving average crossing at 6.720. Second resistance is the 10-day moving average crossing at 6.785. First support is the 62% retracement level of the 2020-2022 rally crossing at 5.500. Second support is the 75% retracement level of the 2020-2022 rally crossing at 4.501.
CURRENCIEShttp://quotes.ino.com/ex changes/?c=currencies"
CURRENCIES:The March Dollar was lower overnight and sets the stage for a lower opening when the day session begins trading. Stochastics and the RSI are turning neutral to bullish signaling that sideways to higher prices are possible near-term. Closes above last-Wednesday's high crossing at $106.775 would confirm that a short-term low has been posted. If March extends the decline off September's high, the June 27th low crossing at $102.883 is the next downside target. First resistance is last-Wednesday's high crossing at $106.775. Second resistance is the November 21st high crossing at $107.500. First support is the 62% retracement level of this year's rally crossing at $103.643. Second support is the June 27th low crossing at $102.883.
The March Euro was steady to higher overnight and sets the stage for a higher opening when the day session begins trading. Stochastics and the RSI are overbought, diverging but remain neutral to bullish signaling that sideways to higher prices are possible near-term. If March extends the rally off September's low, the 25% retracement level of the 2021-2022 decline crossing at $1.08062 is the next upside target. Closes below the 20-day moving average crossing at $1.04346 would signal that a short-term top has been posted. First resistance is Monday's high crossing at $1.06745. Second resistance is the 25% retracement level of the 2021-2022 crossing at $1.08062. First support is the 20-day moving average crossing at $1.04346. Second support is the November 21st low crossing at $1.03165.
The March British Pound was steady to slightly higher overnight. Overnight trading sets the stage for a steady to slightly higher opening when the day session begins trading. Stochastics and the RSI are overbought but remain neutral to bullish signaling that sideways to higher prices are possible near-term. If March extends the rally off September's low, the June 16th high crossing at 1.2424 is the next upside target. Closes below the 20-day moving average crossing at 1.1964 would signal that a short-term top has been posted. First resistance is the 50% retracement level of the 2021-2022 decline crossing at 1.2318. Second resistance is the June 16th high crossing at 1.2424. First support is the 20-day moving average crossing at 1.1964. Second support is the 50-day moving average crossing at 1.1569.
The March Swiss Franc was slightly higher overnight and sets the stage for a slightly higher opening when the day session begins trading. Stochastics and the RSI have turned neutral to bearish signaling that sideways to lower prices are possible near-term. Closes below the 20-day moving average crossing at 1.06599 would signal that a short-term top has been posted. If March extends the rally off the November 21st low, August's high crossing at 1.08700 is the next upside target. First resistance is August's high crossing at 1.08700. Second resistance is the March 30th high crossing at 1.10880. First support is the 20-day moving average crossing at 1.06599. Second support is the November 21st low crossing at 1.05670.
The March Canadian Dollar was lower overnight and sets the stage for a lower opening when the day session begins trading. Stochastics and the RSI have turned neutral to bearish signaling that sideways to lower prices are possible near-term. Closes below last-Tuesday's low crossing at $73.42 would open the door for a possible test of November's low crossing at $72.44. Closes above the November 25th high crossing at $75.16 would signal that a short-term low has been posted. First resistance is the November 25th high crossing at $75.16. Second resistance is November's high crossing at $75.71. First support is last-Tuesday's low crossing at $73.42. Second support is November's low crossing at $72.58.
The March Japanese Yen was slightly higher overnight as it consolidates some of Monday's decline. Overnight trading sets the stage for a steady to higher opening when the day session begins trading. Stochastics and the RSI have turned neutral to bearish signaling that sideways to lower prices are possible near-term.Closes below the 20-day moving average crossing at 0.072761 would signal that a short-term top has been posted. If March extends the rally off October's, the 87% retracement level of the August-October decline crossing at 0.076735 is the next upside target. First resistance is last-Friday's high crossing at 0.075820. Second resistance is the 87% retracement level of the August-October decline crossing at 0.076735. First support is the 20-day moving average crossing at 0.072761. Second support is the 50-day moving average crossing at 0.070783.
PRECIOUS METALS http://quotes.ino.com/ex changes/?c=metals"
PRECIOUS METALS: Februarygold was higher overnight as it consolidates some of Monday's decline. Overnight trading sets the stage for a steady to higher opening when the day session begins trading. Stochastics and the RSI are turning neutral to bearish signaling that sideways to lower prices are possible near-term. Closes below the 20-day moving average crossing at $1772.10 would confirm that a short-term top has been posted. If February extends the rally off November's low, August's high crossing at $1836.70 is the next upside target. First resistance is Monday's high crossing at $1822.90. Second resistance is August's high crossing at $1836.70. First support is the 20-day moving average crossing at $1772.10. Second support is the November 23rd low crossing at $1733.50.
March silver was higher overnight as it consolidates some of Monday's sharp decline. Overnight trading sets the stage for a higher opening when the day session begins trading later this morning. However, stochastics and the RSI are turning neutral to bearish signaling that sideways to lower prices are possible near-term. Closes below the 20-day moving average crossing at $21.791 would confirm that a short-term top has been posted. If March extends the rally off October's low, the 75% retracement level of the March-August decline crossing at $24.779 is the next upside target. First resistance is the 62% retracement level of the March-August decline crossing at $23.503. Second resistance is the 75% retracement level of the March-August decline crossing at $24.779. First support the 20-day moving average crossing at $21.791. Second support is the November 21st low crossing at $20.790.
March copper was steady to slightly higher overnight. The high-range overnight trade sets the stage for a steady to higher opening when the day session begins trading. Stochastics and the RSI are neutral to bullish signaling that sideways to higher prices are possible near-term. If March extends the rally off the November 28th low, November's high crossing at 3.9470 is the next upside target. If March renews the decline off November's high, the 50-day moving average crossing at 3.5453 is the next downside target. First resistance is Monday's high crossing at 3.8945. Second resistance is November's high crossing at 3.9470. First support is the 10-day moving average crossing at 3.7136. Second support is the 50-day moving average crossing at 3.5453.
GRAINS http://quotes.ino.com/ex changes/?c=grains
March corn was higher overnight as it consolidates some of the decline off October's high. Overnight trading sets the stage for a higher opening when the day sessions begins trading. Stochastics and the RSI are oversold but remain neutral to bearish signaling that sideways to lower prices are possible near-term. If March extends the decline off the October 31st high, the 62% retracement level of the July-October rally crossing at $6.23 is the next downside target. Closes above last-Tuesday's high crossing at $6.74 would confirm that a short-term low has been posted. First resistance is last-Tuesday's high crossing at $6.74. Second resistance is the 50-day moving average crossing at $6.79. First support is the 50% retracement level of the July-October rally crossing at $6.40. Second support is the 62% retracement level of the July-October rally crossing at $6.23.
March wheat was steady to slightly higher overnight as it consolidates some of the decline off October's high. Overnight trading sets the stage for a steady to higher opening when the day session begins trading. Stochastics and the RSI are oversold but remain neutral to bearish signaling that sideways to lower prices are possible near-term. If March extends the decline off October's high, the 75% retracement level of the 2020-2022 rally crossing at $7.24 1/4 is the next downside target. Closes above the 20-day moving average crossing at $8.06 1/4 would signal that a short-term low has been posted. First resistance is the 20-day moving average crossing at $8.06 1/4. Second resistance is the 50-day moving average crossing at $8.55. First support is Monday's low crossing at $7.34. Second support is the 75% retracement level of the 2020-2022 rally crossing at $7.24 1/4.
March Kansas City wheat was lower overnight as it extends the decline off October's high. Overnight trading sets the stage for a lower opening when the day session begins trading later this morning. Stochastics and the RSI are oversold but remain neutral to bearish signaling that sideways to lower prices are possible near-term. If March extends the decline off October's high, August's low crossing at $8.11 3/4 is the next downside target. Closes above the 20-day moving average crossing at $9.11would signal that a short-term low has been posted. First resistance is the 20-day moving average crossing at $9.11. Second resistance is the 50-day moving average crossing at $9.40 1/4. First support is the overnight low crossing at $8.38 1/2. Second support is August's low crossing at $8.11 3/4.
March Minneapolis wheat was steady to lower overnight as it extends the decline off November's high. Overnight trading sets the stage for a steady to lower opening when the day session begins trading. Stochastics and the RSI are oversold but remain neutral to bearish signaling that sideways to lower prices are possible near-term. If March extends the decline off November's high, September's low crossing at $8.93 is the next downside target. Closes above the 20-day moving average crossing at $9.47 1/2 would temper the near-term bearish outlook. First resistance is the 10-day moving average crossing at $9.33. Second resistance is the 20-day moving average crossing at $9.47 1/2. First support is September's low crossing at $8.93. Second support is August's low crossing at $8.75 3/4.
SOYBEAN COMPLEX? http://quotes.ino.com/ex?changes/?c=grains "
January soybeans were higher overnight as they consolidates some of the decline off last-Wednesday's high. Overnight trading sets the stage for a higher opening when the day session begins trading. Stochastics and the RSI are turning neutral to bullish signaling that sideways to higher prices are possible near-term. If January renews the rally off October's low, the September 21st high crossing at $14.93 1/2 is the next upside target. Closes below the 50-day moving average crossing at $14.18 1/2 would signal that a short-term top has been posted. First resistance is the 62% retracement level of the September-October decline crossing at $14.55 1/4. Second resistance is the September 21st high crossing at $14.93 1/2. First support is the November 17th low crossing at $14.06 3/4. Second support is the October 26th low crossing at $13.80 1/2.
January soybean meal was higher overnight as it extends the rally off November's low. Overnight trading sets the stage for a higher opening when the day session begins trading. Stochastics and the RSI are overbought but remain neutral to bullish signaling that sideways to higher prices are possible near-term. If January extends the rally off November's low, September's high crossing at $437.50 is the next upside target. Closes below the 20-day moving average crossing at $411.50 would signal that a short-term top has been posted. First resistance is the overnight high crossing at $437.00. Second resistance is September's high crossing at $437.50. First support is the 10-day moving average crossing at $417.10. Second support is the 20-day moving average crossing at $411.50.
January soybean oil was higher overnight as it consolidates some of the decline off November's high. Overnight trading sets the stage for a steady to higher opening when the day session begins trading. Stochastics and the RSI are oversold but remain neutral to bearish signaling that sideways to lower prices are possible near-term. If January extends the decline off November's high, the 75% retracement level of the July-November rally crossing at 59.72 is the next downside target. Closes above the 50-day moving average crossing at 68.53 would signal that a short-term low has been posted. First resistance is last-Friday's gap crossing at 67.38. Second resistance is the 50-day moving average crossing at 68.53. First support is the 62% retracement level of the July-November rally crossing at 62.60. Second support is the 75% retracement level of the July-November rally crossing at 59.72.
LIVESTOCKhttp://quotes.ino.com/exchanges/?c=livestock
February hogs closed up $0.23 at $90.65.
February hogs closed higher for the fourth-day in a row on Monday. The mid-range close sets the stage for a steady to higher opening when Tuesday's session begins trading. Stochastics and the RSI are neutral to bullish signaling that sideways to higher prices are possible near-term. If February extends the rally off Wednesday's low, September's high crossing at $92.58 is the next upside target. If February renews the decline off November's high, the 62% retracement level of the October rally crossing at $82.29 is the next downside target. First resistance is the November 17th high crossing at $91.35 Second resistance is September's high crossing at $92.58. First support is the 50% retracement level of the October rally crossing at $84.12. Second support is the 62% retracement level of the October rally crossing at $82.29.
February cattle closed down $0.05 at $155.83.
February cattle closed lower on Monday. The mid-range close sets the stage for a steady to higher opening on Tuesday. Stochastics and the RSI are neutral to bullish signaling that sideways to higher prices are possible near-term. If February renews the rally off September's low, monthly resistance crossing at $159.54 is the next upside target. Closes below the 50-day moving average crossing at $153.96 would confirm that a short-term top has been posted. First resistance is October's high crossing at $154.25. Second resistance is monthly resistance crossing at $159.54. First support is the 50-day moving average crossing at $153.96. Second support is the October 14th low crossing at $146.72.
January Feeder cattle closed up $1.00 at $183.45.
January Feeder cattle closed higher on Monday and the high-range close sets the stage for a steady to higher opening when Tuesday's session begins trading. Stochastics and the RSI are neutral to bullish signaling that sideways to higher prices are possible near-term. If January extends last-week's rally, the 62% retracement level of the August-October decline crossing at $184.60 is the next upside target. Closes below the 50-day moving average crossing at $178.91 would signal that a short-term top has been posted. First resistance is today's high crossing at $184.20. Second resistance is the 62% retracement level of the August-October decline crossing at $184.56. First support is the November 15th low crossing at $176.33. Second support is October's low crossing at $172.10.
FOOD & FIBERhttp://quotes.ino.com/ex changes/?c=food
March coffee closed higher on Monday. The low-range close sets the stage for a steady to lower opening on Tuesday. Stochastics and the RSI are neutral to bearish signaling sideways to lower prices are possible near-term. If March renews the decline off August's high, the 75% retracement level of the 2020-2022 rally crossing at $14.74 is the next downside target. If March extends the rally off November's low, November's high crossing at $17.82 is the next upside target. First resistance is November's high crossing at $17.82. Second resistance is the 50-day moving average crossing at $18.20. First support is the 75% retracement level of the 2020-2022 rally crossing at $14.74. Second support is the 87% retracement level of the 2020-2022 rally crossing at $13.04.
March cocoa closed lower on Monday as it consolidated some of the rally off the November 23rd low. The low-range close sets the stage for a steady to lower opening on Tuesday. Stochastics and the RSI are neutral to bullish signaling sideways to higher prices are possible near-term. If March extends last-week's rally, November's high crossing at 25.77 is the next upside target. If March renews last- month's decline, the 50-day moving average crossing at 23.97 is the next downside target.
March sugar closed slightly higher on Monday. The low-range close sets the stage for a steady to slightly lower opening on Tuesday. Stochastics and the RSI remain neutral to bearish signaling that sideways to lower prices are possible near-term. Closes below last-Monday's low crossing at 19.05 would renew the decline off November's high while opening the door for additional weakness near-term. If March renews the rally off September's low, April's high crossing at 20.63 is the next upside target.
March cotton closed higher on Monday. The mid-range close sets the stage for a steady to higher opening on Tuesday. Stochastics and the RSI have turned neutral to bullish signaling that sideways to higher prices are possible near-term. If March renews the rally off October's low, the reaction high crossing at 97.77 is the next upside target. If March extends the decline off November's high, October's low crossing at 70.10 is the next downside target.
Thanks tallpine!
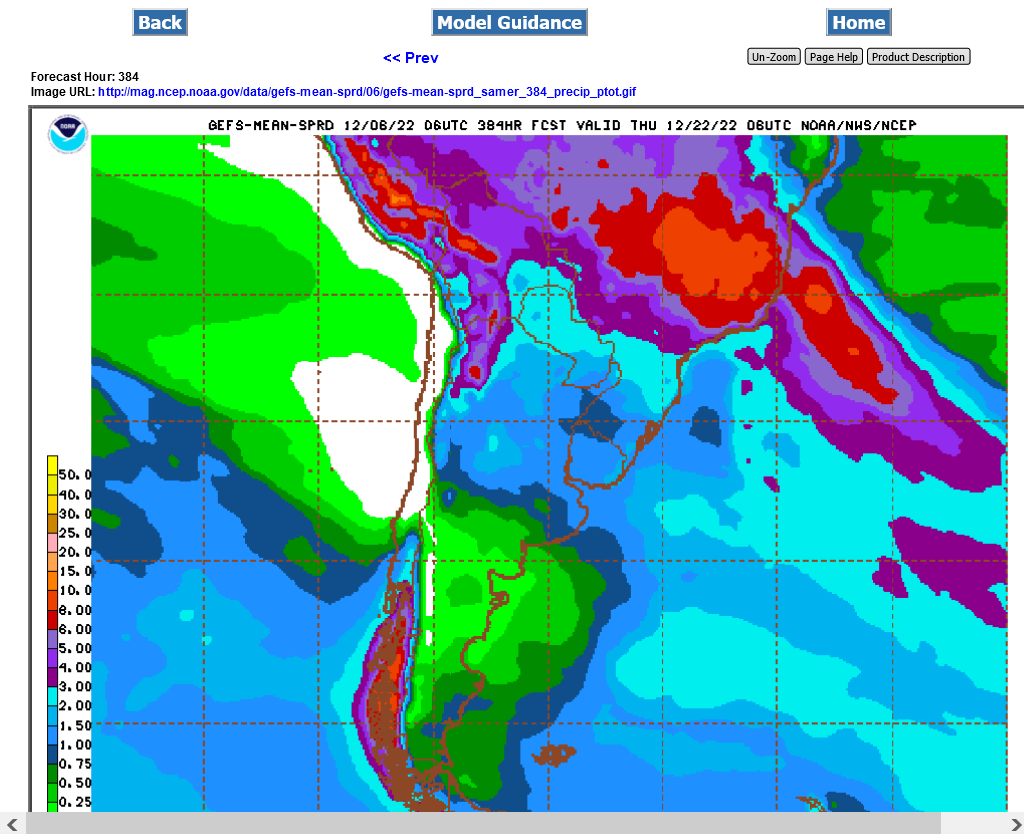
beans on fire from less rain in SA/Argentina forecast.
NG getting crushed from milder and milder forecasts!
Beans in N.Argentina need at least an inch of rain every week to get by, especially with no soil moisture reserves and porous soils....... not an inch in 2 weeks with near record heat this week.