KEY EVENTS TO WATCH FOR:
Tuesday, December 13, 2022
6:00 AM ET. November NFIB Index of Small Business Optimism
Small Business Idx (previous 91.3)
8:30 AM ET. November Real Earnings
8:30 AM ET. November CPI
CPI, M/M% (previous +0.4%)
Core CPI, M/M% (previous +0.3%)
Energy Idx, M/M% (previous +1.8%)
Food Idx, M/M% (previous +0.6%)
Real Avg Wkly Pay-Infla Adj, M/M% (previous -0.1%)
CPI, Y/Y% (previous +7.7%)
Core Annual, Y/Y% (previous +6.3%)
8:55 AM ET. Johnson Redbook Retail Sales Index
Ret Sales Mo-to-Date, M/M%
Ret Sales Mo-to-Date, Y/Y% (previous +5.7%)
Latest Wk, Y/Y% (previous +5.7%)
10:00 AM ET. December IBD/TIPP Economic Optimism Index
Economic Optimism Idx (previous 40.4)
6-Mo Economic Outlook (previous 34.3)
4:30 PM ET. API Weekly Statistical Bulletin
Crude Stocks, Net Chg (Bbls) (previous -6.4M)
Gasoline Stocks, Net Chg (Bbls) (previous +5.9M)
Distillate Stocks, Net Chg (Bbls) (previous +3.6M)
N/A U.S. Federal Open Market Committee meeting
Wednesday, December 14, 2022
7:00 AM ET. MBA Weekly Mortgage Applications Survey
Composite Idx (previous 204.2)
Composite Idx, W/W% (previous -1.9%)
Purchase Idx-SA (previous 175.5)
Purchase Idx-SA, W/W% (previous -3.0%)
Refinance Idx (previous 340.8)
Refinance Idx, W/W% (previous +4.7%)
8:30 AM ET. November Import & Export Price Indexes
Import Prices (previous -0.2%)
Non-Petroleum Prices (previous -0.2%)
Petroleum Prices (previous -1.2%)
10:30 AM ET. EIA Weekly Petroleum Status Report
Crude Oil Stocks (Bbl) (previous 413.898M)
Crude Oil Stocks, Net Chg (Bbl) (previous -5.186M)
Gasoline Stocks (Bbl) (previous 219.087M)
Gasoline Stocks, Net Chg (Bbl) (previous +5.319M)
Distillate Stocks (Bbl) (previous 118.807M)
Distillate Stocks, Net Chg (Bbl) (previous +6.159M)
Refinery Usage (previous 95.5%)
Total Prod Supplied (Bbl/day) (previous 19.626M)
Total Prod Supplied, Net Chg (Bbl/day) (previous -0.091M)
2:00 PM ET Federal Reserve economic projections
Median Fed Funds Rate - 2022 (previous 4.4%)
Median Fed Funds Rate - 2023 (previous 4.6%)
Median Fed Funds Rate - 2024 (previous 3.9%)
2:00 PM ET. U.S. interest rate decision
Federal Funds Rate
Federal Funds Rate Change (Pts)
Fed Funds Rate-Range High (previous 4.00)
Fed Funds Rate-Range Low (previous 3.75)
FOMC Vote For Action (previous 12)
FOMC Vote Against Action (previous 0)
Discount Rate (previous 4.00)
Discount Rate Change (Pts) (previous +0.75)
Discount Rate-Range High
Discount Rate-Range Low
Thursday, December 15, 2022
8:30 AM ET. December Empire State Manufacturing Survey
Mfg Idx (previous 4.5)
Employment Idx (previous 12.2)
New Orders Idx (previous -3.3)
Prices Received (previous 27.2)
8:30 AM ET. December Philadelphia Fed Business Outlook Survey
Business Activity (previous -19.4)
Prices Paid (previous 35.3)
Employment (previous 7.1)
New Orders (previous -16.2)
Prices Received (previous 34.6)
Delivery Times (previous -8.8)
Inventories (previous -6.5)
Shipments (previous 7.0)
8:30 AM ET. November Advance Monthly Sales for Retail & Food Services
Overall Sales-SA, M/M% (previous +1.3%)
Sales, Ex-Auto, M/M% (previous +1.3%)
Sales, Ex-Auto & Gas, M/M% (previous +0.9%)
8:30 AM ET. Unemployment Insurance Weekly Claims Report - Initial Claims
Jobless Claims (previous 230K)
Jobless Claims, Net Chg (previous +4K)
Continuing Claims (previous 1671000)
Continuing Claims, Net Chg (previous +62K)
8:30 AM ET. U.S. Weekly Export Sales
9:15 AM ET. November Industrial Production & Capacity Utilization
Industrial Production, M/M% (previous -0.1%)
Capacity Utilization % (previous 79.9%)
Capacity Utilization, Net Chg (Pts) (previous -0.2)
10:00 AM ET. October Manufacturing & Trade: Inventories & Sales
Total Inventories (previous +0.4%)
10:30 AM ET. EIA Weekly Natural Gas Storage Report
Working Gas In Storage (Cbf) (previous 3462B)
Working Gas In Storage, Net Chg (Cbf) (previous -21B)
4:00 PM ET. October Treasury International Capital Data
4:30 PM ET. Foreign Central Bank Holdings
4:30 PM ET. Federal Discount Window Borrowings
N/A ISM Semiannual Report On Business Economic Forecast
Friday, December 16, 2022
9:45 AM ET. December US Flash Manufacturing PMI
PMI, Mfg (previous 47.6)
9:45 PM ET. December US Flash Services PMI
PMI, Services (previous 46.1)
10:00 AM ET. November State Employment and Unemployment
N/A Latest deadline for new funding deal to avert U.S. Govt. shutdown
The STOCK INDEXES? http://quotes.ino.com/ex?changes/?c=indexes
The Dow closed sharply higher on Monday as it extended the trading range of the past four-days. The high-range close sets the stage for a steady to higher opening when Tuesday's night session begins trading. Stochastics and the RSI are becoming oversold but remain neutral to bearish signaling that sideways to lower prices are possible near-term. If the Dow extends the decline off November's high, the November 10th gap crossing at 33,065.11 is the next downside target. If the Dow renews the rally off October's low, the 75% retracement level of the January-October decline crossing at 34,893.55. First resistance is November's high crossing at 34,595.51. Second resistance is the 75% retracement level of the January-October decline crossing at 34,901.54. First support is the November 10th gap crossing at 33,065.11. Second support is the November 3rd low crossing at 31,727.05.
The March NASDAQ 100 closed higher on Monday as it extended the trading range of the past four-days. Today's high-range close sets the stage for a steady to higher opening when Tuesday's night session begins trading. Stochastics and the RSI are turning neutral to bullish signaling sideways to higher prices are possible. If March renews the rally off November's low, the 62% retracement level of the August-October decline crossing at 12,618.67 is the next upside target. Closes below the 50-day moving average crossing at 11,545.34 would confirm that a short-term top has been posted. First resistance is the 50% retracement level of the August-October decline crossing at 12,229.32. Second resistance is the 62% retracement level of the August-October decline crossing at 12,618.67. First support is the 50-day moving average crossing at 11,545.34. Second support is the November 9th low crossing at 10,932.75.
The March S&P 500 closed higher on Monday as it extends the trading range for the past four-days. The high-range close sets the stage for a steady to higher opening when Tuesday's night session begins trading. Stochastics and the RSI are oversold but remain neutral to bearish signaling that sideways to lower prices are possible near-term. If March extends the aforementioned decline, the 50-day moving average crossing at 3887.78 is the next downside target. If March renews the rally off October's low, the September 13th high crossing at 4194.25 is the next upside target. First resistance is December's high crossing at 4142.50. Second resistance is the September 13th high crossing at 4194.25. First support is the November 17th low crossing at 3945.50. Second support is the 50-day moving average crossing at 3887.78.
INTEREST RATES? http://quotes.ino.com/ex?changes/?c=interest ""
March T-bonds closed down 10-pts. at 129-19.
March T-bonds closed lower on Monday as it consolidated some of the rally off October's low. The low-range close sets the stage for a steady to lower opening when Tuesday's night session begins trading. Stochastics and the RSI are overbought and are turning neutral to bearish signaling that sideways to lower prices are possible near-term. Closes below the 20-day moving average crossing at 127-21 would signal that a short-term top has been posted. If March extends the rally off November's low, the 62% retracement level of the August-November decline crossing at 133-30 is the next upside target. First resistance is last-Thursday's high crossing at 131-31. Second resistance is the 62% retracement level of the August-October decline crossing at 133-30. First support is the 10-day moving average crossing at 129-15. Second support is the 20-day moving average crossing at 127-26.
March T-notes closed down 95-pts. at 113.255.
March T-notes closed lower on Monday as it consolidated the rally off October's low. The low-range close sets the stage for a steady to lower opening when Tuesday's night session begins trading. Stochastics and the RSI have turned neutral to bearish signaling that sideways to lower prices are possible near-term. Closes below the 20-day moving average crossing at 113,176 would signal that a short-term top has been posted. If March extends the rally off October's low, the 62% retracement level of the August-November decline crossing at 116.232 is the next upside target. First resistance is the 50% retracement of the August-October decline crossing at 115.090. Second resistance is the 62% retracement of the August-October decline crossing at 116.232. First support is the 20-day moving average crossing at 113.176. Second support is the 50-day moving average crossing at 112.062.
ENERGY MARKETS? http://quotes.ino.com/ex?changes/?c=energy ""
January crude oil closed higher on Monday as it consolidated some of the decline off November's high. The high-range close sets the stage for a steady to higher opening when Tuesday's night session begins. Stochastics and the RSI are oversold but remain neutral to bearish signaling that sideways to lower prices are possible near-term. If January extends the decline off November's high, the 62% retracement level of the 2020-2022 rally crossing at $63.80 is the next downside target. Closes above the 20-day moving average crossing at $78.46 would signal that a short-term low has been posted. First resistance is the 20-day moving average crossing at $78.46. Second resistance is the 50-day moving average crossing at $82.97. First support is Monday's low crossing at $70.08. Second support is the 62% retracement level of the 2020-2022 rally crossing at $63.80.
January heating oil closed sharply higher on Monday as it consolidates some of the decline off November's high. The high-range close sets the stage for a steady to higher opening when Tuesday's night trading session begins. Stochastics and the RSI are oversold but remain neutral to bearish signaling that sideways to lower prices are possible near-term. If January extends the decline off November's high, the 50% retracement level of the 2020-2022 rally crossing at $2.6219 is the next downside target. Closes above the 10-day moving average crossing at $3.0373 would signal that a short-term low has been posted. First resistance is the 10-day moving average crossing at $3.0373. Second resistance is the 20-day moving average crossing at $3.1965. First support is last-Wednesday's low crossing at $2.7750. Second support is the 50% retracement level of the 2020-2022 rally crossing at $2.6219.
January unleaded gas closed higher on Monday as it consolidated some of the decline off November's high. The high-range close sets the stage for a steady to higher opening when Tuesday's night session begins trading. Stochastics and the RSI are oversold but remain neutral to bearish signaling that sideways to lower prices are possible near-term. If January extends the decline off November's high, the 50% retracement level of the 2020-2022 rally crossing at 1.9894 is the next downside target. Closes above the 20-day moving average crossing at $2.2902 would signal that a short-term low has been posted. First resistance is the 10-day moving average crossing at $2.1905. Second resistance is the 20-day moving average crossing at $2.2903. First support is today's low crossing at $2.0204. Second support is the 50% retracement level of the 2020-2022 rally crossing at 1.9894.
January Henry natural gas gapped up and closed higher for the fourth-day in a row on Monday as it consolidates some of the decline off November's high. The low-range close sets the stage for a steady to lower opening when Tuesday's night session begins trading. Stochastics and the RSI are neutral to bullish signaling that sideways to higher prices are possible near-term. If January extends the rally off last-Tuesday's low, the August-November downtrend line crossing near 7.816 is the next upside target. Closes below today's gap crossing at 6.391 would signal that a short-term top has been posted. First resistance is today's high crossing at 7.058. Second resistance is the August-November downtrend line crossing near 7.816. First support is today's gap crossing at 6.391. Second support is last-Tuesday's low crossing at 5.337.
CURRENCIES? http://quotes.ino.com/ex?changes/?c=currencies ""
The March Dollar closed slightly higher on Monday. The high-range close sets the stage for a steady to higher opening when Tuesday's nights session begins trading. Stochastics and the RSI are turning neutral to bullish signaling that sideways to higher prices are possible near-term. Closes above the November 30thhigh crossing at 106.775 would signal that a short-term low has been posted. If March extends the decline off September's high, the 75% retracement level of the January-September rally crossing at $101.331 is the next downside target. First resistance is the November 30thhigh crossing at 106.775. Second resistance is the November 21st high crossing at $107.500. First support is the 62% retracement level of the January-September rally crossing at $103.643. Second support is 75% retracement level of the January-September rally crossing at $101.331.
The March Euro closed lower on Monday. The low-range close sets the stage for a steady to lower opening when Tuesday's night session begins trading. Stochastics and the RSI are diverging and are turning neutral to bearish signaling that sideways to lower prices are possible near-term. Closes below the 20-day moving average crossing at 1.05036 would signal that a short-term top has been posted. If March extends the rally off September's low, the 25% retracement level of the 2018-2022 decline crossing at $1.07982 is the next upside target. First resistance is last-Monday's high crossing at $1.06745. Second resistance is the 25% retracement level of the 2018-2022 decline crossing at $1.07982 is the next upside target. First support is the 20-day moving average crossing at $1.05035. Second support is the November 21st low crossing at $1.03165.
The March British Pound closed slightly lower on Monday. The mid-range close sets the stage for a steady to lower opening when Tuesday's night session begins trading. Stochastics and the RSI have turned neutral to bullish signaling sideways to higher prices are possible near-term. If March extends the rally off September's low, the 62% retracement level of the May-September decline crossing at 1.2770 is the next upside target. Closes below the 20-day moving average crossing at 1.2086 would confirm that a short-term top has been posted. First resistance is August's high crossing at 1.2324. Second resistance is the 50-week moving average crossing at 1.2438. First support is the 20-day moving average crossing at 1.2086. Second support is the 50-day moving average crossing at 1.1673.
The March Swiss Franc closed lower on Monday as it consolidated some of last-week's rally. The low-range close sets the stage for a steady to lower opening when Tuesday's night session begins trading. Stochastics and the RSI are becoming overbought but remain neutral to bullish signaling that sideways to higher prices are possible near-term. If March extends the rally off November's low, the 38% retracement level of the 2018-2022 decline crossing at 1.09661 is the next upside target. Closes below last-Tuesday's low crossing at 1.07000 would signal that a short-term top has been posted. First resistance is last-Friday's high crossing at 1.08510. Second resistance is the 38% retracement level of the 2018-2022 decline crossing at 1.09661. First support is last-Tuesday's low crossing at 1.0700. Second support is the November 21st low crossing at 1.05670.
The March Canadian Dollar closed slightly lower on Monday. The high-range close sets the stage for a steady to slightly lower opening when Tuesday's night session begins trading. Stochastics and the RSI are oversold but remain neutral to bearish signaling that sideways to lower prices are possible near-term. If March extends the decline off November's high, the November 3rd low crossing at 72.58 is the next downside target. Closes above last-Monday's high crossing at 74.82 would signal that a short-term low has been posted. First resistance is last-Monday's high crossing at 74.82. Second resistance is the November 25thhigh crossing at 75.16. First support is last-Wednesday's low crossing at 73.12. Second support is the November 3rd low crossing at 72.58.
The March Japanese Yen closed lower on Monday as it extends the decline off December's high. The low-range close sets the stage for a steady to lower opening when Tuesday’s night session begins trading. Stochastics and the RSI are neutral to bearish signaling that sideways to lower prices are possible near-term. Closes below the 20-day moving average crossing at 0.073340 would confirm that a short-term top has been posted while opening the door for additional weakness near-term. If March renews the rally off October's low, the 87% retracement level of the August-October decline crossing at 0.076735 is the next upside target. First resistance is the 75% retracement level of the August-October decline crossing at 0.075398. Second resistance is the 87% retracement level of the August-October decline crossing at 0.076735. First support is the 20-day moving average crossing at 0.073340. Second support is the November 21st low crossing at 0.071410.
PRECIOUS METALS? http://quotes.ino.com/ex?changes/?c=metals ""
February gold closed lower on Monday as it consolidated some of the rally off Tuesday's low. The low-range close sets the stage for a steady to lower opening when Tuesday's night session begins trading. Stochastics and the RSI are turning neutral to bearish signaling that sideways to lower prices are possible near-term. Closes below the 20-day moving average crossing at $1781.50 would signal that a short-term top has been posted. If February extends the rally off November's low, August's high crossing at $1836.70 is the next upside target. First resistance is last-Monday's high crossing at $1822.90. Second resistance is August's high $1836.70. First support is the 20-day moving average crossing at $1781.50. Second support is the November 23rd low crossing at $1733.50.
March silver posted an inside day with a lower close on Monday as it consolidated some of the rally off September's low. The mid-range close sets the stage for a steady to lower opening when Tuesday's night session begins trading. Stochastics and the RSI are overbought but remain neutral to bullish signaling that sideways to higher prices are possible near-term. If March extends the rally off October's low, the 75% retracement level of the March-August decline crossing at 24.779 is the next upside target. Closes below the 20-day moving average crossing at 22.103 would confirm that a short-term top has been posted while opening the door for additional weakness near-term.First resistance is last-Friday's high crossing at 23.900. Second resistance is the 75% retracement level of the March-September decline crossing at 24.779. First support is the 10-day moving average crossing at 22.745. Second resistance is the 20-day moving average crossing at 22.103.
March copper closed lower on Monday and the low-range close sets the stage for a steady to lower opening when Tuesday's night session begins trading. Stochastics and the RSI are overbought and are turning neutral to bearish signaling that sideways to lower prices are possible near-term. Closes below the 20-day moving average crossing at 3.7450 would signal that a short-term top has been posted. If March renews the rally off September's low, the 50% retracement level of the March-July decline crossing at 4.0343 is the next upside target. First resistance is November's high crossing at 3.9470. Second resistance is the 50% retracement level of the March-July decline crossing at 4.0343. First support is the 20-day moving average crossing at 3.7450. Second support is the 50-day moving average crossing at 3.5855.
GRAINS? http://quotes.ino.com/ex?changes/?c=grains "
March Corn closed up $0.10-cents at $6.54.
March corn closed higher on Monday as it extended the rally off last-Wednesday's low. The high-range close sets the stage for a steady to higher opening when Tuesday's night session begins trading. Stochastics and the RSI are turning neutral to bullish signaling that sideways to higher prices are possible near-term. Closes above the 20-day moving average crossing at $6.58 1/2 would signal that a short-term low has been posted. If March renews the decline off October's high, the 62% retracement level of the July-October rally crossing at $6.23 is the next downside target. First resistance is the 20-day moving average crossing at $6.58 1/2. Second resistance is the 50-day moving average crossing at $6.76 1/4. First support is last-Wednesday's low crossing at $6.35. Second support is the 62% retracement level of the July-October rally crossing at $6.23.
March wheat closed up $0.20 1/2-cents at $7.54 3/4.
March wheat closed higher on Monday as it extends the trading range of the past five-days. The high-range close sets the stage for a steady to higher opening when Tuesday's night session begins trading. Stochastics and the RSI are oversold and are turning neutral to bullish signaling that sideways to higher prices are possible near-term. Closes above the 20-day moving average crossing at $7.88 would signal that a short-term low has been posted. If March renews the decline off October's high, the September 9, 2021 low crossing at $6.94 is the next downside target. First resistance is the 20-day moving average crossing at $7.88. Second resistance is the 50-day moving average crossing at $8.41 3/4. First support is the 75% retracement level of the 2018-2022 rally crossing at $7.24 1/4. Second support is the September 9, 2021 low crossing at $6.94.
March Kansas City Wheat closed up $0.29 1/4-cents at $8.62 1/4.
March Kansas City wheat closed sharply higher on Monday as it extended the rally off last-Tuesday's low. The high-range close sets the stage for a steady to higher opening when Tuesday's night session begins trading. Stochastics and the RSI are oversold but are turning neutral to bullish signaling that sideways to higher prices are possible near-term. Closes above the 20-day moving average crossing at $8.93 1/4 would confirm that a short-term low has been posted. If March extends the decline off October's high, August's low crossing at $8.18 3/4 is the next downside target. First resistance is the 20-day moving average crossing at $8.93 1/4. Second resistance is the 50-day moving average crossing at $9.30 1/2. First support is last-Tuesday's low crossing at $8.21 3/4. Second support is August's low crossing at $8.18 3/4.
March Minneapolis wheat closed up $0.14 3/4-cents at $9.16 1/4.
March Minneapolis wheat closed higher on Monday. The high-range close sets the stage for a steady to higher opening when Tuesday's night session begins trading. Stochastics and the RSI are turning neutral to bullish signaling that sideways to higher prices are possible near-term. Closes above the 20-day moving average crossing at $9.38 would signal that a short-term low has been posted. If March extends the decline off November's high, August's low crossing at $8.75 3/4 is the next downside target. First resistance is the 10-day moving average crossing at $9.16 1/4. Second resistance is the 20-day moving average crossing at $9.38. First support is last-Tuesday's low crossing at $8.90. Second support is the August's low crossing at $8.75 3/4.
SOYBEAN COMPLEX? http://quotes.ino.com/ex?changes/?c=grains "
January soybeans closed down $0.23 1/4-cents at $14.60 1/2.
January soybeans closed higher on Monday as it consolidates some of the rally off October's low. The low-range close sets the stage for a steady to lower opening when Tuesday's night trade begins. Stochastics and the RSI are overbought and are turning neutral to bearish signaling that sideways to lower prices are possible near-term. Closes below the 20-day moving average crossing at $14.48 would signal that a short-term top has been posted. If January extends the rally off October's low, September's high crossing at $15.12 1/4 is the next upside target. First resistance is the September 21st high crossing at $14.93 1/2. Second resistance is September's high crossing at $15.12 1/4. First support is the 20-day moving average crossing at $14.48. Second support is the 50-day moving average crossing at $14.22 1/4.
January soybean meal closed down $21.40 at $450.20.
January soybean meal closed sharply lower on Monday as it consolidated some of the rally off November's low. The low-range close sets the stage for a steady to lower opening when Tuesday's night session begins trading. Stochastics and the RSI are overbought but remain neutral to bullish signaling that sideways to higher prices are possible near-term. If January extends the aforementioned rally, monthly support on the continuation chart crossing at $478.60 is the next upside target. Closes below the 10-day moving average crossing at $440.00 would signal that a short-term top has been posted. First resistance is last-Friday's high crossing at $474.40. Second resistance is monthly resistance crossing at $478.60. First support is the 10-day moving average crossing at $440.00. Second support is the 20-day moving average crossing at $423.00.
January soybean oil closed up 219-pts. At 62.20.
January soybean oil posted a key reversal up as it closed sharply higher on Tuesday consolidating some of the decline off November's high. The high-range close sets the stage for a steady to higher opening when Tuesday's night session begins trading. Stochastics and the RSI are oversold but remain neutral to bearish signaling that sideways to lower prices are possible near-term. If January extends the decline off November's high, the 87% retracement level of the July-November rally crossing at 57.11 is the next downside target. Closes above the 10-day moving average crossing at 64.62 would signal that a short-term low has been posted. First resistance is the 10-day moving average crossing at 64.62. Second resistance is the 50-day moving average crossing at 68.45. First support is the 75% retracement level of the July-November rally crossing at 59.72. Second support is the 87% retracement level of the July-November rally crossing at 57.11.
LIVESTOCKhttp://quotes.ino.com/exchanges/?c=livestock
February hogs closed down $0.13 at $83.88.
February hogs closed lower on Monday. The high-range close sets the stage for a steady to slightly lower opening when Tuesday's session begins trading. Stochastics and the RSI are becoming oversold but remain neutral to bearish signaling that sideways to lower prices are possible near-term. If February extends the decline off November's high, the 62% retracement level of the October rally crossing at $82.29 is the next downside target. Closes above the 50-day moving average crossing at $86.73 is the next upside target. First resistance is the 50-day moving average crossing at $86.73 Second resistance is the 20-day moving average crossing at $87.89. First support is today's low crossing at $82.80. Second support is the 62% retracement level of the October rally crossing at $82.29.
February cattle closed up $0.50 at $156.05.
February cattle closed higher on Monday as it extended the rally off last-Wednesday's low. The high-range close sets the stage for a steady to higher opening on Tuesday. Stochastics and the RSI are neutral to bullish signaling that sideways to higher prices are possible near-term. If February renews the decline off November's high, November's low crossing at $152.28 is the next downside target. First resistance is last-Monday's high crossing at $156.38. Second resistance is November's high crossing at $156.95. First support is November's low crossing at $152.28. Second support is the October 14th low crossing at $146.72.
January Feeder cattle closed down $0.40 at $183.53.
January Feeder cattle closed lower on Monday and the mid-range close sets the stage for a steady to lower opening when Tuesday's session begins trading. Stochastics and the RSI are neutral to bullish signaling that sideways to higher prices are possible near-term. If January extends the rally off the November 28th low, the 75% retracement level of the August-October decline crossing at $187.00 is the next upside target. Closes below the 50-day moving average crossing at $179.49 would signal that a short-term top has been posted. First resistance is the 62% retracement level of the August-October decline crossing at $184.56. Second resistance is the 75% retracement level of the August-October decline crossing at $187.00. First support is the 20-day moving average crossing at $180.64. Second support is the 50-day moving average crossing at $179.49.
FOOD & FIBERhttp://quotes.ino.com/ex changes/?c=food
March coffee posted a key reversal up as it closed higher on Monday. The high-range close sets the stage for a steady to higher opening on Tuesday. Stochastics and the RSI are turning neutral to bullish signaling sideways to higher prices are possible near-term. If March extends today's rally, the 50-day moving average crossing at $17.65 is the next upside target. If March extends the decline off August's high, November's low crossing at $15.41 is the next downside target. First resistance is December's high crossing at $17.44. Second resistance is the 50-day moving average crossing at $17.65. First support is November's low crossing at $15.41. Second support is the 75% retracement level of the 2020-2022 rally crossing at $14.74.
March cocoa closed slightly higher on Monday. The high-range close sets the stage for a steady to higher opening on Tuesday. Stochastics and the RSI are neutral to bearish signaling sideways to lower prices are possible near-term. Closes below last-Monday's low crossing at 24.70 would signal that a short-term top has been posted. If March extends the rally off the November 23rd low, November's high crossing at 25.77 is the next upside target.
March sugar closed lower on Monday and the low-range close sets the stage for a steady to lower opening on Tuesday. Stochastics and the RSI have turned neutral to bullish signaling that sideways to higher prices are possible near-term. Closes above last-Monday's high crossing at 19.94 would confirm that a short-term low has been posted. Closes below the November 28th low crossing at 19.05 would renew the decline off November's high while opening the door for additional weakness near-term.
March cotton closed lower on Monday. The low-range close sets the stage for a steady to lower opening on Tuesday. Stochastics and the RSI are neutral to bearish signaling that sideways to lower prices are possible near-term. If March extends today's decline, the November 28th low crossing at 77.50 is the next downside target. If March renews the rally off October's low, November's high crossing at 89.92 is the next upside target.
Thanks much tallpine!
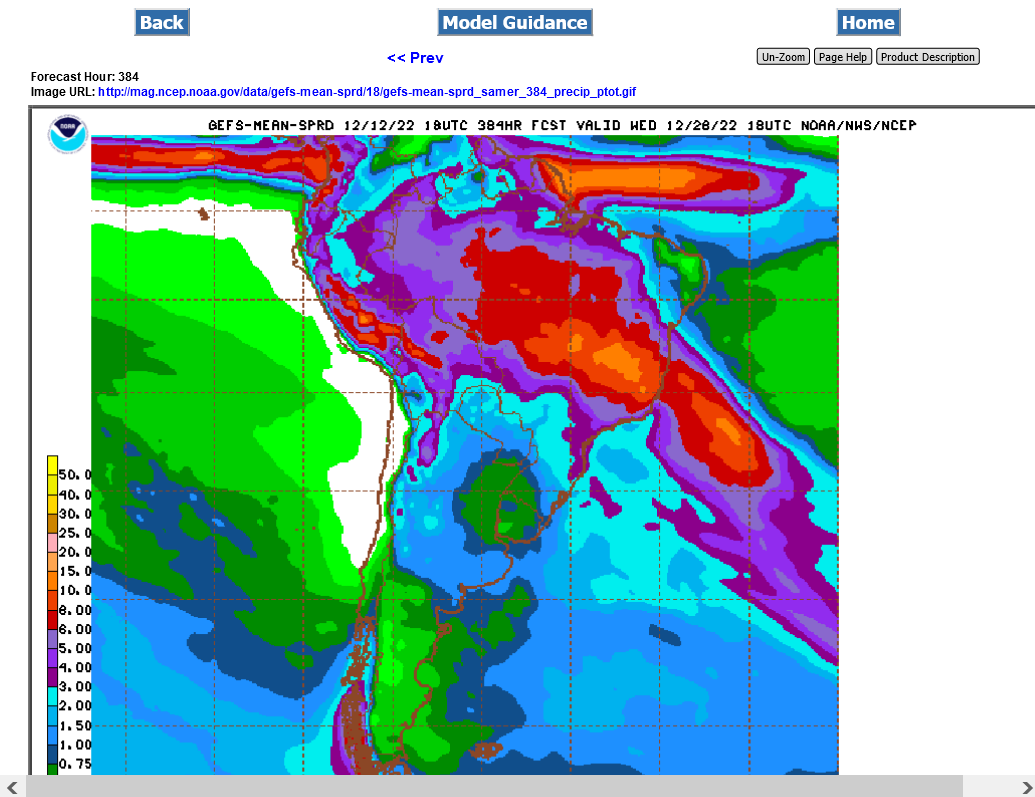
Excessive rain for coffee-land.
Not enough in Argentina.
Cold threats in the US bullish wheat and natural gas.