KEY EVENTS TO WATCH FOR:
Thursday, December 15, 2022
8:30 AM ET. December Empire State Manufacturing Survey
Mfg Idx (previous 4.5)
Employment Idx (previous 12.2)
New Orders Idx (previous -3.3)
Prices Received (previous 27.2)
8:30 AM ET. December Philadelphia Fed Business Outlook Survey
Business Activity (previous -19.4)
Prices Paid (previous 35.3)
Employment (previous 7.1)
New Orders (previous -16.2)
Prices Received (previous 34.6)
Delivery Times (previous -8.8)
Inventories (previous -6.5)
Shipments (previous 7.0)
8:30 AM ET. November Advance Monthly Sales for Retail & Food Services
Overall Sales-SA, M/M% (previous +1.3%)
Sales, Ex-Auto, M/M% (previous +1.3%)
Sales, Ex-Auto & Gas, M/M% (previous +0.9%)
8:30 AM ET. Unemployment Insurance Weekly Claims Report - Initial Claims
Jobless Claims (previous 230K)
Jobless Claims, Net Chg (previous +4K)
Continuing Claims (previous 1671000)
Continuing Claims, Net Chg (previous +62K)
8:30 AM ET. U.S. Weekly Export Sales
9:15 AM ET. November Industrial Production & Capacity Utilization
Industrial Production, M/M% (previous -0.1%)
Capacity Utilization % (previous 79.9%)
Capacity Utilization, Net Chg (Pts) (previous -0.2)
10:00 AM ET. October Manufacturing & Trade: Inventories & Sales
Total Inventories (previous +0.4%)
10:30 AM ET. EIA Weekly Natural Gas Storage Report
Working Gas In Storage (Cbf) (previous 3462B)
Working Gas In Storage, Net Chg (Cbf) (previous -21B)
4:00 PM ET. October Treasury International Capital Data
4:30 PM ET. Foreign Central Bank Holdings
4:30 PM ET. Federal Discount Window Borrowings
N/A ISM Semiannual Report On Business Economic Forecast
Friday, December 16, 2022
9:45 AM ET. December US Flash Manufacturing PMI
PMI, Mfg (previous 47.6)
9:45 PM ET. December US Flash Services PMI
PMI, Services (previous 46.1)
10:00 AM ET. November State Employment and Unemployment
N/A Latest deadline for new funding deal to avert U.S. Govt. shutdown
The STOCK INDEXES? http://quotes.ino.com/ex?changes/?c=indexes
The Dow closed lower on Wednesday as it consolidates some of the rally off October's low on news that the Fed raised interest rates for 50 basis points. The low-range close sets the stage for a steady to lower opening when Thursday's night session begins trading. Stochastics and the RSI are turning neutral to bullish signaling that sideways to higher prices are possible near-term. If the Dow extends the rally off October's low, the 75% retracement level of the January-October decline crossing at 34,893.55. Closes below last-Tuesday's low crossing at 33,418.59 would confirm that a short-term top has been posted while opening the door for additional weakness near-term. First resistance is Tuesday's high crossing at 34,712.28. Second resistance is the 75% retracement level of the January-October decline crossing at 34,901.54. First support last-Tuesday's low crossing at 33,418.59. Second support is the November 10th gap crossing at 33,065.11.
The March NASDAQ 100 closed lower on Wednesday as it extends the November-December trading range. The mid-range close sets the stage for a steady to lower opening when Thursday's night session begins trading. Stochastics and the RSI are neutral to bullish signaling sideways to higher prices are possible. If March renews the rally off November's low, the 62% retracement level of the August-October decline crossing at 12,618.67 is the next upside target. Closes below the 50-day moving average crossing at 11,560.43 would confirm that a short-term top has been posted while opening the door for additional weakness near-term. First resistance is the 50% retracement level of the August-October decline crossing at 12,229.32. Second resistance is the 62% retracement level of the August-October decline crossing at 12,618.67. First support is the 50-day moving average crossing at 11,560.43. Second support is the November 9th low crossing at 10,932.75.
The March S&P 500 closed lower on Wednesday as it consolidated some of this week's decline. The mid-range close sets the stage for a steady to lower opening when Thursday's night session begins trading. Stochastics and the RSI are turning neutral to bullish signaling that sideways to higher prices are possible near-term. If March extends the rally off October's low, the 87% retracement level of the August-November decline crossing at 4249.85 is the next upside target. Closes below last-Wednesday's low crossing at 3945.75 would confirm that a short-term top has been posted while opening the door for a possible test of the 50-day moving average crossing at 3898.68. First resistance is the 75% retracement level of the August-November decline crossing at 4150.59. Second resistance is the 87% retracement level of the August-November decline crossing at 4249.85. First support is last-Wednesday's low crossing at 3945.75. Second support is the 50-day moving average crossing at 3898.68.
INTEREST RATES? http://quotes.ino.com/ex?changes/?c=interest ""
March T-bonds closed up 4-pts. at 131-11.
March T-bonds closed slightly higher on Wednesday. The mid-range close sets the stage for a steady to higher opening when Thursday's night session begins trading. Stochastics and the RSI are turning neutral to bullish signaling that sideways to higher prices are possible near-term. If March extends the rally off November's low, the 62% retracement level of the August-November decline crossing at 133-30 is the next upside target. Closes below the 20-day moving average crossing at 128-13 would signal that a short-term top has been posted. First resistance is today's high crossing at 132-13. Second resistance is the 62% retracement level of the August-October decline crossing at 133-30. First support is the 10-day moving average crossing at129-29. Second support is the 20-day moving average crossing at 128-13.
March T-notes closed down 50-pts. at 114.300.
March T-notes closed slightly lower on Wednesday. The mid-range close sets the stage for a steady to higher opening when Thursday's night session begins trading. Stochastics and the RSI are neutral to bearish signaling that sideways to lower prices are possible near-term. Closes below the 20-day moving average crossing at 113,244 would signal that a short-term top has been posted. If March extends the rally off October's low, the 62% retracement level of the August-November decline crossing at 116.232 is the next upside target. First resistance is the 50% retracement of the August-October decline crossing at 115.090. Second resistance is the 62% retracement of the August-October decline crossing at 116.232. First support is the 20-day moving average crossing at 113.244. Second support is the 50-day moving average crossing at 112.076.
ENERGY MARKETS? http://quotes.ino.com/ex?changes/?c=energy ""
January crude oil closed higher on Wednesday as it extended the rally off last-Friday's low. The high-range close sets the stage for a steady to higher opening when Thursday's night session begins. Stochastics and the RSI are bullish signaling that sideways to higher prices are possible near-term. Closes above the 20-day moving average crossing at $77.53 would signal that a short-term low has been posted. If January renews the decline off November's high, the 62% retracement level of the 2020-2022 rally crossing at $63.80 is the next downside target. First resistance is the 20-day moving average crossing at $77.53. Second resistance is the 50-day moving average crossing at $82.72. First support is last-Friday's low crossing at $70.08. Second support is the 62% retracement level of the 2020-2022 rally crossing at $63.80.
January heating oil closed sharply higher on Wednesday as it extends the rally off last-Wednesday's low and closed above the 20-day moving average crossing at $3.1677 signaling that a short-term low has been posted. The high-range close sets the stage for a steady to higher opening when Thursday's night trading session begins. Stochastics and the RSI are neutral to bullish signaling that sideways to higher prices are possible near-term. If January extends this week's rally, the 50-day moving average crossing at $3.3798 is the next upside target. Closes below the 10-day moving average crossing at $3.0127 would signal that a short-term top has been posted. First resistance is the 50-day moving average crossing at $3.3798. Second resistance is the November 15th high crossing at $3.5789. First support is the 10-day moving average crossing at $3.0127. Second support is last-Wednesday's low crossing at $2.7750.
January unleaded gas closed sharply higher on Wednesday as it consolidated some of the decline off November's high. The high-range close sets the stage for a steady to higher opening when Thursday's night session begins trading. Stochastics and the RSI have turned bullish signaling that sideways to higher prices are possible near-term. Closes above the 20-day moving average crossing at $2.2636 would signal that a short-term low has been posted. If January renews the decline off November's high, the 50% retracement level of the 2020-2022 rally crossing at 1.9894 is the next downside target. First resistance is the 20-day moving average crossing at $2.2636. Second resistance is the 50-day moving average crossing at $2.3955. First support is Monday's low crossing at $2.0204. Second support is the 50% retracement level of the 2020-2022 rally crossing at 1.9894.
January Henry natural gas closed lower on Wednesday as it consolidated some of the rally off the December 6th low. The low-range close sets the stage for a steady to lower opening when Thursday's night session begins trading. Stochastics and the RSI are neutral to bullish signaling that sideways to higher prices are possible near-term. If January extends the rally off the December 6th low, the August-November downtrend line crossing near 7.755 is the next upside target. Closes below the 10-day moving average crossing at 6.194 would signal that a short-term top has been posted. First resistance is Tuesday's high crossing at 7.105. Second resistance is the August-November downtrend line crossing near 7.755. First support is Monday's gap crossing at 6.391. Second support is last-Tuesday's low crossing at 5.337.
CURRENCIES? http://quotes.ino.com/ex?changes/?c=currencies ""
The March Dollar closed lower on Wednesday as it extends the decline off September's high. The low-range close sets the stage for a steady to lower opening when Thursday's nights session begins trading. Stochastics and the RSI are turning neutral to bearish signaling that sideways to lower prices are possible near-term. If March extends the decline off September's high, the 75% retracement level of the January-September rally crossing at $101.331 is the next downside target. Closes above the 20-day moving average crossing at 105.276 would signal that a short-term low has been posted. First resistance is the 20-day moving average crossing at 105.276. Second resistance is the November 30thhigh crossing at 106.775. First support is today's low crossing at $103.065. Second support is 75% retracement level of the January-September rally crossing at $101.331.
The March Euro closed higher on Wednesday as it extends the rally off September's low. The high-range close sets the stage for a steady to higher opening when Thursday's night session begins trading. Stochastics and the RSI are overbought but remain neutral to bullish signaling that sideways to higher prices are possible near-term. If March extends the rally off September's low, the 25% retracement level of the 2018-2022 decline crossing at $1.07982 is the next upside target. Closes below the 20-day moving average crossing at 1.05320 would signal that a short-term top has been posted. First resistance is today's high crossing at $1.07680. Second resistance is the 25% retracement level of the 2018-2022 decline crossing at $1.07982 is the next upside target. First support is the 20-day moving average crossing at $1.05320. Second support is the November 21st low crossing at $1.03165.
The March British Pound closed higher on Wednesday as it extended the rally off September's low. The high-range close sets the stage for a steady to higher opening when Thursday's night session begins trading. Stochastics and the RSI are overbought but remain neutral to bullish signaling sideways to higher prices are possible near-term. If March extends the rally off September's low, the 62% retracement level of the May-September decline crossing at 1.2770 is the next upside target. Closes below the 20-day moving average crossing at 1.2143 would confirm that a short-term top has been posted. First resistance is today's high crossing at 1.2479. Second resistance is the 62% retracement level of the May-September decline crossing at 1.2770. First support is the 20-day moving average crossing at 1.2143. Second support is the November 30th low crossing at 1.1937.
The March Swiss Franc closed higher on Wednesday as it extends the rally off November's low. The high-range close sets the stage for a steady to higher opening when Thursday's night session begins trading. Stochastics and the RSI are becoming overbought but remain neutral to bullish signaling that sideways to higher prices are possible near-term. If March extends the rally off November's low, the 62% retracement level of the 2018-2022 decline crossing at 1.10351 is the next upside target. Closes below the 20-day moving average crossing at 1.07393 would signal that a short-term top has been posted. First resistance is today's high crossing at 1.09665. Second resistance is the 62% retracement level of the 2018-2022 decline crossing at 1.10351. First support is the 20-day moving average crossing at 1.07393. Second support is the November 30th low crossing at 1.06060.
The March Canadian Dollar closed slightly higher on Wednesday. The high-range close sets the stage for a steady to higher opening when Thursday's night session begins trading. Stochastics and the RSI are turning neutral to bullish signaling that sideways to higher prices are possible near-term. Closes above last-Monday's high crossing at 74.82 would confirm that a short-term low has been posted. If March renews the decline off November's high, the November 3rd low crossing at 72.58 is the next downside target. First resistance is last-Monday's high crossing at 74.82. Second resistance is the November 25thhigh crossing at 75.16. First support is last-Wednesday's low crossing at 73.12. Second support is the November 3rd low crossing at 72.58.
The March Japanese Yen closed higher on Wednesday. The high-range close sets the stage for a steady to higher opening when Thursday’s night session begins trading. Stochastics and the RSI are turning neutral to bullish signaling that sideways to higher prices are possible near-term. If March renews the rally off October's low, the 87% retracement level of the August-October decline crossing at 0.076735 is the next upside target. Closes below the 20-day moving average crossing at 0.073537 would confirm that a short-term top has been posted while opening the door for additional weakness near-term. First resistance is the 75% retracement level of the August-October decline crossing at 0.075398. Second resistance is the 87% retracement level of the August-October decline crossing at 0.076735. First support is the 20-day moving average crossing at 0.073537. Second support is the November 21st low crossing at 0.071410.
PRECIOUS METALS? http://quotes.ino.com/ex?changes/?c=metals ""
February gold posted an inside day with a lower close on Wednesday as it consolidated some of the rally off November's low. The high-range close sets the stage for a steady to higher opening when Thursday's night session begins trading. Stochastics and the RSI are neutral to bullish signaling that sideways to higher prices are possible near-term. If February extends the rally off November's low, the 50% retracement level of the March-October decline crossing at $1861.40 is the next upside target. Closes below the 20-day moving average crossing at $1784.50 would signal that a short-term top has been posted. First resistance is Tuesday's high crossing at $1836.90. Second resistance is the 50% retracement level of the March-October decline crossing at $1861.40. First support is the 20-day moving average crossing at $1784.50. Second support is the November 23rd low crossing at $1733.50.
March silver closed slightly higher on Wednesday as it extended the rally off September's low. The high-range close sets the stage for a steady to higher opening when Thursday's night session begins trading. Stochastics and the RSI are overbought but remain neutral to bullish signaling that sideways to higher prices are possible near-term. If March extends the rally off October's low, the 75% retracement level of the March-August decline crossing at 24.779 is the next upside target. Closes below the 20-day moving average crossing at 22.303 would confirm that a short-term top has been posted while opening the door for additional weakness near-term. First resistance is Tuesday's high crossing at 24.390. Second resistance is the 75% retracement level of the March-September decline crossing at 24.779. First support is the 10-day moving average crossing at 23.220. Second resistance is the 20-day moving average crossing at 22.303.
March copper closed higher on Wednesday. The mid-range close sets the stage for a steady to higher opening when Thursday's night session begins trading. Stochastics and the RSI are turning neutral to bearish signaling that sideways to lower prices are possible near-term. Closes below the 20-day moving average crossing at 3.7471 would signal that a short-term top has been posted. If March extends the rally off September's low, the 50% retracement level of the March-July decline crossing at 4.0343 is the next upside target. First resistance is November's high crossing at 3.9470. Second resistance is the 50% retracement level of the March-July decline crossing at 4.0343. First support is the 20-day moving average crossing at 3.7471. Second support is the 50-day moving average crossing at 3.6020.
GRAINS? http://quotes.ino.com/ex?changes/?c=grains "
March Corn closed down a $0.03-cent at $6.53 1/2.
March corn closed lower on Wednesday. The low-range close sets the stage for a steady to lower opening when Thursday's night session begins trading. Stochastics and the RSI are neutral to bullish signaling that sideways to higher prices are possible near-term. Closes above the 20-day moving average crossing at $6.57 1/4 would signal that a short-term low has been posted. If March renews the decline off October's high, the 62% retracement level of the July-October rally crossing at $6.23 is the next downside target. First resistance is the 20-day moving average crossing at $6.57 1/4. Second resistance is the 50-day moving average crossing at $6.74 3/4. First support is last-Wednesday's low crossing at $6.35. Second support is the 62% retracement level of the July-October rally crossing at $6.23.
March wheat closed down $0.01 1/2-cents at $7.49 1/4.
March wheat closed lower on Wednesday as it extends the trading range of the past seven-days. The high-range close sets the stage for a steady to higher opening when Thursday's night session begins trading. Stochastics and the RSI are turning neutral to bullish signaling that sideways to higher prices are possible near-term. Closes above the 20-day moving average crossing at $7.78 3/4 would signal that a short-term low has been posted. If March renews the decline off October's high, the September 9, 2021 low crossing at $6.94 is the next downside target. First resistance is the 20-day moving average crossing at $7.78 3/4. Second resistance is the 50-day moving average crossing at $8.35. First support is the 75% retracement level of the 2018-2022 rally crossing at $7.24 1/4. Second support is the September 9, 2021 low crossing at $6.94.
March Kansas City Wheat closed down $0.15-cents at $8.50 1/4.
March Kansas City wheat closed lower on Wednesday as it consolidates some of the rally off last-Tuesday's low. The low-range close sets the stage for a steady to lower opening when Thursday's night session begins trading. Stochastics and the RSI have turned neutral to bullish signaling that sideways to higher prices are possible near-term. Closes above the 20-day moving average crossing at $8.84 would confirm that a short-term low has been posted. If March renews the decline off October's high, August's low crossing at $8.18 3/4 is the next downside target. First resistance is the 20-day moving average crossing at $8.84. Second resistance is the 50-day moving average crossing at $9.25 1/2. First support is last-Tuesday's low crossing at $8.21 3/4. Second support is August's low crossing at $8.18 3/4.
March Minneapolis wheat closed down $0.05 1/2-cents at $9.17 1/4.
March Minneapolis wheat closed lower on Wednesday. The high-range close sets the stage for a steady to slightly lower opening when Thursday's night session begins trading. Stochastics and the RSI are neutral to bullish signaling that sideways to higher prices are possible near-term. Closes above the 20-day moving average crossing at $9.32 would signal that a short-term low has been posted. If March renews the decline off November's high, August's low crossing at $8.75 3/4 is the next downside target. First resistance is the 20-day moving average crossing at $9.32. Second resistance is the 50-day moving average crossing at $9.54 3/4. First support is last-Tuesday's low crossing at $8.90. Second support is the August's low crossing at $8.75 3/4.
SOYBEAN COMPLEX? http://quotes.ino.com/ex?changes/?c=grains "
January soybeans closed up $0.02 1/2-cents at $14.82 1/4.
January soybeans closed higher on Wednesday. The high-range close sets the stage for a steady to higher opening when Thursday's night trade begins. Stochastics and the RSI are turning neutral to bearish signaling that sideways to lower prices are possible near-term. Closes below the 20-day moving average crossing at $14.51 1/4 would signal that a short-term top has been posted. If January extends the rally off October's low, September's high crossing at $15.12 1/4 is the next upside target. First resistance is the September 21st high crossing at $14.93 1/2. Second resistance is September's high crossing at $15.12 1/4. First support is the 20-day moving average crossing at $14.51 1/4. Second support is the 50-day moving average crossing at $14.27 3/4.
January soybean meal closed up $7.80 at $460.10.
January soybean meal closed higher on Wednesday as it consolidated some of Monday's sharp decline. The high-range close sets the stage for a steady to higher opening when Thursday's night session begins trading. Stochastics and the RSI are turning neutral to bearish signaling that sideways to lower prices are possible near-term. Closes below the 10-day moving average crossing at $448.60 would signal that a short-term top has been posted. If January renews the rally off October's low, monthly support on the continuation chart crossing at $478.60 is the next upside target. First resistance is last-Friday's high crossing at $474.40. Second resistance is monthly resistance crossing at $478.60. First support is the 10-day moving average crossing at $448.60. Second support is the 20-day moving average crossing at $428.10.
January soybean oil closed down 57-pts. At 63.55.
January soybean oil closed lower on Wednesday as it consolidates some of the rally off Monday's low. The low-range close sets the stage for a steady to lower opening when Thursday's night session begins trading. Stochastics and the RSI have turned neutral to bullish signaling that sideways to higher prices are possible near-term. If January extends this week's rally, the December 2nd gap crossing at 67.38 is the next upside target. If January renews the decline off November's high, the 87% retracement level of the July-November rally crossing at 57.11 is the next downside target. First resistance is today's high crossing at 64.76. Second resistance is the December 2nd gap crossing at 67.38. First support is the 75% retracement level of the July-November rally crossing at 59.72. Second support is the 87% retracement level of the July-November rally crossing at 57.11.
LIVESTOCKhttp://quotes.ino.com/exchanges/?c=livestock
February hogs closed down $1.25 at $83.32.
February hogs closed lower on Wednesday. The low-range close sets the stage for a steady to lower opening when Thursday's session begins trading. Stochastics and the RSI are oversold but remain neutral to bearish signaling that sideways to lower prices are possible near-term. If February extends the decline off November's high, the 62% retracement level of the October rally crossing at $82.29 is the next downside target. Closes above the 50-day moving average crossing at $86.94 is the next upside target. First resistance is the 50-day moving average crossing at $86.94 Second resistance is the 20-day moving average crossing at $87.33. First support is Monday's low crossing at $82.80. Second support is the 62% retracement level of the October rally crossing at $82.29.
February cattle closed down $0.68 at $156.48.
February cattle closed lower on Wednesday as it consolidated some of the rally off last-Wednesday's low. The low-range close sets the stage for a steady to lower opening on Thursday. Stochastics and the RSI are neutral to bullish signaling that sideways to higher prices are possible near-term. If February extends this month's rally. November's high crossing at $156.95 is the next upside target. Closes below the 50-day moving average crossing at $154.51 would signal that a short-term top has been posted. First resistance is Tuesday's high crossing at $156.78. Second resistance is November's high crossing at $156.95. First support is the 20-day moving average crossing at $155.31. Second support is the 50-day moving average crossing at $154.51.
January Feeder cattle closed down $0.88 at $183.35.
January Feeder cattle closed lower on Wednesday and the low-range close sets the stage for a steady to lower opening when Thursday's session begins trading. Stochastics and the RSI are overbought but remain neutral to bullish signaling that sideways to higher prices are possible near-term. If January extends the rally off the November 28th low, the 75% retracement level of the August-October decline crossing at $187.00 is the next upside target. Closes below the 20-day moving average crossing at $180.20 would signal that a short-term top has been posted. First resistance is the 62% retracement level of the August-October decline crossing at $184.56. Second resistance is the 75% retracement level of the August-October decline crossing at $187.00. First support is the 20-day moving average crossing at $180.20. Second support is the 50-day moving average crossing at $179.78.
FOOD & FIBERhttp://quotes.ino.com/ex changes/?c=food
March coffee closed slightly higher on Wednesday as it extends the rally off Monday's low. The high-range close sets the stage for a steady to higher opening on Thursday. Stochastics and the RSI are neutral to bullish signaling sideways to higher prices are possible near-term. If March extends this week's rally, the 50-day moving average crossing at $17.48 is the next upside target. If March extends the decline off August's high, November's low crossing at $15.41 is the next downside target. First resistance is December's high crossing at $17.44. Second resistance is the 50-day moving average crossing at $17.48. First support is November's low crossing at $15.41. Second support is the 75% retracement level of the 2020-2022 rally crossing at $14.74.
March cocoa posted an inside day with a lower close on Wednesday. The low-range close sets the stage for a steady to lower opening on Thursday. Stochastics and the RSI are neutral signaling sideways trading possible near-term. If March extends the rally off the November 23rd low, November's high crossing at 25.77 is the next upside target. Closes below last-Monday's low crossing at 24.70 would signal that a short-term top has been posted.
March sugar closed sharply higher on Wednesday as it extends the rally off the November 28th low. The high-range close sets the stage for a steady to higher opening on Thursday. Stochastics and the RSI have turned neutral to bullish signaling that sideways to higher prices are possible near-term. If March extends the aforementioned rally, November's high crossing at 20.48 is the next upside target. Closes below Tuesday's low crossing at 19.31 would signal that a short-term top has been posted.
March cotton closed lower on Wednesday. The low-range close sets the stage for a steady to lower opening on Thursday. Stochastics and the RSI are turning neutral to bullish signaling that sideways to higher prices are possible near-term. If March extends this month's decline, the November 28th low crossing at 77.50 is the next downside target. If March renews the rally off October's low, November's high crossing at 89.92 is the next upside target.
Thanks much tallpine!
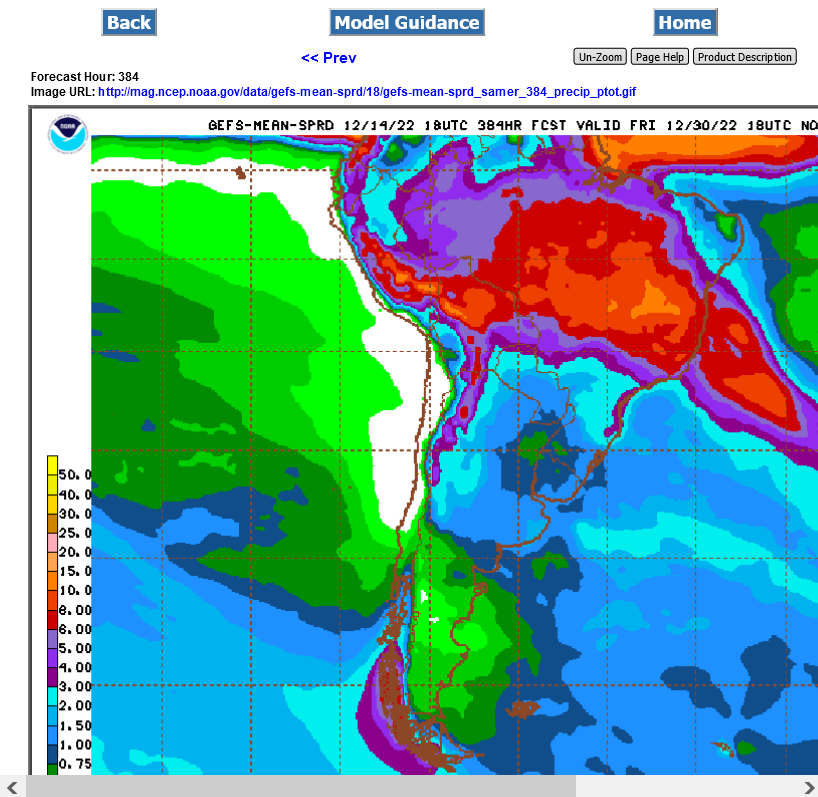
Rain amounts have gone up a bit in Argentina but no drought busting pattern change.