KEY EVENTS TO WATCH FOR:
Thursday, December 15, 2022
8:30 AM ET. December Empire State Manufacturing Survey
Mfg Idx (previous 4.5)
Employment Idx (previous 12.2)
New Orders Idx (previous -3.3)
Prices Received (previous 27.2)
8:30 AM ET. December Philadelphia Fed Business Outlook Survey
Business Activity (previous -19.4)
Prices Paid (previous 35.3)
Employment (previous 7.1)
New Orders (previous -16.2)
Prices Received (previous 34.6)
Delivery Times (previous -8.8)
Inventories (previous -6.5)
Shipments (previous 7.0)
8:30 AM ET. November Advance Monthly Sales for Retail & Food Services
Overall Sales-SA, M/M% (previous +1.3%)
Sales, Ex-Auto, M/M% (previous +1.3%)
Sales, Ex-Auto & Gas, M/M% (previous +0.9%)
8:30 AM ET. Unemployment Insurance Weekly Claims Report - Initial Claims
Jobless Claims (previous 230K)
Jobless Claims, Net Chg (previous +4K)
Continuing Claims (previous 1671000)
Continuing Claims, Net Chg (previous +62K)
8:30 AM ET. U.S. Weekly Export Sales
9:15 AM ET. November Industrial Production & Capacity Utilization
Industrial Production, M/M% (previous -0.1%)
Capacity Utilization % (previous 79.9%)
Capacity Utilization, Net Chg (Pts) (previous -0.2)
10:00 AM ET. October Manufacturing & Trade: Inventories & Sales
Total Inventories (previous +0.4%)
10:30 AM ET. EIA Weekly Natural Gas Storage Report
Working Gas In Storage (Cbf) (previous 3462B)
Working Gas In Storage, Net Chg (Cbf) (previous -21B)
4:00 PM ET. October Treasury International Capital Data
4:30 PM ET. Foreign Central Bank Holdings
4:30 PM ET. Federal Discount Window Borrowings
N/A ISM Semiannual Report On Business Economic Forecast
Friday, December 16, 2022
9:45 AM ET. December US Flash Manufacturing PMI
PMI, Mfg (previous 47.6)
9:45 PM ET. December US Flash Services PMI
PMI, Services (previous 46.1)
10:00 AM ET. November State Employment and Unemployment
N/A Latest deadline for new funding deal to avert U.S. Govt. shutdown
The STOCK INDEXES? http://quotes.ino.com/ex?changes/?c=indexes
The STOCK INDEXES: The March NASDAQ 100 was lower overnight as it extends the decline off Tuesday's high. Overnight trading sets the stage for a lower opening when the day session begins trading.Stochastics and the RSI have turned neutral to bearish signaling that sideways to lower prices are possible near-term. Closes below the 50-day moving average crossing at 11,560.94 would mark a downside breakout of the November-December trading range while opening the door for additional weakness possibly till the end of the year. If March renews the rally off last-Wednesday's low, the 62% retracement level of the August-October decline crossing at 12,618.67 is the next upside target. First resistance is the 50% retracement level of the August-October crossing at 12,229.32. Second resistance is the 62% retracement level of the August-October crossing at 12,618.67. First support is the 50-day moving average crossing at 11,560.94. Second support is the November 9th low crossing at 10,932.75.
The March S&P 500 was lower overnight as it extends the decline off Tuesday's high. Overnight trading sets the stage for a lower opening when the day session begins trading. Stochastics and the RSI have turned neutral to bearish signaling that sideways to lower prices are possible near-term. If March resumes the decline off Tuesday's high, the 50-day moving average crossing at 3902.55 is the next downside target. If March renews the rally off October's low, the 87% retracement level of the August-October decline crossing at 4254.67 is the next upside target. First resistance is the 75% retracement level of the August-October declinecrossing at 4153.96. Second resistance is the 87% retracement level of the August-October decline crossing at 4254.67. First support is the 50-day moving average crossing at 3902.55. Second support is the November 9th low crossing at 3782.75.
INTEREST RATES http://quotes.ino.com/ex changes/?c=interest"
INTEREST RATES: March T-bonds was slightly higher overnight and sets the stage for a higher opening when the day session begins trading. Stochastics and the RSI are turning neutral to bullish signaling that sideways to higher prices are possible near-term. If March extends the rally off October's low, the 62% retracement level of the August-October decline crossing at 133-30 is the next upside target. Closes below the 20-day moving average crossing at 128-21 would signal that a short-term top has been posted. First resistance is Tuesday's high crossing at 132-13. Second resistance is the 62% retracement level of the August-October decline crossing at 133-30. First support is the 20-day moving average crossing at 128-21. Second support is the 50-day moving average crossing at 124-23.
March T-notes were higher overnight and sets the stage for a higher opening when the day session begins trading. Stochastics and the RSI have turned neutral to bullish signaling that sideways to higher prices are possible near-term. If March extends the rally off October's low, the 62% retracement level of the August-October decline crossing at 116.232 is the next upside target. Closes below the 20-day moving average crossing at 113.266 would signal that a short-term top has been posted. First resistance is the 50% retracement level of the August-October decline crossing at 115.090. Second resistance is the 62% retracement level of the August-October decline crossing at 116.232. First support is the 20-day moving average crossing at 113.266. Second support is the 50-day moving average crossing at 112.090.
ENERGY MARKETS? http://quotes.ino.com/ex?changes/?c=energy ""
ENERGIES:Januarycrude oil was steady to slightly higher overnight as it extends the short covering rally off last-Friday's low. Overnight trading sets the stage for a slightly higher opening when the day session begins trading. Stochastics and the RSI are neutral to bullish signaling that sideways to higher prices are possible near-term. Closes above the 20-day moving average crossing at $77.14 would signal that a short-term low has been posted. If January renews the decline November's high, the 62% retracement level of the 2020-2022 rally crossing at $63.80 is the next downside target. First resistance is the 20-day moving average crossing at $77.14. Second resistance is the 50-day moving average crossing at $82.55. First support is last-Friday's low crossing at $70.08. Second support is the 62% retracement level of the 2020-2022 rally crossing at $63.80.
January heating oil was slightly lower overnight as it consolidates some of the rally off last-Wednesday's low. Overnight trading sets the stage for a slightly lower opening when the day session begins trading. Stochastics and the RSI are neutral to bullish signaling that sideways to higher prices are possible near-term. If January extends this week's rally, the 50-day moving average crossing at $3.3754 is the next upside target. Closes below the 10-day moving average crossing at $3.0118 would signal that a short-term top has been posted. First resistance is the 50-day moving average crossing at $3.3754. Second resistance is December's high crossing at $3.4103. First support is the 20-day moving average crossing at $3.1562. Second support is the 10-day moving average crossing at $3.0118.
January unleaded gas was lower overnight as it consolidates some of the rally off Wednesday's low. Overnight trading sets the stage for a lower opening when the day session begins trading. Stochastics and the RSI are neutral to bullish signaling that sideways to higher prices are possible near-term. Closes above the 20-day moving average crossing at $2.2523 would signal that a short-term low has been posted. If January renews the decline off November's high, the 50% retracement level of the 2020-2022 rally crossing at $1.9894 is the next downside target. First resistance is the 20-day moving average crossing at $2.2523. Second resistance is the 50-day moving average crossing at $2.3908. First support is Monday's low crossing at $2.0204. Second support is the 50% retracement level of the 2020-2022 rally crossing at $1.9894.
January natural gas was slightly higher overnight as it consolidates some of Wednesday's decline. Overnight trading sets the stage for a steady to slightly higher opening when the day session begins trading. Stochastics and the RSI are neutral to bullish signaling that sideways to higher prices are possible near-term. If January extends the rally off last-Tuesday's low, the August-November downtrend line crossing near 7.715 is the next upside target. Closes below the 10-day moving average crossing at 6.168 would temper the near-term friendly outlook. First resistance is Tuesday's high crossing at 7.105. Second resistance is the August-November downtrend line crossing near 7.715. First support is the 10-day moving average crossing at 6.168. Second support is the 62% retracement level of the 2020-2022 rally crossing at 5.500.
CURRENCIEShttp://quotes.ino.com/ex changes/?c=currencies"
CURRENCIES:The March Dollar was higher overnight as it consolidates some of this week's losses. Overnight trading sets the stage for a higher opening when the day session begins trading. Stochastics and the RSI are oversold but remain neutral to bearish signaling that sideways to lower prices are possible near-term. If March extends the decline off September's high, the June 27th low crossing at $102.883 is the next downside target. Closes above the 20-day moving average crossing at $105.169 would signal that a short-term low has been posted. First resistance is the 20-day moving average crossing at $105.169. Second resistance is the November 30th high crossing at $106.775. First support is Wednesday's low crossing at $103.065. Second support is the June 27th low crossing at $102.883.
The March Euro was lower overnight due to profit taking and sets the stage for a lower opening when the day session begins trading. Stochastics and the RSI are overbought but remains neutral to bullish signaling that sideways to higher prices are possible near-term. If March extends the rally off September's low, the 25% retracement level of the 2021-2022 decline crossing at $1.08062 is the next upside target. Closes below the 20-day moving average crossing at $1.05408 would signal that a short-term top has been posted. First resistance is Wednesday's high crossing at $1.07680. Second resistance is the 25% retracement level of the 2021-2022 crossing at $1.08062. First support is the 20-day moving average crossing at $1.05408. Second support is the November 21st low crossing at $1.03165.
The March British Pound was lower overnight and sets the stage for a lower opening when the day session begins trading. Stochastics and the RSI are overbought but remain neutral to bullish signaling that sideways to higher prices are possible near-term. If March extends the rally off September's low, the 62% retracement level of the 2021-2022 decline crossing at 1.2770 is the next upside target. Closes below the 20-day moving average crossing at 1.2162 would signal that a short-term top has been posted. First resistance is Tuesday's high crossing at 1.2477. Second resistance is the 62% retracement level of the 2021-2022 decline crossing at 1.2770. First support is the 20-day moving average crossing at 1.2162. Second support is the November 30th low crossing at 1.1937.
The March Swiss Franc was lower overnight due to profit taking as it consolidates some of this week's gains. Overnight trading sets the stage for a lower opening when the day session begins trading. Stochastics and the RSI are overbought, diverging but remain neutral to bullish signaling that sideways to higher prices are possible near-term. If March extends the rally off the November 21st low, the 62% retracement level of the 2021-2022 decline crossing at 1.10351 is the next upside target. Closes below the 20-day moving average crossing at 1.07455 would temper the near-term friendly outlook. First resistance is Wednesday's high crossing at 1.09665. Second resistance is the 62% retracement level of the 2021-2022 decline crossing at 1.10351. First support is the 20-day moving average crossing at 1.07455. Second support is the November 30th low crossing at 1.06060.
The March Canadian Dollar was steady to slightly lower overnight as it extends the trading range of the past seven-days. Overnight trading sets the stage for a lower opening when the day session begins trading. Stochastics and the RSI have turned neutral to bullish signaling that sideways to higher prices are possible near-term. Closes above the 20-day moving average crossing at $74.15 would signal that a short-term low has been posted. If March renews the decline off November's high, November's low crossing at $72.44 is the next downside target. First resistance is the 20-day moving average crossing at $74.15. Second resistance is last-Monday's high crossing at $74.82. First support is last-Wednesday's low crossing at $73.12. Second support is November low crossing at $72.58.
The March Japanese Yen was lower overnight and sets the stage for a lower opening when the day session begins trading. Stochastics and the RSI are neutral signaling that sideways to lower prices are possible near-term. Closes below the 20-day moving average crossing at 0.073584 would signal that a short-term top has been posted. If March renews the rally off October's, the 87% retracement level of the August-October decline crossing at 0.076735 is the next upside target. First resistance is the December 2nd high crossing at 0.075820. Second resistance is the 87% retracement level of the August-October decline crossing at 0.076735. First support is the 20-day moving average crossing at 0.073584. Second support is the November 21's low crossing at 0.071410.
PRECIOUS METALS http://quotes.ino.com/ex changes/?c=metals"
PRECIOUS METALS: Februarygold was sharply lower overnight as it extends the decline off Tuesday's high. Overnight trading sets the stage for a lower opening when the day session begins trading. Stochastics and the RSI are overbought, diverging and are turning neutral to bearish signaling that sideways to lower prices are possible near-term. Closes below the 20-day moving average crossing at $1784.40 would confirm that a short-term top has been posted. If February extends the rally off November's low, the 50% retracement level of the March-October decline crossing at $1861.40 is the next upside target. First resistance is Tuesday's high crossing at $1836.90. Second resistance is the 50% retracement level of the March-October decline crossing at $1861.40. First support is the 20-day moving average crossing at $1784.40. Second support is the November 23rd low crossing at $1733.50.
March silver was sharply lower overnight as it consolidates some of this month's gains. Overnight trading sets the stage for a sharply lower opening when the day session begins trading later this morning. Stochastics and the RSI are overbought and are turning neutral to bearish signaling that sideways to lower prices are possible near-term. Closes below the 20-day moving average crossing at $22.385 would confirm that a short-term top has been posted. If March extends the rally off October's low, the 75% retracement level of the March-August decline crossing at $24.779 is the next upside target. First resistance is the 75% retracement level of the March-August decline crossing at $24.779. Second resistance is the 87% retracement level of the March-August decline crossing at $25.938. First support the 10-day moving average crossing at $23.274. Second support is the 20-day moving average crossing at $22.385.
March copper was lower overnight as it extends this month's trading range. The mid-range overnight trade sets the stage for a steady to lower opening when the day session begins trading. Stochastics and the RSI are overbought and are turning neutral to bearish signaling that sideways to lower prices are possible near-term. Closes below the 20-day moving average crossing at 3.7512 would signal that a short-term top has been posted. If March resumes the rally off the November 28th low, the 50% retracement level of the March-July decline crossing at 4.0343 is the next upside target. First resistance is November's high crossing at 3.9470. Second resistance is the 50% retracement level of the March-July decline crossing at 4.0343. First support is the 20-day moving average crossing at 3.7512. Second support is the 50-day moving average crossing at 3.6095.
GRAINS http://quotes.ino.com/ex changes/?c=grains
March corn was lower overnight as it consolidates some of the rally off last-Wednesday's low. Overnight trading sets the stage for a lower opening when the day sessions begins trading. Stochastics and the RSI are turning neutral to bearish signaling that sideways to lower prices are possible near-term. If March renews the decline off the October 31st high, the 62% retracement level of the July-October rally crossing at $6.23 is the next downside target. Closes above the 20-day moving average crossing at $6.56 1/4 would signal that a short-term low has been posted. First resistance is the 20-day moving average crossing at $6.56 1/4. Second resistance is the 50-day moving average crossing at $6.74. First support is last-Wednesday's low crossing at $6.35. Second support is the 62% retracement level of the July-October rally crossing at $6.23.
March wheat was slightly higher overnight as it consolidates above the 75% retracement level of the 2020-2022 rally crossing at $7.24 1/4. Overnight trading sets the stage for a higher opening when the day session begins trading. Stochastics and the RSI have turned neutral to bullish signaling that sideways to higher prices are possible near-term. Closes above the 20-day moving average crossing at $7.74 1/2 would signal that a short-term low has been posted. If March renews the decline off October's high, the 87% retracement level of the 2020-2022 rally crossing at $6.36 1/4 is the next downside target. First resistance is the 20-day moving average crossing at $7.74 1/2. Second resistance is the 50-day moving average crossing at $8.31 3/4. First support is the 75% retracement level of the 2020-2022 rally crossing at $7.24 1/4. Second support is the 87% retracement level of the 2020-2022 rally crossing at $6.36 1/4.
March Kansas City wheat was steady to fractionally higher overnight. Overnight trading sets the stage for a steady to slightly higher opening when the day session begins trading later this morning. Stochastics and the RSI have turned neutral to bullish signaling that sideways to higher prices are possible near-term. Closes above the 20-day moving average crossing at $8.79 1/4 would signal that a short-term low has been posted. If March resumes the decline off October's high, August's low crossing at $8.11 3/4 is the next downside target. First resistance is the 20-day moving average crossing at $8.79 1/4. Second resistance is the 50-day moving average crossing at $9.22 3/4. First support is last-Tuesday's low crossing at $8.21 3/4. Second support is August's low crossing at $8.11 3/4.
March Minneapolis wheat was slightly higher overnight and sets the stage for a higher opening when the day session begins trading. Stochastics and the RSI are neutral to bullish signaling that sideways to higher prices are possible near-term. Closes above the 20-day moving average crossing at $9.29 1/4 would signal that a short-term low has been posted. If March renews the decline off November's high, August's low crossing at $8.75 3/4 is the next downside target. First resistance is the 20-day moving average crossing at $9.29 1/4. Second resistance is the 50-day moving average crossing at $9.53 1/2. First support is last-Tuesday's low crossing at $8.90. Second support is August's low crossing at $8.75 3/4.
SOYBEAN COMPLEX? http://quotes.ino.com/ex?changes/?c=grains "
January soybeans were lower overnight and sets the stage for a lower opening when the day session begins trading. Stochastics and the RSI are becoming overbought but remain neutral to bullish signaling that sideways to higher prices are possible near-term. If January extends the rally off October's low, September's high crossing at $15.12 1/4 is the next upside target. Closes below the 20-day moving average crossing at $14.53 1/2 would signal that a short-term top has been posted. First resistance is the September 21st high crossing at $14.93 1/2. Second resistance is September's high crossing at $15.12 1/4. First support is the 20-day moving average crossing at $14.53 1/2. Second support is the 50-day moving average crossing at $14.29 3/4.
January soybean meal was steady to slightly higher overnight as it consolidates some of Monday's decline. Overnight trading sets the stage for a slightly higher opening when the day session begins trading. Stochastics and the RSI have turned neutral to bullish again signaling that sideways to higher prices are possible near-term. If January renews the rally off November's low, monthly resistance on the continuation chart crossing at $478.60 is the next upside target is the next upside target. Closes below Monday's low crossing at $448.60 would signal that a short-term top has been posted. First resistance is last-Friday's high crossing at $474.40. Second resistance is monthly resistance on the continuation chart crossing at $478.60. First support is Monday's low crossing at $448.60. Second support is the 20-day moving average crossing at $431.00.
January soybean oil was lower overnight as it consolidated some of the rally off Monday's low. Overnight trading sets the stage for a lower opening when the day session begins trading. Stochastics and the RSI are turning neutral to bearish signaling that sideways to lower prices are possible near-term. If January renews the decline off November's high, the 87% retracement level of the July-November rally crossing at 57.11 is the next downside target. Closes above the 20-day moving average crossing at 66.82 would signal that a short-term low has been posted. First resistance is the 20-day moving average crossing at 66.82. Second resistance is the 20-day moving average crossing at 66.82. First support is Monday's low crossing at 58.94. Second support is the 87% retracement level of the July-November rally crossing at 57.11.
Thanks tallpine!
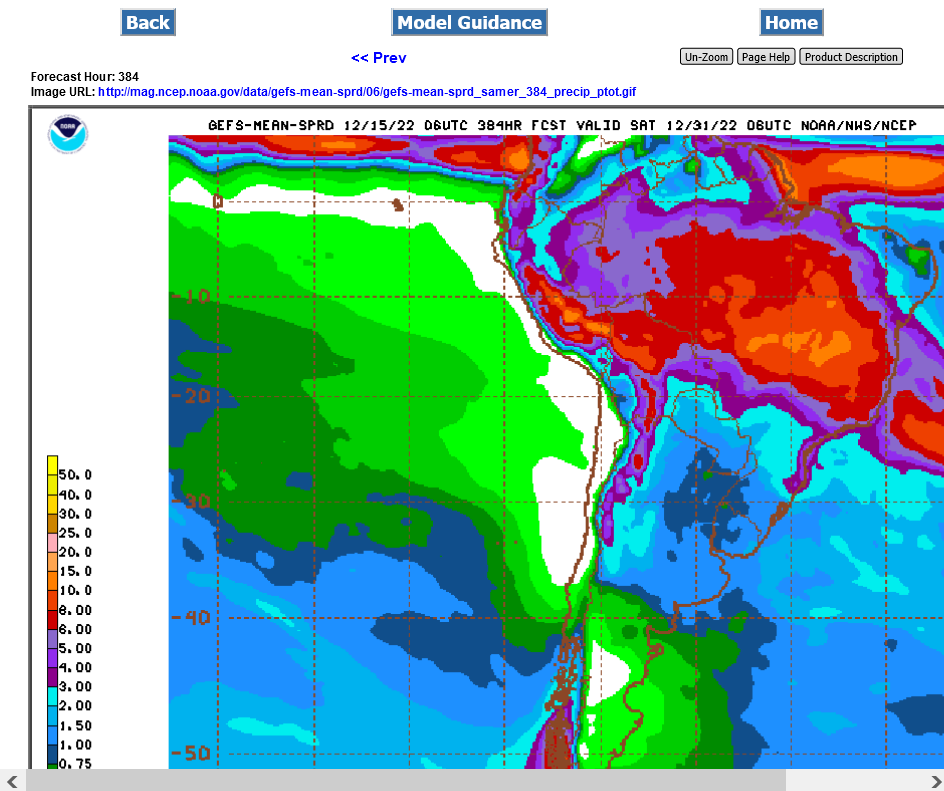
Rains amounts have gone up a bit for Argentina but still no drought busting pattern yet.
Frigid weather on the way for NG and EIA weekly storage release at 9:30am.
https://www.cpc.ncep.noaa.gov/products/predictions/610day/ | |||||||||
| 6 to 10 day outlooks | |||||||||
| Click below for information about how to read 6-10 day outlook maps Temperature Precipitation | |||||||||
| Click below for archives of past outlooks (data & graphics), historical analogs to todays forecast, and other formats of the 6-10 day outlooks ArchivesAnalogsLines-Only FormatGIS Data | |||||||||
Temperature Probability | |||||||||
Precipitation Probability | |||||||||

