The technicals gave an ugly bearish signal on the weekly chart this week. New highs and closed lower than the previous week's low. I cannot ignore that. Nor can I ignore the steepest inverted yield curve in 40 years. The Federal Reserve is on a mission to beat back inflation even if they have to break something. (the economy)
But the contrarian in my cannot get too bearish because sentiment is so bearish. Put/Call ratios are setting records.
If we have a recession in 2023 it will be the most widely expected recession in my lifetime. Other recessions usually come out of the blue.
Thanks much joj!
You're our stock market "go to" guy!
I agree with everything that you say.
The stock market is also a lot about psychology. If people anticipate a recession, does that make it more likely because they act in a way that causes it?
Is their anticipating it causing paranoia that's stifling the market from being bullish, when it should be bullish?
Or, are they right and being smart with their money right now because of warning signs in the economy and interest rates?
People can be convinced to think almost anything and they will react with a mob mentality. Smart stock market gurus and big funds that are successful usually try to exploit this mob type mentality.
You're recognizing it right now!
Previous threads on this:
https://www.marketforum.com/forum/topic/91184/
This is not to reconcile previous forecasts with reality but because when we start new threads here about ongoing topics(including mine), I almost always provide the link(s) to the previous discussion(s) which contain tremendous amounts of information which allows readers to gain perspective on the topic.
Price charts:
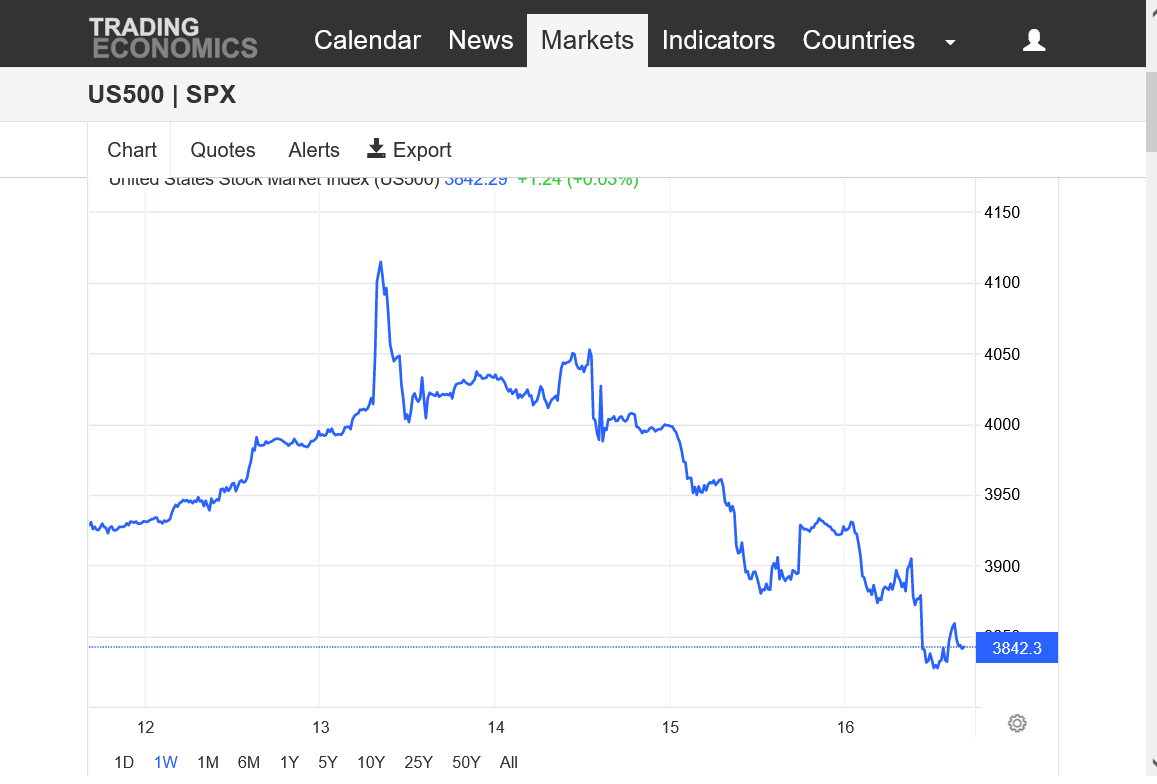
1. 1 week
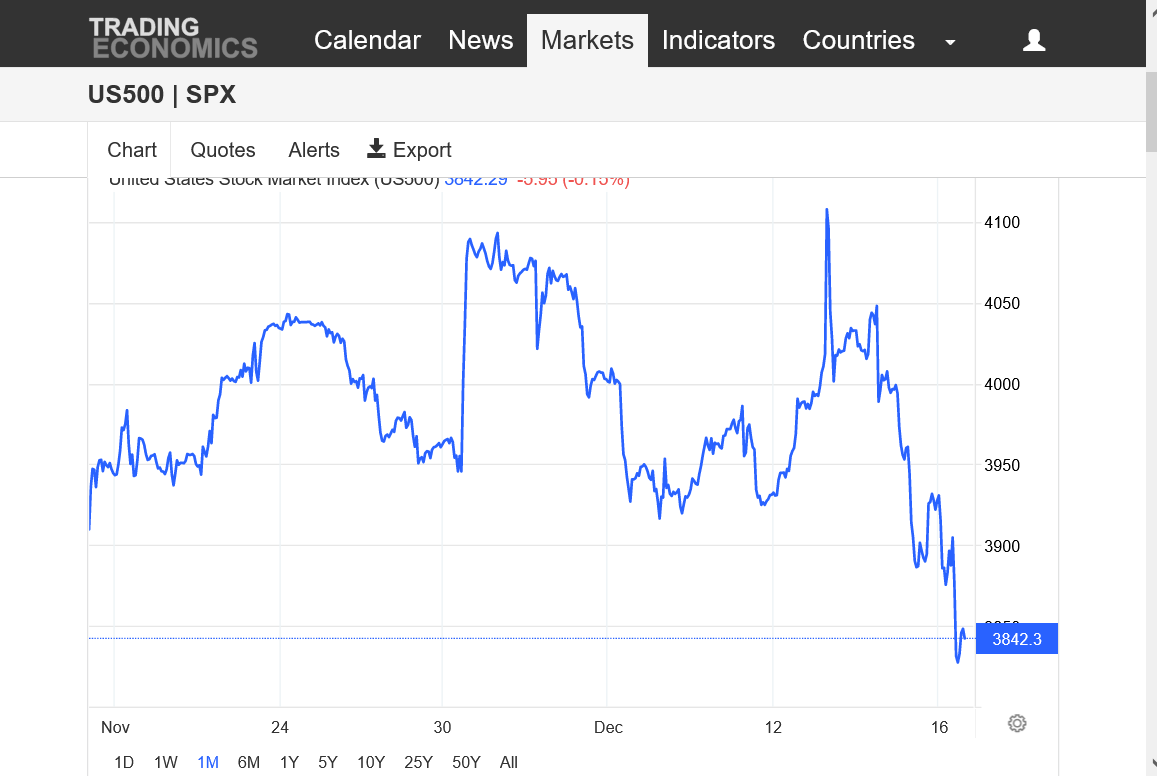
2. 1 month
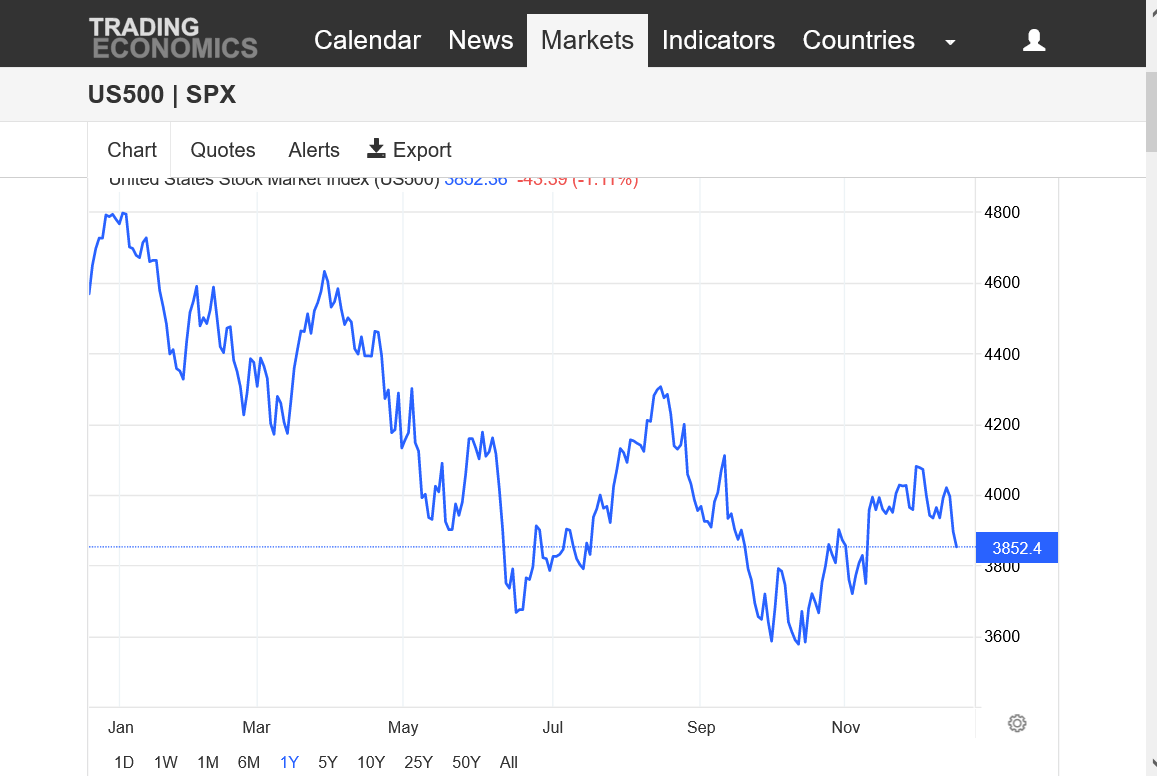
3. 1 year
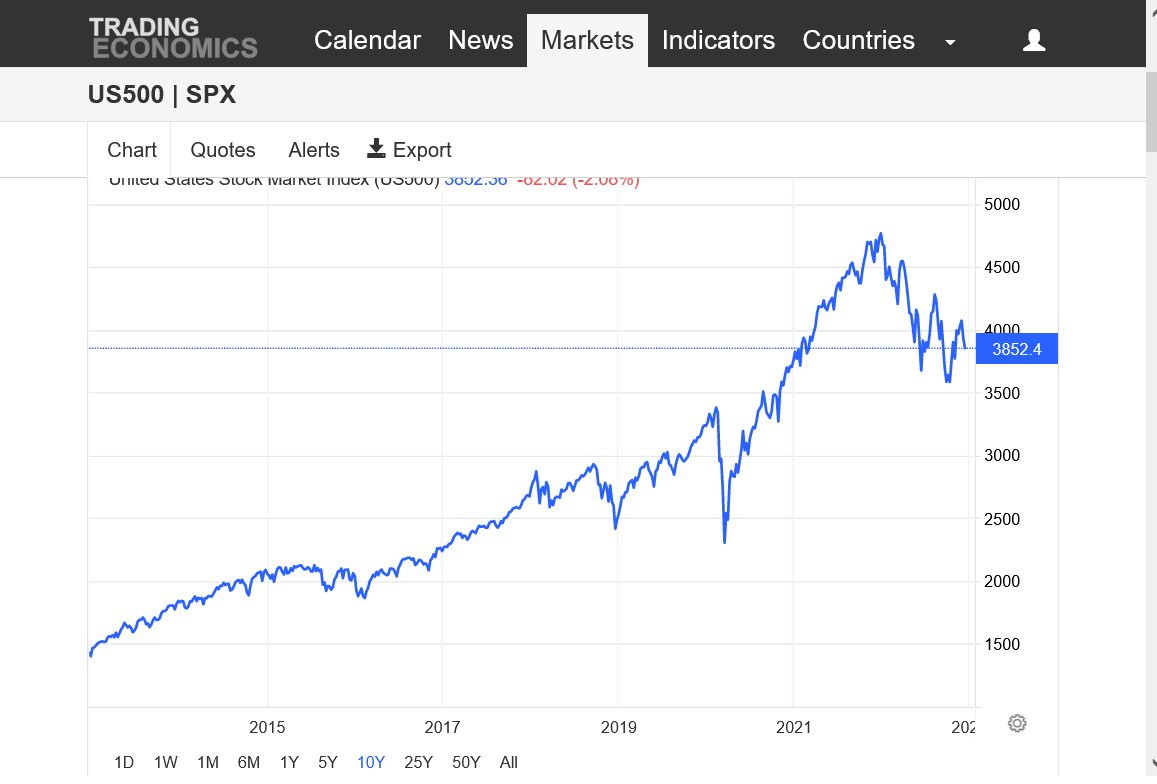
4. 10 years
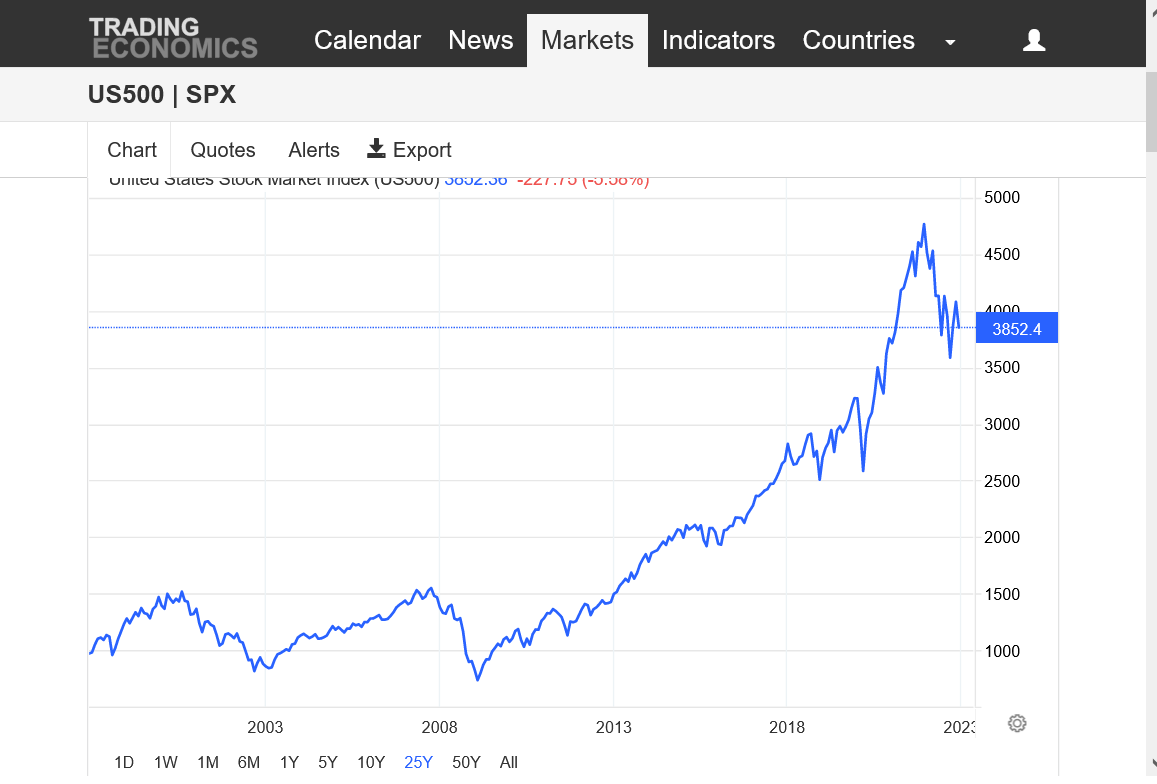
5. 25 years
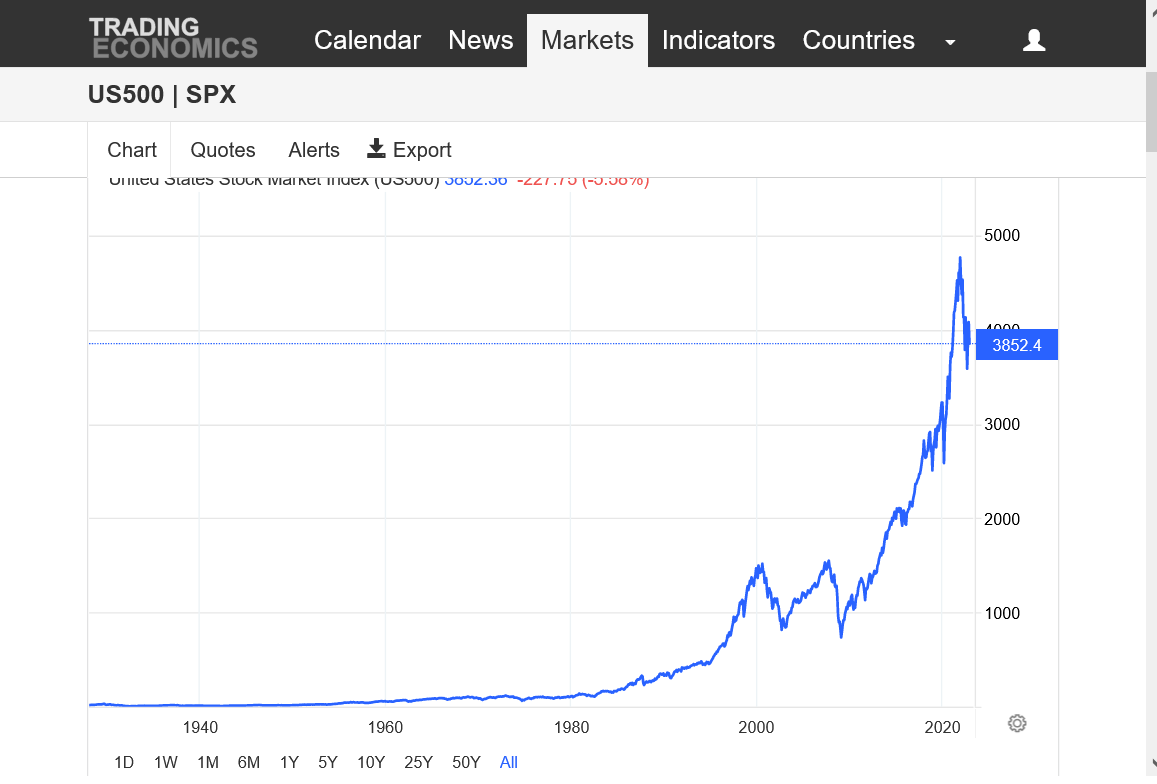
6. Forever (-:
https://tradingeconomics.com/spx:ind
Last week: spike up on Tuesday, met with heavy selling that continued in waves the rest of the week. At least 5 pauses/wedges/bear flags(dead cat bounces) that were broken to the downside with strong selling surges to new daily lows. Extremely bearish.
1 month: Double top, then collapsing to new lows for this period. Also, false upside break out to the spike new highs above the previous high this past Tuesday.
1 year: Strong downtrend with numerous bear flags breaking to the downside until July. Then some strength started showing up with a potential bottom but that was met with selling that took us to new lows which looked like a false downside breakout when we recovered about the previous lows during the time frame that joj was astutely recognizing and reporting on the market mentality of this significant technical formation.
This leaves us in technical limbo and guessing what comes next.
We failed to take out the August highs before turning lower this week........this means the trend is still DOWN and currently, this is looking like another bear flag/pennant.
If the July lows hold, its a potentiol inverted head and shoulders bottom formation. The OCTOBER lows MUST hold because new yearly lows would MAXIMIZE the bearish interpretation.
10 Years: Very major, classical parabolic spike higher, where the trend accelerates higher and higher with a steeping curve that can never be sustained forever..........until the buying is finally exhausted at the top(which is always impossible to predict, timing-wise). Several bear flags. This could be another one. Breaking the July lows, then October lows are the next targets if thats the case
25 years: same interpretation as 10 years above but maybe even more obvious.
90 years: Same interpretation as the previous 2 but the exponential/parabolic, unsustainable move higher is even more impressive.
Also apparent is a formation very similar to this, now in its early stages with a spike high in 2000, then very long pause for 13 years(with sideways trading prices 2000-2013) which finally broke out in 2013, above 1500 and resumed the accelerating uptrend.
The drop in stock prices this year looks like a blip on the 90 year chart. Using a chart with a periodicity this long to trade stocks is counterproductive.
The user assumes that stocks will keep going higher, all they need to do is hold on long enough. People buying this in 2000 were proven right......13+ years later. This is really bad positive reinforcement.
Let's use some common sense. Are all the companies in the stock market worth 3 times more than what they were 10 years ago?
Look at and recognize what this chart REALLY shows. An extreme, unsustainable parabolic move higher not based on legit value but on emotions and people dumping more and more money into it despite that.
This could just be a correction or we could just trade sideways or even make new highs if people decide to feed on each other again, dumping money into something that's massively overvalued.
If that's the case, the best time to get long is when the market is surging higher, like it did from 2013 to late 2021, not trying to pick bottoms when its correcting which has extreme downside risk.....based only on these charts.
However, the economy/news and interpretation of it controls how people think and act with their money in todays world.
You can make up all sorts of things that people will believe and create a mob mentality that feeds on/reinforces itself. This is what causes emotional, parabolic moves higher like the one here in the stock market.
If/when the exaggerated/manufactured reality that fed the psychological element is reconciled with the authentic reality...........you don't want to oppose the reconciliation response!
the stock market was higher (by some measures) than at any other time in the last 140 years. when you reach that kind of extreme, you Don't just have a one year, 20% drop, and then start a new long term bull market.
i expect that stocks will go sideways for 10 years or so.
armstrong has a comment about how interest rates will go higher than what most people expect. this should prevent any more big rallies at this time.
this tells me the rally from late sept to late nov was not the start of a big new bull.
on the other hand, bearish sentiment does look rather extreme. that is often where markets decide to turn up.
Mike,
You raise a lot of interesting points on the psychology of the crowd when it comes to trading/investing.
The whole banking system rests on people's faith in it.
Reserve requirements are 10 percent I think. A bank that holds 20 % would be considered ultra-conservative. And even that would collapse if the crowd ran for their money in mass psychosis.
As FDR said, we have nothing to fear but fear itself.
Bear, I'm inclined to agree with you on the unlikelihood of a new bull market emerging. On the other hand, I thought the same thing when the housing bubble burst in 2008. We had a 70-year run with ever-higher housing prices and a bubble that burst surely cannot be corrected within 1-2 years. I was wrong!! Housing did recover and I missed a great opportunity. Markets can be very humbling.
i could sense when the housing market was turning because of some land prices. here is a strange and wild swing... i knew a guy who bought some land outside casa grande, az for about 1k per acre in 2002. a 40 acre plot. by 2007, someone offered him 23k per acre. i screamed... sell... sell...sell... i don't think he did, he wanted a higher price. then things crashed. (this is one hour from phoenix, and one hour from tucson).
by 2010 i saw a piece of land here locally, that had been abandoned by a developer. a local told me i could get it for 5 grand per acre. (but for 100 acres, i did not have that kind of cash). that was a steal, since it had been 25k per acre just a couple years before. i was asking family members if they all wanted to go in together to buy a smaller lot for 5 grand per acre. no takers. more than a year ago, i heard some local farmers tell me that those areas are now going for between 50-75 grand per acre. (for development).
but it now looks like the top is in, and i am not sure how much things may drop this time.
since the long term bull in bonds is most like finished, i don't think we will see those kinds of huge rises again any time soon. but i have been wrong before.
In 2006 a friend of mine bought a place in NYC (I don't recall the price). What had me shaking my head was that the mortgage was a "No income loan." What the H...? The absurdity lasted another 2 years before it all popped. The point being summed up in the oft said quote, "Markets can remain insane longer than one can remain solvent." If I had played the short side when I came to know this flaw underneath the surface I would have had my head handed to me. It did at least keep me from buying.
Great example, joj.
it’s why trying to pick the exact top in a bubble, parabolic market(commodities especially) or even classical markets putting in a major top/picking the bottom has been called “catching a falling knife”
https://www.thebalancemoney.com/what-does-catching-a-falling-knife-mean-1344945