KEY EVENTS TO WATCH FOR:
Wednesday, December 21, 2022
7:00 PM ET. MBA Weekly Mortgage Applications Survey
Composite Idx (previous 210.7)
Composite Idx, W/W% (previous +3.2%)
Purchase Idx-SA (previous 182.6)
Purchase Idx-SA, W/W% (previous +4.0%)
Refinance Idx (previous 350.5)
Refinance Idx, W/W% (previous +2.8%)
8:30 AM ET. 3rd Quarter International Transactions
Current Account (USD) (previous -251.09B)
10:00 AM ET. November Existing Home Sales
Existing Sales (previous 4.43M)
Existing Sales, M/M% (previous -5.9%)
Unsold Homes Month's Supply (previous 3.3)
Median Price (USD) (previous 379100)
Median Home Price, Y/Y% (previous +6.6%)
10:00 AM ET. December Consumer Confidence Index
Cons Conf Idx (previous 100.2)
Expectation Idx
Present Situation Idx (previous 137.4)
10:30 AM ET. EIA Weekly Petroleum Status Report
Crude Oil Stocks (Bbl) (previous 424.129M)
Crude Oil Stocks, Net Chg (Bbl) (previous +10.231M)
Gasoline Stocks (Bbl) (previous 223.583M)
Gasoline Stocks, Net Chg (Bbl) (previous +4.496M)
Distillate Stocks (Bbl) (previous 120.171M)
Distillate Stocks, Net Chg (Bbl) (previous +1.364M)
Refinery Usage (previous 92.2%)
Total Prod Supplied (Bbl/day) (previous 19.956M)
Total Prod Supplied, Net Chg (Bbl/day) (previous +0.33M)
Thursday, December 22, 2022
8:30 AM ET. U.S. Weekly Export Sales
8:30 AM ET. Unemployment Insurance Weekly Claims Report - Initial Claims
Jobless Claims (previous 211K)
Jobless Claims, Net Chg (previous -20K)
Continuing Claims (previous 1671000)
Continuing Claims, Net Chg (previous +1K)
8:30 AM ET. November CFNAI Chicago Fed National Activity Index
NAI (previous -0.05)
NAI, 3-mo Moving Avg (previous 0.09)
8:30 AM ET. 3rd Quarter Revised Corporate Profits
8:30 AM ET. 3rd Quarter 3rd estimate GDP
Annual Rate, Q/Q% (previous +2.9%)
Chain-Weighted Price Idx, Q/Q% (previous +4.3%)
Corporate Profits, Q/Q%
PCE Price Idx, Q/Q% (previous +4.3%)
Purchase Price Idx, Q/Q% (previous +4.7%)
Real Final Sales, Q/Q% (previous +4%)
Core PCE Price Idx, Ex-Food/Energy, Q/Q% (previous +4.6%)
Personal Consumption, Q/Q% (previous +1.7%)
10:00 AM ET. November Leading Indicators
Leading Index, M/M% (previous -0.8%)
Leading Index
Coincident Index, M/M% (previous +0.2%)
Lagging Index, M/M% (previous +0.1%)
10:30 AM ET. EIA Weekly Natural Gas Storage Report
Working Gas In Storage (Cbf) (previous 3412B)
Working Gas In Storage, Net Chg (Cbf) (previous -50B)
11:00 AM ET. Dec. Federal Reserve Bank of Kansas City Survey of Tenth District Manufacturing
Mfg Activity Idx (previous -10)
6-Mo Exp Prod Idx (previous 6)
Mfg Composite Idx (previous -6)
6-Mo Exp Composite Idx (previous 0)
4:30 PM ET. Foreign Central Bank Holdings
4:30 PM ET. Federal Discount Window Borrowings
Friday, December 23, 2022
8:30 AM ET. November Personal Income & Outlays
Personal Income, M/M% (previous +0.7%)
Consumer Spending, M/M% (previous +0.8%)
PCE Price Idx, M/M% (previous +0.3%)
PCE Price Idx, Y/Y% (previous +6%)
PCE Core Price Idx, M/M% (previous +0.2%)
PCE Core Price Idx, Y/Y% (previous +5%)
8:30 AM ET. November Advance Report on Durable Goods
Durable Goods-SA, M/M% (previous +1.0%)
Dur Goods, Ex-Defense, M/M% (previous +0.8%)
Dur Goods, Ex-Transport, M/M% (previous +0.5%)
Orders: Cap Gds, Non-Def, Ex-Air, M/M%(previous +0.7%)
Shipmnts: Cap Gds, Non-Def, Ex-Air, M/M% (previous +1.3%)
10:00 AM ET. November New Residential Sales
New Home Sales (previous 632K)
New Home Sales, M/M% (previous +7.5%)
New Home Sales Months Supply (previous 8.9)
10:00 AM ET. 3rd Quarter GDP by State
10:00 AM ET. 3rd Quarter State Quarterly Personal Income
10:00 AM ET. December University of Michigan Survey of Consumers - final
End-Mo Sentiment Idx (previous 56.8)
End-Mo Expectations Idx (previous 55.6)
12-Month Inflation Forecast (previous 4.9%)
5-Year Inflation Forecast (previous 3.0%)
End-Mo Current Idx (previous 58.8)
The STOCK INDEXES? http://quotes.ino.com/ex?changes/?c=indexes
The Dow posted an inside day with a higher close on Tuesday as it consolidated some of the decline off last-Tuesday's high. The mid-range close sets the stage for a steady to higher opening when Wednesday's night session begins trading. Stochastics and the RSI are oversold but remain neutral to bearish signaling that sideways to lower prices are possible near-term. Closes below the 50-day moving average crossing at 32,726.09 would open the door for a possible test of November's low crossing at 31,727.05. Closes above the 20-day moving average crossing at 33,799.15 would signal that a short-term low has been posted. First resistance is the 10-day moving average crossing at 33,468.07. Second resistance is the 20-day moving average crossing at 33,798.80. First support is the 50-day moving average crossing at 32,726.00. Second support is November's low crossing at 31,727.050.
The March NASDAQ 100 closed lower for a fifth-day in a row on Tuesday as it extends the decline off last-Tuesday's high. The high-range close sets the stage for a steady to slightly lower opening when Wednesday's night session begins trading. Stochastics and the RSI are oversold but remain neutral to bearish signaling sideways to lower prices are possible. If March extends the aforementioned decline, the November 9th low crossing at 10,932.75 is the next downside target. Closes above the 20-day moving average crossing at 11,753.86 would signal that a short-term low has been posted. First resistance is the 50-day moving average crossing at 11,550.64. Second resistance is the 20-day moving average crossing at 11,753.86. First support is the November 9th low crossing at 10,932.75. Second support is November's low crossing at 10,746.75.
The March S&P 500 closed slightly higher on Tuesday as it consolidates some of the decline off last-Tuesday's high. The high-range close sets the stage for a steady to slightly higher opening when Tuesday's night session begins trading. Stochastics and the RSI are oversold but remain neutral to bearish signaling that sideways to lower prices are possible near-term. If March extends the aforementioned decline, the November 9th low crossing at 3782.75 is the next downside target. Closes above the 20-day moving average crossing at 4003.62 would confirm that a short-term low has been posted. First resistance is the 50-day moving average crossing at 3910.28. Second resistance is the 20-day moving average crossing at 4003.62. First support is the November 9th low crossing at 3782.75. Second support is November's low crossing at 3735.00.
INTEREST RATES? http://quotes.ino.com/ex?changes/?c=interest ""
March T-bonds closed down 1-25-pts. at 128-00.
March T-bonds closed lower for the third day in a row on Tuesday and closed below the 20-day moving average crossing at 129-11 signaling that a short-term top has been posted. The low-range close sets the stage for a steady to lower opening when Wednesday's night session begins trading. Stochastics and the RSI have turned neutral to bearish signaling that sideways to lower prices are possible near-term. If March resumes the rally off November's low, the 62% retracement level of the August-November decline crossing at 133-30 is the next upside target. First resistance is last-Thursday's high crossing at 132-15. Second resistance is the 62% retracement level of the August-October decline crossing at 133-30. First support is the November 30th low crossing at 126-00. Second support is the 50-day moving average crossing at 125.00.
March T-notes closed down 215-pts. at 113.150.
March T-notes closed lower on Tuesday and below the 20-day moving average crossing at 114,017 signaling that a short-term top has been posted. The low-range close sets the stage for a steady to lower opening when Wednesday's night session begins trading. Stochastics and the RSI have turned neutral to bearish signaling that sideways to lower prices are possible near-term. If March extends the decline off last-Tuesday's high, the 50-day moving average crossing at 112.136 is the next downside target. If March renews the rally off October's low, the 62% retracement level of the August-November decline crossing at 116.232 is the next upside target. First resistance is the 50% retracement of the August-October decline crossing at 115.090. Second resistance is the 62% retracement of the August-October decline crossing at 116.232. First support is the 50-day moving average crossing at 112.136. Second support is the November 14th low crossing at 112.055.
ENERGY MARKETS? http://quotes.ino.com/ex?changes/?c=energy ""
February crude oil closed higher on Tuesday. The high-range close sets the stage for a steady to higher opening when Wednesday's night session begins. Stochastics and the RSI are turning neutral to bullish signaling that sideways to higher prices are possible near-term. Closes above last-Thursday's high crossing at $77.83 would signal that a short-term low has been posted. If February renews the decline off November's high, the 62% retracement level of the 2020-2022 rally crossing at $63.10 is the next downside target. First resistance is last-Thursday's high crossing at $77.83. Second resistance is the 50-day moving average crossing at $81.13. First support is the December 9thlow crossing at $70.31. Second support is the 62% retracement level of the 2020-2022 rally crossing at $63.10.
February heating oil closed slightly higher on Tuesday as it consolidates some of the decline off last-Thursday's high. The mid-range close sets the stage for a steady to higher opening when Wednesday's night trading session begins. Stochastics and the RSI are neutral to bearish signaling that sideways to lower prices are possible near-term. Closes below the 10-day moving average crossing at $2.9948 would signal that a short-term top has been posted. If February renews the rally off the December 9th low, the 50-day moving average crossing at $3.2641 is the next upside target. First resistance is the 50-day moving average crossing at $3.2641. Second resistance is the November 15th high crossing at $3.4722. First support is the 10-day moving average crossing at $3.9948. Second support is the December 9th low crossing at $2.7517.
February unleaded gas closed higher on Tuesday. The high-range close sets the stage for a steady to higher opening when Wednesday's night session begins trading. Stochastics and the RSI are turning neutral to bullish signaling that sideways to higher prices are possible near-term. Closes above last-Wednesday's high crossing at $2.2613 would signal that a short-term low has been posted while opening the door for additional gains near-term. If February renews the decline off November's high, the 50% retracement level of the 2020-2022 rally crossing at 1.9539 is the next downside target. First resistance is last-Wednesday's high crossing at $2.2613. Second resistance is the 50-day moving average crossing at $2.3616. First support is the December 12th low crossing at $2.0321. Second support is the 50% retracement level of the 2020-2022 rally crossing at 1.9539.
February Henry natural gas closed sharply lower on Tuesday as it renewed the decline off November's high. The low-range close sets the stage for a steady to lower opening when Wednesday's night session begins trading. Stochastics and the RSI have turned neutral to bearish signaling that sideways to lower prices are possible near-term. If February extends the aforementioned decline, the 75% retracement level of the 2020-2022 rally crossing at 5.256 is the next downside target. Closes above the 20-day moving average crossing at 6.355 would signal that a short-term low has been posted. First resistance is the 10-day moving average crossing at 6.073. Second resistance is the 20-day moving average crossing at 6.355. First support is today's low crossing at 5.167. Second support is the 75% retracement level of the 2020-2022 rally crossing at 5.256.
CURRENCIES? http://quotes.ino.com/ex?changes/?c=currencies ""
The March Dollar closed lower on Tuesday. The low-range close sets the stage for a steady to lower opening when Wednesday's nights session begins trading. Stochastics and the RSI are neutral to bullish signaling that sideways to higher prices are possible near-term. Closes above the 20-day moving average crossing at 104.777 would signal that a short-term low has been posted. If March extends the decline off September's high, the 75% retracement level of the January-September rally crossing at $101.331 is the next downside target. First resistance is the 20-day moving average crossing at 104.777. Second resistance is the November 30thhigh crossing at 106.775. First support is last- Thursday's low crossing at $102.875. Second support is 75% retracement level of the January-September rally crossing at $101.331.
The March Euro closed slightly higher on Tuesday. The mid-range close sets the stage for a steady to higher opening when Wednesday's night session begins trading. Stochastics and the RSI are turning neutral to bearish signaling that sideways to lower prices are possible near-term. Closes below the 20-day moving average crossing at 1.05821 would signal that a short-term top has been posted. If March extends the rally off September's low, the March 31st high crossing at $1.09680 is the next upside target. First resistance is the 25% retracement level of the 2018-2022 decline crossing at $1.07982. Second resistance is the March 31st high crossing at $1.09680. First support is the 20-day moving average crossing at $1.05821. Second support is the November 30th low crossing at $1.03715.
The March British Pound closed higher on Tuesday as it consolidates some of the decline off last-Wednesday's high. The mid-range close sets the stage for a steady to higher opening when Wednesday's night session begins trading. Stochastics and the RSI are neutral to bearish signaling sideways to lower prices are possible near-term. Closes below the 20-day moving average crossing at 1.2199 would confirm that a short-term top has been posted. If March renews the rally off September's low, the 62% retracement level of the May-September decline crossing at 1.2770 is the next upside target. First resistance is last-Wednesday's high crossing at 1.2479. Second resistance is the 62% retracement level of the May-September decline crossing at 1.2770. First support is the 20-day moving average crossing at 1.2199. Second support is the November 30th low crossing at 1.1937.
The March Swiss Franc closed higher on Tuesday as it consolidates some of the correction off last-Wednesday's high. The high-range close sets the stage for a steady to higher opening when Wednesday's night session begins trading. Stochastics and the RSI are turning neutral to bullish signaling that sideways to higher prices are possible near-term. If March extends the rally off November's low, the 62% retracement level of the 2018-2022 decline crossing at 1.10351 is the next upside target. Closes below the 20-day moving average crossing at 1.07814 would signal that a short-term top has been posted. First resistance is last-Wednesday's high crossing at 1.09665. Second resistance is the 62% retracement level of the 2018-2022 decline crossing at 1.10351. First support is the 20-day moving average crossing at 1.07814. Second support is the November 30th low crossing at 1.06060.
The March Canadian Dollar closed higher on Tuesday as it extended the trading range of the past three-weeks. The high-range close sets the stage for a steady to higher opening when Wednesday's night session begins trading. Stochastics and the RSI are oversold but remain neutral to bearish signaling that sideways to lower prices are possible near-term. If March renews the decline off November's high, the November 3rd low crossing at 72.58 is the next downside target. Closes above the 20-day moving average crossing at 73.90 would confirm that a short-term low has been posted. First resistance is the December 5th high crossing at 74.82. Second resistance is the November 25thhigh crossing at 75.16. First support is last-Friday's low crossing at 73.04. Second support is the November 3rd low crossing at 72.58.
The March Japanese Yen closed sharply higher on Tuesday as it renewed the rally off October's low. The high-range close sets the stage for a steady to higher opening when Wednesday’s night session begins trading. Stochastics and the RSI are turning neutral to bullish signaling that sideways to higher prices are possible near-term. If March extends the rally off October's low, August's high crossing at 0.078135 is the next upside target. Closes below last-Thursday's low crossing at 0.073210 would signal that a short-term top has been posted. First resistance is today's high crossing at 0.077470. Second resistance is August's high crossing at 0.078135. First support is last-Thursday's low crossing at 0.073210. Second support is the November 30th low crossing at 0.072510.
PRECIOUS METALS? http://quotes.ino.com/ex?changes/?c=metals ""
February gold closed sharply higher on Tuesday and the high-range close sets the stage for a steady to higher opening when Wednesday's night session begins trading. Stochastics and the RSI are turning neutral to bullish signaling that sideways to higher prices are possible near-term. If February renews the rally off November's low, the 50% retracement level of the March-October decline crossing at $1861.40 is the next upside target. Closes below the 20-day moving average crossing at $1790.60 would signal that a short-term top has been posted while opening the door for additional weakness near-term. First resistance is last-Tuesday's high crossing at $1836.90. Second resistance is the 50% retracement level of the March-October decline crossing at $1861.40. First support is the 20-day moving average crossing at $1790.60. Second support is the November 23rd low crossing at $1733.50.
March silver closed sharply higher on Tuesday as it extends the rally off September's low. The high-range close sets the stage for a steady to higher opening when Wednesday's night session begins trading. Stochastics and the RSI are turning neutral to bullish signaling that sideways to higher prices are possible near-term. If March extends the rally off October's low, the 75% retracement level of the March-August decline crossing at 24.779 is the next upside target. Closes below the 20-day moving average crossing at 22.762 would confirm that a short-term top has been posted while opening the door for additional weakness near-term. First resistance is today's high crossing at 24.490. Second resistance is the 75% retracement level of the March-September decline crossing at 24.779. First support is the 20-day moving average crossing at 22.762. Second resistance is the December 6th low crossing at 22.190.
March copper closed higher on Tuesday. The high-range close sets the stage for a steady to higher opening when Wednesday's night session begins trading. Stochastics and the RSI are neutral to bearish signaling that sideways to lower prices are possible near-term. Closes below the 20-day moving average crossing at 3.7696 would signal that a short-term top has been posted. If March renews the rally off September's low, the 50% retracement level of the March-July decline crossing at 4.0343 is the next upside target. First resistance is November's high crossing at 3.9470. Second resistance is the 50% retracement level of the March-July decline crossing at 4.0343. First support is the 20-day moving average crossing at 3.7696. Second support is the 50-day moving average crossing at 3.6309.
GRAINS? http://quotes.ino.com/ex?changes/?c=grains "
March Corn closed down $0.04 3/4-cents at $6.52.
March corn closed higher on Tuesday. The high-range close sets the stage for a steady to higher opening when Wednesday's night session begins trading. Stochastics and the RSI are poised to turn neutral to bullish with additional strength on Wednesday that would signaling that sideways to higher prices are possible near-term. Closes above last-Tuesday's high crossing at $6.60 would signal that a short-term low has been posted while opening the door for additional gains near-term. If March renews the decline off October's high, the 62% retracement level of the July-October rally crossing at $6.23 is the next downside target. First resistance is last-Tuesday's high crossing at $6.60. Second resistance is the 50-day moving average crossing at $6.71 1/2. First support is the December 7th low crossing at $6.35. Second support is the 62% retracement level of the July-October rally crossing at $6.23.
March wheat closed up $0.01 1/4-cents at $7.49 3/4.
March wheat closed higher on Tuesday as it extends the trading range of the past two-weeks. The low-range close sets the stage for a steady to lower opening when Wednesday's night session begins trading. Stochastics and the RSI are neutral to bullish signaling that sideways to higher prices are possible near-term. Closes above the 20-day moving average crossing at $7.64 would signal that a short-term low has been posted while opening the door for additional gains near-term. If March renews the decline off October's high, the September 9, 2021 low crossing at $6.94 is the next downside target. First resistance is the 20-day moving average crossing at $7.64. Second resistance is the 50-day moving average crossing at $8.22. First support is the 75% retracement level of the 2018-2022 rally crossing at $7.24 1/4. Second support is the September 9, 2021 low crossing at $6.94.
March Kansas City Wheat closed up $0.02 1/2-cents at $8.46.
March Kansas City wheat closed higher on Tuesday. The low-range close sets the stage for a steady to lower opening when Wednesday's night session begins trading. Stochastics and the RSI are neutral signaling that sideways trading is possible near-term. Closes above the December 13th high crossing at $8.79 1/4 would confirm that a short-term low has been posted. If March renews the decline off October's high, August's low crossing at $8.18 3/4 is the next downside target. First resistance is the December 12th high crossing at $8.79 1/4. Second resistance is the 50-day moving average crossing at $9.14 1/2. First support is the December 6th low crossing at $8.21 3/4. Second support is August's low crossing at $8.18 3/4.
March Minneapolis wheat closed up $0.07 3/4-cents at $9.16.
March Minneapolis wheat closed higher on Tuesday. The mid-range close sets the stage for a steady to higher opening when Wednesday's night session begins trading. Stochastics and the RSI are turning neutral to bullish signaling that sideways to higher prices are possible near-term. Closes above the December 13th high crossing at $9.32 would signal that a short-term low has been posted. If March renews the decline off November's high, August's low crossing at $8.75 3/4 is the next downside target. First resistance is the December 13th high crossing at $9.32. Second resistance is the 50-day moving average crossing at $9.48 3/4. First support is the December 6th low crossing at $8.90. Second support is the August's low crossing at $8.75 3/4.
SOYBEAN COMPLEX? http://quotes.ino.com/ex?changes/?c=grains "
March soybeans closed up $0.16 1/4-cents at $14.79 3/4.
March soybeans closed higher on Tuesday. The high-range close sets the stage for a steady to higher opening when Wednesday's night trade begins. Stochastics and the RSI are neutral signaling that sideways trading is possible near-term. Closes below the 20-day moving average crossing at $14.65 1/4 would signal that a short-term top has been posted while opening the door for additional weakness near-term. If March renews the rally off October's low, September's high crossing at $15.08 is the next upside target. First resistance is the December 9th high crossing at $14.97 1/4. Second resistance is September's high crossing at $15.08. First support is the 20-day moving average crossing at $14.65 1/4. Second support is the 50-day moving average crossing at $14.41 1/2.
March soybean meal closed down $3.20 at $449.30.
March soybean meal posted an inside day with a higher close on Tuesday. The low-range close sets the stage for a steady to slightly higher opening when Wednesday's night session begins trading. Stochastics and the RSI are turning neutral to bearish signaling that sideways to lower prices are possible near-term. If March extends this month's decline, the 25% retracement level of the 2021-2022 rally crossing at $432.40 is the next downside target. If March renews the rally off October's low, monthly resistance on the continuation chart crossing at $478.60 is the next upside target. First resistance is the December 9th high crossing at $469.30. Second resistance is monthly resistance crossing at $478.60. First support is Monday's low crossing at $443.40. Second support is the 25% retracement level of the 2021-2022 rally crossing at $432.40.
March soybean oil closed up 140-pts. At 64.81.
March soybean oil closed higher on Tuesday as it extends the rally off December's low. The high-range close sets the stage for a steady to higher opening when Wednesday's night session begins trading. Stochastics and the RSI are neutral to bullish signaling that sideways to higher prices are possible near-term. Closes above the 20-day moving average crossing at 64.91 would confirm that a short-term low has been posted. If March renews the decline off November's high, the 87% retracement level of the July-November rally crossing at 56.49 is the next downside target. First resistance is the 20-day moving average crossing at 64.91. First support is the 75% retracement level of the July-November rally crossing at 58.84. Second support is the 87% retracement level of the July-November rally crossing at 56.49.
LIVESTOCKhttp://quotes.ino.com/exchanges/?c=livestock
February hogs closed down $1.42 at $84.27.
February hogs closed lower on Tuesday as it consolidated some of last-Friday's rally. The low-range close sets the stage for a steady to lower opening when Wednesday's session begins trading. Stochastics and the RSI are turning neutral to bullish signaling that sideways to higher prices are possible near-term. Closes above the 50-day moving average crossing at $87.28 would signal that a short-term low has been posted. If February renews the decline off November's high, the 75% retracement level of the October rally crossing at $80.25 is the next downside target. First resistance is the 20-day moving average crossing at $86.16 Second resistance is the 50-day moving average crossing at $87.28. First support is last-Thursday's low crossing at $81.53. Second support is the 75% retracement level of the October rally crossing at $80.25.
February cattle closed down $0.45 at $155.60.
February cattle closed lower on Tuesday. The mid-range close sets the stage for a steady to lower opening on Wednesday. Stochastics and the RSI are neutral to bullish signaling that sideways to higher prices are possible near-term. If February renews this month's rally. November's high crossing at $156.95 is the next upside target. Closes below the 50-day moving average crossing at $154.83 would signal that a short-term top has been posted. First resistance is last-Tuesday's high crossing at $156.78. Second resistance is November's high crossing at $156.95. First support is the 50-day moving average crossing at $154.83. Second support is the December 7th low crossing at $152.75.
March Feeder cattle closed up $1.20 at $185.00.
March Feeder cattle posted a key reversal up as it closed higher on Tuesday while extending this month's trading range. The high-range close sets the stage for a steady to higher opening when Wednesday's session begins trading. Stochastics and the RSI have turned neutral to bearish signaling that sideways to lower prices are possible near-term. Closes below the 50-day moving average crossing at $182.47 would confirm that a short-term top has been posted while opening the door for additional weakness near-term. If March renews the rally off the November 28th low, the 75% retracement level of the August-October decline crossing at $188.29 is the next upside target. First resistance is the 62% retracement level of the August-October decline crossing at $185.98. Second resistance is the 75% retracement level of the August-October decline crossing at $188.29. First support is the 50-day moving average crossing at $182.47. Second support is the November 28th low crossing at $180.27.
FOOD & FIBERhttp://quotes.ino.com/ex changes/?c=food
March coffee closed higher on Tuesday. The mid-range close sets the stage for a steady to higher opening on Wednesday. Stochastics and the RSI are turning neutral to bearish signaling sideways to lower prices are possible near-term. If March renews the decline off August's high, November's low crossing at $15.41 is the next downside target. Closes above the 50-day moving average crossing at $17.14 would open the door for additional gains near-term. First resistance is the 50-day moving average crossing at $17.14. Second resistance is November's high crossing at $17.82. First support is November's low crossing at $15.41. Second support is the 75% retracement level of the 2020-2022 rally crossing at $14.74.
March cocoa closed slightly lower on Tuesday. The low-range close sets the stage for a steady to lower opening on Wednesday. Stochastics and the RSI are neutral to bearish signaling sideways to lower prices are possible near-term. Closes below last-Friday's low crossing at 24.68 would signal that a short-term top has been posted while opening the door for additional weakness near-term. If March resumes the rally off the November 23rd low, November's high crossing at 25.77 is the next upside target.
March sugar closed higher on Tuesday. The high-range close sets the stage for a steady to higher opening on Tuesday. Stochastics and the RSI have turned neutral to bullish signaling that sideways to higher prices are possible near-term. If March extends the rally off September's low, monthly resistance on the monthly continuation chart crossing at 22.64 is the next upside target. Closes below the 20-day moving average crossing at 19.71 would signal that a short-term top has been posted.
March cotton closed sharply higher on Tuesday and posted a new high for the month. The high-range close sets the stage for a steady to higher opening on Wednesday. Stochastics and the RSI are neutral to bullish signaling that sideways to higher prices are possible near-term. If March renews the rally off October's low, November's high crossing at 89.92 is the next upside target. Closes below the 50-day moving average crossing at 81.69 would signal that a short-term top has been posted.
Thanks Tallpine!!
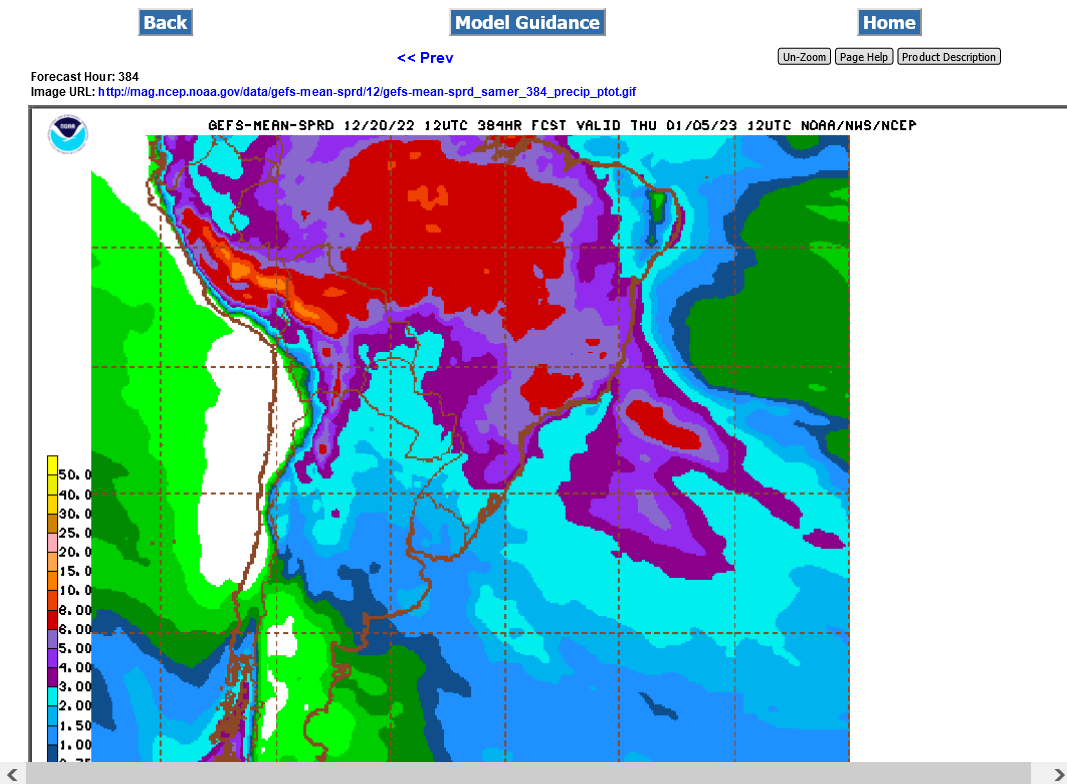
It may be hard to tell but forecasted rain amounts have fallen a bit this week in Argentina as we've been saying since Monday early afternoon.
Last 12z GEFS: