KEY EVENTS TO WATCH FOR:
Friday, December 23, 2022
8:30 AM ET. November Personal Income & Outlays
Personal Income, M/M% (previous +0.7%)
Consumer Spending, M/M% (previous +0.8%)
PCE Price Idx, M/M% (previous +0.3%)
PCE Price Idx, Y/Y% (previous +6%)
PCE Core Price Idx, M/M% (previous +0.2%)
PCE Core Price Idx, Y/Y% (previous +5%)
8:30 AM ET. November Advance Report on Durable Goods
Durable Goods-SA, M/M% (previous +1.0%)
Dur Goods, Ex-Defense, M/M% (previous +0.8%)
Dur Goods, Ex-Transport, M/M% (previous +0.5%)
Orders: Cap Gds, Non-Def, Ex-Air, M/M%(previous +0.7%)
Shipmnts: Cap Gds, Non-Def, Ex-Air, M/M% (previous +1.3%)
10:00 AM ET. November New Residential Sales
New Home Sales (previous 632K)
New Home Sales, M/M% (previous +7.5%)
New Home Sales Months Supply (previous 8.9)
10:00 AM ET. 3rd Quarter GDP by State
10:00 AM ET. 3rd Quarter State Quarterly Personal Income
10:00 AM ET. December University of Michigan Survey of Consumers - final
End-Mo Sentiment Idx (previous 56.8)
End-Mo Expectations Idx (previous 55.6)
12-Month Inflation Forecast (previous 4.9%)
5-Year Inflation Forecast (previous 3.0%)
End-Mo Current Idx (previous 58.8)
The STOCK INDEXES? http://quotes.ino.com/ex?changes/?c=indexes
The Dow closed lower on Thursday following higher that expectedfirst-time jobless claims and another bearish estimate for third-quarter gross domestic product. Stocks came under pressure after weak quarterly results from Micron Technology. Car-Max also fell sharply as it reported consumers are starting to balk at car prices. Today's sell off extended the decline off December's high. However, the high-range close sets the stage for a steady to modestly lower opening when Friday's night session begins trading. Stochastics and the RSI are oversold but remain neutral to bearish signaling that sideways to lower prices are possible near-term. Closes below Monday's low 32,581.97 would signal a resumption of the decline off December's high while opening the door for a possible test of November's low crossing at 31,727.05. Closes above the 20-day moving average crossing at 33,690.75 would signal that a short-term low has been posted. First resistance is the 10-day moving average crossing at 33,341.86. Second resistance is the 20-day moving average crossing at 33,690.75. First support is today's low crossing at 32,573.43. Second support is November's low crossing at 31,727.050.
The March NASDAQ 100 closed sharply lower on Thursday as it renewed the decline off December's high. The low-range close sets the stage for a steady to lower opening when Friday's night session begins trading. Stochastics and the RSI are oversold but remain neutral to bearish signaling sideways to lower prices are possible. If March extends the aforementioned decline, November's low crossing at 10,746.75 is the next downside target. Closes above the 20-day moving average crossing at 11,675.01 would signal that a short-term low has been posted. First resistance is the 50-day moving average crossing at 11,558.61. Second resistance is the 20-day moving average crossing at 11,675.01. First support is today's low crossing at 10,870.50. Second support is November's low crossing at 10,746.75.
The March S&P 500 posted a key reversal down as it closed sharply lower on Thursday as it renewed the decline off December's high. The mid-range close sets the stage for a steady to lower opening when Friday's night session begins trading. Stochastics and the RSI are oversold but remain neutral to bearish signaling that sideways to lower prices are possible near-term. If March extends the aforementioned decline, the November 9th low crossing at 3782.75 is the next downside target. Closes above the 20-day moving average crossing at 3984.00 would confirm that a short-term low has been posted. First resistance is the 50-day moving average crossing at 3919.80. Second resistance is the 20-day moving average crossing at 3984.00. First support is the November 9th low crossing at 3782.75. Second support is November's low crossing at 3735.00.
INTEREST RATES? http://quotes.ino.com/ex?changes/?c=interest ""
March T-bonds closed up 2-pts. at 128-07.
March T-bonds closed higher on Thursday as it consolidated some of the decline off last-Thursday's high.The mid-range close sets the stage for a steady to higher opening when Friday's night session begins trading. Stochastics and the RSI are oversold but remain neutral to bearish signaling that sideways to lower prices are possible near-term. If March extends the decline off last-Thursday's high, the 50-day moving average crossing at 125-04 is the next downside target, If March resumes the rally off November's low, the 62% retracement level of the August-November decline crossing at 133-30 is the next upside target. First resistance is last-Thursday's high crossing at 132-15. Second resistance is the 62% retracement level of the August-October decline crossing at 133-30. First support is the November 30th low crossing at 126-00. Second support is the 50-day moving average crossing at 125.04.
March T-notes closed down 35-pts. at 113.145.
March T-notes posted an inside day with a slightly lower close on Thursday. The low-range close sets the stage for a steady to lower opening when Friday's night session begins trading. Stochastics and the RSI are oversold but remain neutral to bearish signaling that sideways to lower prices are possible near-term. If March extends the decline off last-Tuesday's high, the 50-day moving average crossing at 112.162 is the next downside target. If March renews the rally off October's low, the 62% retracement level of the August-November decline crossing at 116.232 is the next upside target. First resistance is the 50% retracement of the August-October decline crossing at 115.090. Second resistance is the 62% retracement of the August-October decline crossing at 116.232. First support is the 50-day moving average crossing at 112.162. Second support is the November 14th low crossing at 112.055.
ENERGY MARKETS? http://quotes.ino.com/ex?changes/?c=energy ""
February crude oil closed slightly lower on Thursday as it consolidated some of the rally off December's low. The mid-range close sets the stage for a steady to lower opening when Friday's night session begins. Stochastics and the RSI are neutral to bullish signaling that sideways to higher prices are possible near-term. If February extends the aforementioned rally, the 50-day moving average crossing at $80.89 is the next upside target. Closes below last-Friday's low crossing at $73.40 would signal that a short-term top has been posted. First resistance is today's high crossing at $79.90. Second resistance is the 50-day moving average crossing at $80.89. First support islast-Friday's low crossing at $73.40. Second support is the December 9thlow crossing at $70.31.
February heating oil closed slightly lower on Thursday. The low-range close sets the stage for a steady to lower opening when Friday's night trading session begins. Stochastics and the RSI have turned neutral to bullish signaling that sideways to higher prices are possible near-term. If February renews the rally off the December 9th low, the 50-day moving average crossing at $3.2521 is the next upside target. Closes below Tuesday's low crossing at $2.9682 would signal that a short-term top has been posted. First resistance is the 50-day moving average crossing at $3.2521. Second resistance is the November 15th high crossing at $3.4722. First support is Tuesday's low crossing at $3.9682. Second support is the December 9th low crossing at $2.7517.
February unleaded gas closed slightly higher on Thursday as it extended the rally off December's low. The high-range close sets the stage for a steady to higher opening when Friday's night session begins trading. Stochastics and the RSI are neutral to bullish signaling that sideways to higher prices are possible near-term. If February extends this month's rally, the 50-day moving average crossing at $2.3559 is the next upside target. Closes below last-Friday's low crossing at 2.1157 would signal that a short-term top has been posted. First resistance is today's high crossing at $2.2968. Second resistance is the 50-day moving average crossing at $2.3559. First support is last-Friday's low crossing at 2.1157. Second support is the December 12th low crossing at $2.0321.
February Henry natural gas closed lower on Thursday as it renewed the decline off November's high. The low-range close sets the stage for a steady to lower opening when Friday's night session begins trading. Stochastics and the RSI are oversold but remain neutral to bearish signaling that sideways to lower prices are possible near-term. If February extends the aforementioned decline, the 75% retracement level of the 2020-2022 rally crossing at 4.332 is the next downside target. Closes above the 50-day moving average crossing at 6.256 would signal that a short-term low has been posted. First resistance is the 10-day moving average crossing at 5.948. Second resistance is the 20-day moving average crossing at 6.256. First support is today's low crossing at 4.905. Second support is the 75% retracement level of the 2020-2022 rally crossing at 4.332.
CURRENCIES? http://quotes.ino.com/ex?changes/?c=currencies ""
The March Dollar closed higher on Thursday. The high-range close sets the stage for a steady to higher opening when Friday's nights session begins trading. Stochastics and the RSI are neutral to bullish signaling that sideways to higher prices are possible near-term. Closes above the 20-day moving average crossing at 104.614 would signal that a short-term low has been posted. If March renews the decline off September's high, the 75% retracement level of the January-September rally crossing at $101.331 is the next downside target. First resistance is the 20-day moving average crossing at 104.614. Second resistance is the November 30thhigh crossing at 106.775. First support is last-Thursday's low crossing at $102.875. Second support is 75% retracement level of the January-September rally crossing at $101.331.
The March Euro closed lower on Thursday as it extends the decline off last-Thursday's high. The low-range close sets the stage for a steady to lower opening when Friday's night session begins trading. Stochastics and the RSI are neutral to bearish signaling that sideways to lower prices are possible near-term. Closes below the 20-day moving average crossing at 1.06051 would signal that a short-term top has been posted. If March resumes the rally off September's low, the March 31st high crossing at $1.09680 is the next upside target. First resistance is the 25% retracement level of the 2018-2022 decline crossing at $1.07982. Second resistance is the March 31st high crossing at $1.09680. First support is the 20-day moving average crossing at $1.06051. Second support is the November 30th low crossing at $1.03715.
The March British Pound closed lower on Thursday as it extends the decline off last-Wednesday's high. The low-range close sets the stage for a steady to lower opening when Friday's night session begins trading. Stochastics and the RSI are oversold but remain neutral to bearish signaling sideways to lower prices are possible near-term. If March extends the decline off December's high, the 50-day moving average crossing at 1.1835 is the next downside target. Closes above the 10-day moving average crossing at 1.2239 would signal that a short-term low has been posted. If March renews the rally off September's low, the 62% retracement level of the May-September decline crossing at 1.2770 is the next upside target. First resistance is last-Wednesday's high crossing at 1.2479. Second resistance is the 62% retracement level of the May-September decline crossing at 1.2770. First support is the November 30th low crossing at 1.1937. Second support is the 50-day moving average crossing at 1.1835.
The March Swiss Franc posted a key reversal down and closed lower on Thursday. The low-range close sets the stage for a steady to lower opening when Friday's night session begins trading. Stochastics and the RSI are turning neutral to bullish signaling that sideways to higher prices are possible near-term. If March renews the rally off September's low, the 62% retracement level of the 2018-2022 decline crossing at 1.10351 is the next upside target. Closes below the 20-day moving average crossing at 1.07982 would signal that a short-term top has been posted. First resistance is last-Wednesday's high crossing at 1.09665. Second resistance is the 62% retracement level of the 2018-2022 decline crossing at 1.10351. First support is the 20-day moving average crossing at 1.07982. Second support is the November 30th low crossing at 1.06060.
The March Canadian Dollar closed slightly lower on Thursday as it extended the trading range of the past three-weeks. The low-range close sets the stage for a steady to lower opening when Friday's night session begins trading. Stochastics and the RSI are oversold but are turning neutral to bullish signaling that sideways to higher prices are possible near-term. Closes above the 50-day moving average crossing at 73.89 would confirm that a short-term low has been posted. If March renews the decline off November's high, the November 3rd low crossing at 72.58 is the next downside target. First resistance is the December 5th high crossing at 74.82. Second resistance is the November 25thhigh crossing at 75.16. First support is last-Friday's low crossing at 73.04. Second support is the November 3rd low crossing at 72.58.
The March Japanese Yen closed lower on Thursday as it consolidated some of Tuesday's rally. The low-range close sets the stage for a steady to lower opening when Friday’s night session begins trading. Stochastics and the RSI are neutral to bullish signaling that sideways to higher prices are possible near-term. If March extends the rally off October's low, August's high crossing at 0.078135 is the next upside target. Closes below last-Thursday's low crossing at 0.073210 would confirm that a short-term top has been posted. First resistance is Tuesday's high crossing at 0.077470. Second resistance is August's high crossing at 0.078135. First support is last-Thursday's low crossing at 0.073210. Second support is the November 30th low crossing at 0.072510.
PRECIOUS METALS? http://quotes.ino.com/ex?changes/?c=metals ""
February gold closed sharply lower on Thursday and the low-range close sets the stage for a steady to lower opening when Friday's night session begins trading. Stochastics and the RSI are turning neutral to bearish signaling that sideways to lower prices are possible near-term. Closes below the 20-day moving average crossing at $1796.10 would signal that a short-term top has been posted while opening the door for additional weakness near-term. If February renews the rally off November's low, the 50% retracement level of the March-October decline crossing at $1861.40 is the next upside target. First resistance is last-Tuesday's high crossing at $1836.90. Second resistance is the 50% retracement level of the March-October decline crossing at $1861.40. First support is the 20-day moving average crossing at $1796.10. Second support is the November 23rd low crossing at $1733.50.
March silver closed sharply lower on Thursday as it consolidates some of Tuesday's rally. The low-range close sets the stage for a steady to lower opening when Friday's night session begins trading. Stochastics and the RSI are overbought, diverging but remain neutral to bullish signaling that sideways to higher prices are possible near-term. If March extends the rally off October's low, the 75% retracement level of the March-August decline crossing at 24.779 is the next upside target. Closes below the 20-day moving average crossing at 23.012 would confirm that a short-term top has been posted while opening the door for additional weakness near-term. First resistance is Wednesday's high crossing at 24.525. Second resistance is the 75% retracement level of the March-September decline crossing at 24.779. First support is the 20-day moving average crossing at 23.012. Second resistance is the December 6th low crossing at 22.190.
March copper closed lower on Thursday. The low-range close sets the stage for a steady to lower opening when Friday's night session begins trading. Stochastics and the RSI are neutral to bearish signaling that sideways to lower prices are possible near-term. Closes below Tuesday's low crossing at 3.7230 would confirm that a short-term top has been posted. If March renews the rally off September's low, the 50% retracement level of the March-July decline crossing at 4.0343 is the next upside target. First resistance is November's high crossing at 3.9470. Second resistance is the 50% retracement level of the March-July decline crossing at 4.0343. First support is Tuesday's low crossing at 3.7230. Second support is the 50-day moving average crossing at 3.6452.
GRAINS? http://quotes.ino.com/ex?changes/?c=grains "
March Corn closed down $0.01 3/4-cents at $6.60 1/2.
March corn closed lower on Thursday as it consolidated some of the rally off December's low. The low-range close sets the stage for a steady to lower opening when Friday's night session begins trading. Stochastics and the RSI are neutral to bullish signaling that sideways to higher prices are possible near-term. If March extends this month's rally, the 50-day moving average crossing at $6.70 is the next upside target. Closes below Monday's low crossing at $6.44 would confirm that a short-term top has been posted. If March renews the decline off October's high, the 62% retracement level of the July-October rally crossing at $6.23 is the next downside target. First resistance is today's high crossing at $6.64 3/4. Second resistance is the 50-day moving average crossing at $6.70. First support is the December 7th low crossing at $6.35. Second support is the 62% retracement level of the July-October rally crossing at $6.23.
March wheat closed down $0.06 3/4-cents at $7.61.
March wheat closed sharply lower on Thursday as it extends the trading range of the past three-weeks. The low-range close sets the stage for a steady to lower opening when Friday's night session begins trading. Stochastics and the RSI are neutral to bullish signaling that sideways to higher prices are possible near-term. Closes above the December 13th high crossing at $7.69 1/4 would signal that a short-term low has been posted while opening the door for additional gains near-term. If March renews the decline off October's high, the September 9, 2021 low crossing at $6.94 is the next downside target. First resistance is the December 13th high crossing at $7.69 1/4. Second resistance is the 50-day moving average crossing at $8.16 1/4. First support is the 75% retracement level of the 2018-2022 rally crossing at $7.24 1/4. Second support is the September 9, 2021 low crossing at $6.94.
March Kansas City Wheat closed up $0.01 1/4-cents at $8.65 1/4.
March Kansas City wheat closed higher on Thursday. The low-range close sets the stage for a steady to higher opening when Friday's night session begins trading. Stochastics and the RSI are neutral to bullish signaling that sideways to higher prices are possible near-term. Closes above the December 13th high crossing at $8.79 1/4 are needed to confirm that a short-term low has been posted. If March renews the decline off October's high, August's low crossing at $8.18 3/4 is the next downside target. First resistance is the December 13th high crossing at $8.79 1/4. Second resistance is the 50-day moving average crossing at $9.10. First support is the December 6th low crossing at $8.21 3/4. Second support is August's low crossing at $8.18 3/4.
March Minneapolis wheat closed down $0.05 1/2-cents at $9.22 1/4.
March Minneapolis wheat closed lower on Wednesday as it extends this month's trading range. The low-range close sets the stage for a steady to lower opening when Friday's night session begins trading. Stochastics and the RSI are neutral to bullish signaling that sideways to higher prices are possible near-term. Closes above the December 13th high crossing at $9.32 would confirm that a short-term low has been posted while opening the door for additional gains near-term. If March renews the decline off November's high, August's low crossing at $8.75 3/4 is the next downside target. First resistance is the December 13th high crossing at $9.32. Second resistance is the 50-day moving average crossing at $9.48 1/2. First support is Monday's low crossing at $9.00 3/4. Second support is the December 6th low crossing at $8.90.
SOYBEAN COMPLEX? http://quotes.ino.com/ex?changes/?c=grains "
March soybeans closed down $0.11 3/4-cents at $14.72 3/4.
March soybeans closed lower on Thursday while extending the trading range of the past three-week's trading range. The low-range close sets the stage for a steady to lower opening when Friday's night trade begins. Stochastics and the RSI are neutral signaling that sideways trading is possible near-term. Closes below Tuesday's low crossing at $14.62 1/4 would signal a possible downside breakout of this month's trading range while opening the door for additional weakness near-term. If March renews the rally off October's low, September's high crossing at $15.08 is the next upside target. First resistance is the December 9th high crossing at $14.97 1/4. Second resistance is September's high crossing at $15.08. First support is Tuesday's low crossing at $14.62 1/4. Second support is the 50-day moving average crossing at $14.44 1/2.
March soybean meal closed down $5.00 at $447.70.
March soybean meal closed lower on Thursday ending a two-day bounce off Monday's low. The low-range close sets the stage for a steady to lower opening when Friday's night session begins trading. Stochastics and the RSI are neutral to bearish signaling that sideways to lower prices are possible near-term. If March extends this month's decline, the 20-day moving average crossing at $440.30 is the next downside target. If March renews the rally off October's low, monthly resistance on the continuation chart crossing at $478.60 is the next upside target. First resistance is the December 9th high crossing at $469.30. Second resistance is monthly resistance crossing at $478.60. First support is Monday's low crossing at $443.40. Second support is the 20-day moving average crossing at $440.30.
March soybean oil closed down 73-pts. At 64.10.
March soybean oil closed lower on Thursday as it consolidates some of the rally off December's low. The low-range close sets the stage for a steady to lower opening when Friday's night session begins trading. Stochastics and the RSI are neutral to bullish signaling that sideways to higher prices are possible near-term. If March extends the rally off December's low, the 50-day moving average crossing at 66.86 is the next upside target. Closes below last-Friday's low crossing at 61.47 would signal that a short-term top has been posted. First resistance is the 50-day moving average crossing at 66.86. Second resistance is the November 29th high crossing at 72.49. First support is the 75% retracement level of the July-November rally crossing at 58.84. Second support is the 87% retracement level of the July-November rally crossing at 56.49.
LIVESTOCKhttp://quotes.ino.com/exchanges/?c=livestock
February hogs closed up $0.33 at $88.73.
February hogs closed higher on Thursday as it extended the rally off December's low. The high-range close sets the stage for a steady to higher opening when Friday's session begins trading. Stochastics and the RSI are neutral to bullish signaling that sideways to higher prices are possible near-term. If February extends today's rally, December's high crossing at $91.90. If February renews the decline off November's high, the 75% retracement level of the October rally crossing at $80.25 is the next downside target. First resistance is today's high crossing at $89.33 Second resistance is December's high crossing at $91.90. First support is Wednesday's low crossing at $83.90. Second support is December's low crossing at $81.52.
February cattle closed down $0.40 at $157.30.
February cattle posted an inside day with a lower close on Thursday as it consolidated some of Wednesday's rally. The low-range close sets the stage for a steady to lower opening on Friday. Stochastics and the RSI are overbought but remain neutral to bullish signaling that sideways to higher prices are possible near-term. If February extends this month's rally, the 87% retracement level of the monthly continuation chart crossing at $159.54 is the next upside target. Closes below the 50-day moving average crossing at $155.06 would signal that a short-term top has been posted. First resistance is Wednesday's high crossing at $157.98. Second resistance is the 87% retracement level of the monthly continuation chart crossing at $159.54. First support is the 50-day moving average crossing at $155.06. Second support is the December 7th low crossing at $152.75.
March Feeder cattle closed up $0.63 at $186.35.
March Feeder cattle closed higher on Thursday as it extends the rally off Tuesday's low. The high-range close sets the stage for a steady to higher opening when Friday's session begins trading. Stochastics and the RSI have turned neutral to bullish signaling that sideways to higher prices are possible near-term. If March renews the rally off the November 28th low, the 75% retracement level of the August-October decline crossing at $188.29 is the next upside target. Closes below the 50-day moving average crossing at $182.78 would confirm that a short-term top has been posted while opening the door for additional weakness near-term. First resistance is the 62% retracement level of the August-October decline crossing at $185.98. Second resistance is the 75% retracement level of the August-October decline crossing at $188.29. First support is the 50-day moving average crossing at $182.78. Second support is the November 28th low crossing at $180.27.
FOOD & FIBERhttp://quotes.ino.com/ex changes/?c=food
March coffee closed slightly lower on Thursday. The high-range close sets the stage for a steady to higher opening on Friday. Stochastics and the RSI have turned neutral to bullish signaling sideways to higher prices are possible near-term. Closes above last-Friday's high crossing at $17.38 would open the door for additional gains near-term. If March renews the decline off August's high, November's low crossing at $15.41 is the next downside target. First resistance is last-Friday's high crossing at $17.38. Second resistance is November's high crossing at $17.82. First support is November's low crossing at $15.41. Second support is the 75% retracement level of the 2020-2022 rally crossing at $14.74.
March cocoa closed sharply higher on Thursday marking an upside breakout of the November-December trading range. The high-range close sets the stage for a steady to higher opening on Friday. Stochastics and the RSI have turned neutral to bullish signaling sideways to higher prices are possible near-term. If March extends the rally off September low, the May-2022 high on the weekly continuation chart crossing at 26.46 is the next upside target. Closes below last-Friday's low crossing at 24.68 would signal that a short-term top has been posted while opening the door for additional weakness near-term.
March sugar closed higher on Thursday as it extends the rally off September's low. The high-range close sets the stage for a steady to higher opening on Friday. Stochastics and the RSI are overbought but remain neutral to bullish signaling that sideways to higher prices are possible near-term. If March extends the rally off September's low, weekly resistance on the weekly continuation chart crossing at 26.46 is the next upside target. Closes below the 20-day moving average crossing at 19.83 would signal that a short-term top has been posted.
March cotton closed sharply lower on Thursday as it consolidated some of this week's rally. The low-range close sets the stage for a steady to lower opening on Friday. Stochastics and the RSI are overbought but remain neutral to bullish signaling that sideways to lower prices are possible near-term. Closes below the 50-day moving average crossing at 81.73 would signal that a short-term top has been posted. If March extends the rally off October's low, the 50% retracement level of the August-October decline crossing at 93.31 is the next upside target.
Thanks tallpine!
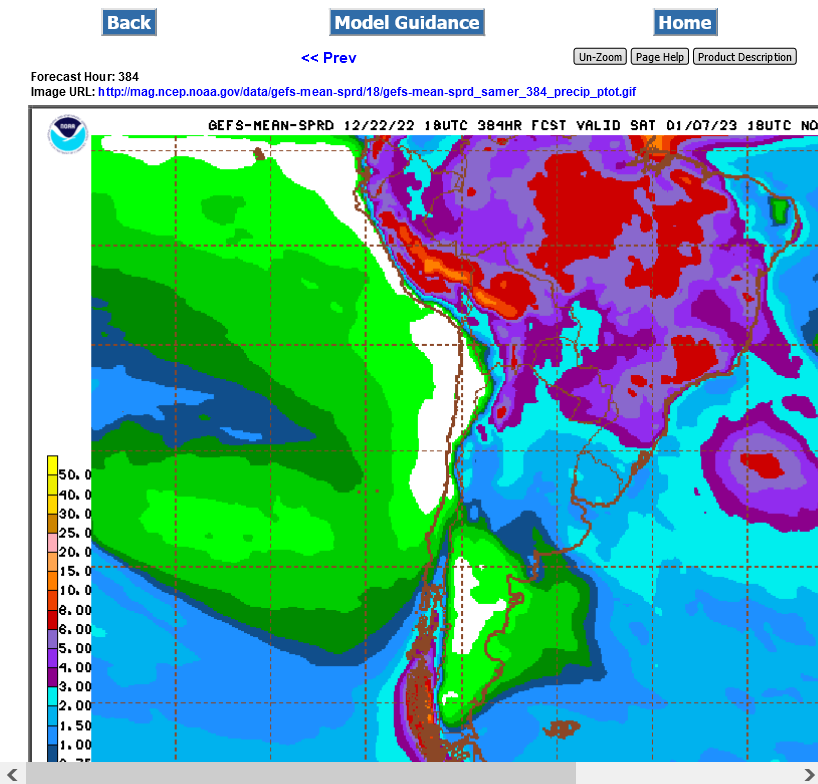
Continued with a tiny bit less rain for Argentina but still more than a week ago at this time.
Warmer temps next week has been obliterating ng, along with bearish EIA reports.