Heat and mass transfers in the context of energy geostructures
https://www.sciencedirect.com/topics/engineering/volumetric-heat-capacity
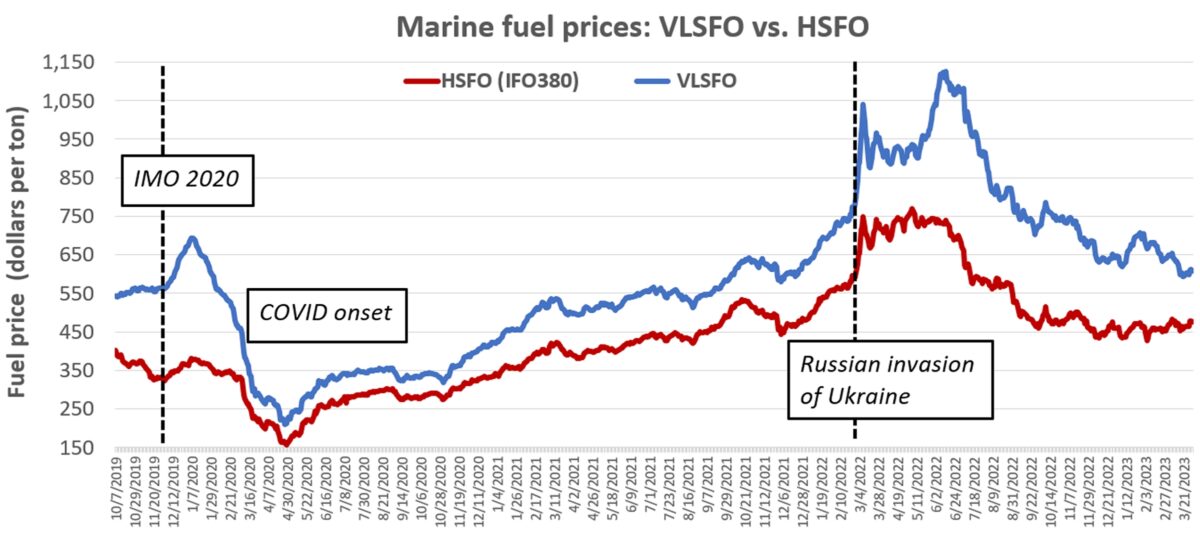
"On January 1st 2020 new shipping regulation came into effect (#IMO2020), decreasing the maximum amount of sulfur in shipping fuels from 3.5% to 0.5%.From 2020 we see a rapid increase in the amount of solar radiation that's being absorbed by the region highlighted above."
"If this trend continues that could mean that the Northern Hemisphere mid latitudes (where many of us live) will warm much more rapidly."
"Sea Surface Temperatures have spiked for the Northern Hemisphere Mid Latitudes. In 2022 these were 1°C above the 1979-2000 average. It takes a lot of heat to warm the oceans."
Thanks very much, Larry!
wonderful topic,
I was completely unaware of this new rule/law and will do more homework about its impact on heating the oceans.
Sulfur in the air is legit pollution as burning untreated, many kinds of fossil fuels causes SOx compounds.
Sulfur Dioxide (SO2) Pollution
https://www.epa.gov/so2-pollution/sulfur-dioxide-basics
Scrubbers take most of the SO2 out of emissions from industry burning fossil fuels.
Motor vehicles have been using extremely low sulfur fuel for over a decade now, which I didn't know:
https://www.transportpolicy.net/standard/us-fuels-diesel-and-gasoline/
Ultralow sulfur diesel with a maximum of 15 ppm sulfur has been the norm since 2006 for on-road vehicles, 2010 for non-road vehicles, and 2012 for locomotives and marine vessels. As of January 2017, gasoline is limited to an average of 10 ppm sulfur on an annual basis
+++
While ships have continued to use a much high sulfur diesel for fuel......until this law was passed.
New rules introduced by International Maritime Organisation expected to reduce certain forms of air pollution
Sulphur will be cut drastically from global shipping transport fuels in 2020, in a move that should reduce some forms of air pollution, and may help towards tackling the climate emergency – but which could also lead to a rise in the price of flights.
From 1 January 2020, ships will only be allowed to use fuel oil with a very low sulphur content, under rules brought in by the International Maritime Organisation. This cut in sulphur content has been more than a decade in the planning, and almost all shipping around the world is expected to comply, or face penalties.
“Member states, the shipping industry and fuel oil suppliers have been working for the past three years to prepare for this major change – I am confident that the benefits will soon be felt and that implementation will be smooth,” said Kitack Lim, the secretary general of the IMO. “This [is a] hugely important change which will have significant positive benefits for human health and the environment.
+++++++++++
Looks like ships will need to use scrubbers or burn low sulfur fuel.
So that's the background.
I've always felt that the global cooling years of the 40's-70's were partly from the increase in "dimming" of the sun because of the big increase in pollution coming from industry and cars.
Then, the impact of the Clean Air Act and its stricter amendments were substantial in greatly reducing this air pollution and the solar dimming impact with it. Especially starting in the 1970's, which is when we started global brightening of the sun from less pollution. This could have added Just as much warming as did the warming from increasing CO2.
You may have read that many scientists were concerned about global cooling in the 1970's, even though CO2 had been increasing for decades While global temps dropped from global sun dimming from pollution in the 40s to the 70s.
It's extremely likely that this was just global sun dimming from pollution. When we eliminated the dimming and saw global sun brightening along WITH CO2 continuing to increase, it was a double whammy in warming In the 1980s and 90s.
But nobody recognized the global dimming/brightening factor.
The global climate models dialed in ZERO impact from the global sun brightening and modelers used mathematical equations to represent the physics that were based on all the warming coming from just the increase in CO2 and positive feedback from the resulting increase in H2O that basically tripled the warming. H2O is the main, (95%) greenhouse gas on our planet. You can especially observe that in deserts, where it’s extraordinarily dry at night. Temps will plunge by 40 degrees at night because there isn’t much H2O in the air to hold in the heat From greenhouse gas warming.
In the last 20+ years we've actually been able to accurately measure the CO2 forcing and it's around 50% of what the models assume with their equations that have predicted too much warmth. The reaction in updated models was not to adjust them cooler as would be expected if following this science but instead to make them even hotter.
Hugh? That's because the models have not been used for science. They are for politics.
RADIATIVE FORCING BY CO2 OBSERVED AT TOP OF ATMOSPHERE FROM 2002-2019
https://arxiv.org/pdf/1911.10605.pdf
"The IPCC Fifth Assessment Report predicted 0.508±0.102 Wm−2RF resulting from this CO2 increase, 42% more forcing than actually observed. The lack of quantitative long-term global OLR studies may be permitting inaccu-racies to persist in general circulation model forecasts of the effects of rising CO2 or other greenhouse gasses."
+++++++++++++++++
Back to the global dimming and its upcoming impact. There are some that say this is why the models have been too warm. They insist the physics are right but the global dimming is why its not warming at the projected rate. I say.........read the study above. That's the science. CO2 is only having 50% of the warming impact that the climate models assign for it with the mathematical equations. This is indisputable from the scientifica measurements In the study.
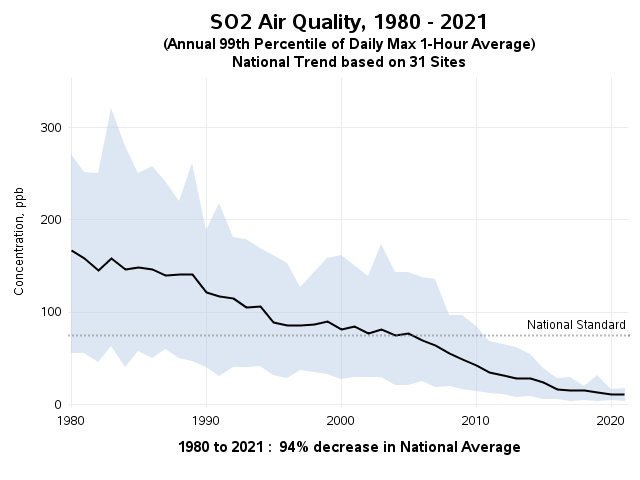
Anyway, let's look back at the reduction in SO2 from the Clean Air Acts.
It's more speculation but when the SO2 emissions dropped the most, in the 1980'/90's it reversed the global dimming and caused global sun brightening….and then the rate of global warming was greatest.......and when many in climate science/modelers were convinced forever that this defined the new rate, which might even accelerate. ….and thought it was all from more CO2 even though half was from global brightening.
note the peak in SO2 emissions below in the 1970s before the clean air acts.
https://wattsupwiththat.com/2015/05/26/the-role-of-sulfur-dioxide-aerosols-in-climate-change/

If we look at the graph above, it has a blue line for International Shipping. That's what we're talking about here.
As of 2020, it probably was close to the 2nd highest on the graph but still only 1/3rd of the amount from East Asia.
We should also discuss East Asia cutting and/or increasing emission when discussing this global sun dimming issue.
But this point you make relates to ship emissions of SO2 which is entirely over water, which is different. The heat capacity of water is something like 4,000 times that of air. We should compare the heat capacity of water to different bare soils(vegetation and snow and other things on the surface have different heat capacities) So heating the surface of the ocean is going to retain alot more heat than heating land.
https://www.sciencedirect.com/topics/engineering/volumetric-heat-capacity
Table 3.9. Volumetric heat capacity of materials characterising energy geostructures.
| Material | Volumetric heat capacity, ρcp [MJ/(m3 °C)] | |
|---|---|---|
| Dry | Saturated | |
| Clay | 1.5–1.6 | 1.6–3.4 |
| Silt | 1.5–1.6 | 1.6–3.4 |
| Sand | 1.3–1.6 | 2.2–2.9 |
| Gravel | 1.4–1.6 | 2.4 |
| Peat | 0.5–3.8 | |
| Claystone/Siltstone | 2.1–2.4 | |
| Sandstone | 1.6–2.8 | |
| Quartzite | 2.1–2.2 | |
| Marl | 2.2–2.3 | |
| Limestone | 2.1–2.4 | |
| Argillaceous schists | 2.2–2.5 | |
| Micaschists | 2.2 | |
| Metaquartzite | 2.1 | |
| Marble | 2.0 | |
| Gneiss | 1.8–2.4 | |
| Rhyolithe | 2.1 | |
| Peridotite | 2.7 | |
| Granite | 2.1–3.0 | |
| Gabbro | 2.6 | |
| Diorite | 2.9 | |
| Basalt | 2.3–2.6 | |
| Concrete | 1.8–2.0 | |
| Steel | 3.12 | |
| Water | 4.186 | |
| Air | 0.0012 | |
Looking at the list, it seems reasonable to assume that the heat capacity of water is around double most soils. It's way more complicated though. The oceans are a fluid and the heat transfer and circulation is very different than soils. I'm guessing that they are way more efficient at storing solar radiation than soils. But there is more evaporation too which offsets as a cooling process.
also, as we know, extra daytime heating causes increasing buoyancy/rising air and more clouds to form....the type of cumulus clouds that are most efficient in BLOCKING solar radiation........so a negative feed back.
This is actually the biggest reason for the Midwest to have cooler daytime Summer highs during climate change.
In that case, a microclimate has evolved from the tightly packed rows of corn (double what they used to be) that increase dew points more than 5 deg in many cases during June-August compared to 40 years ago because of the massive evapotranspiration.
Even if the Cornbelt dynamic is very minor in this discussion, when applied to the oceans it's a mind boggling scientific/agronomy fact with indisputable evidence that everybody should understand.
We know that H2O is a strong greenhouse gas but in some situations it causes a NEGATIVE feedback because of more clouds and rain.
https://www.marketforum.com/forum/topic/86581/#86772
This is one of the best topics you've ever brought up here, Larry!
Alot going on beyond just the loss of the global dimming impact from SO2 emissions that resulted from burning high sulfur diesel fuel in ships.
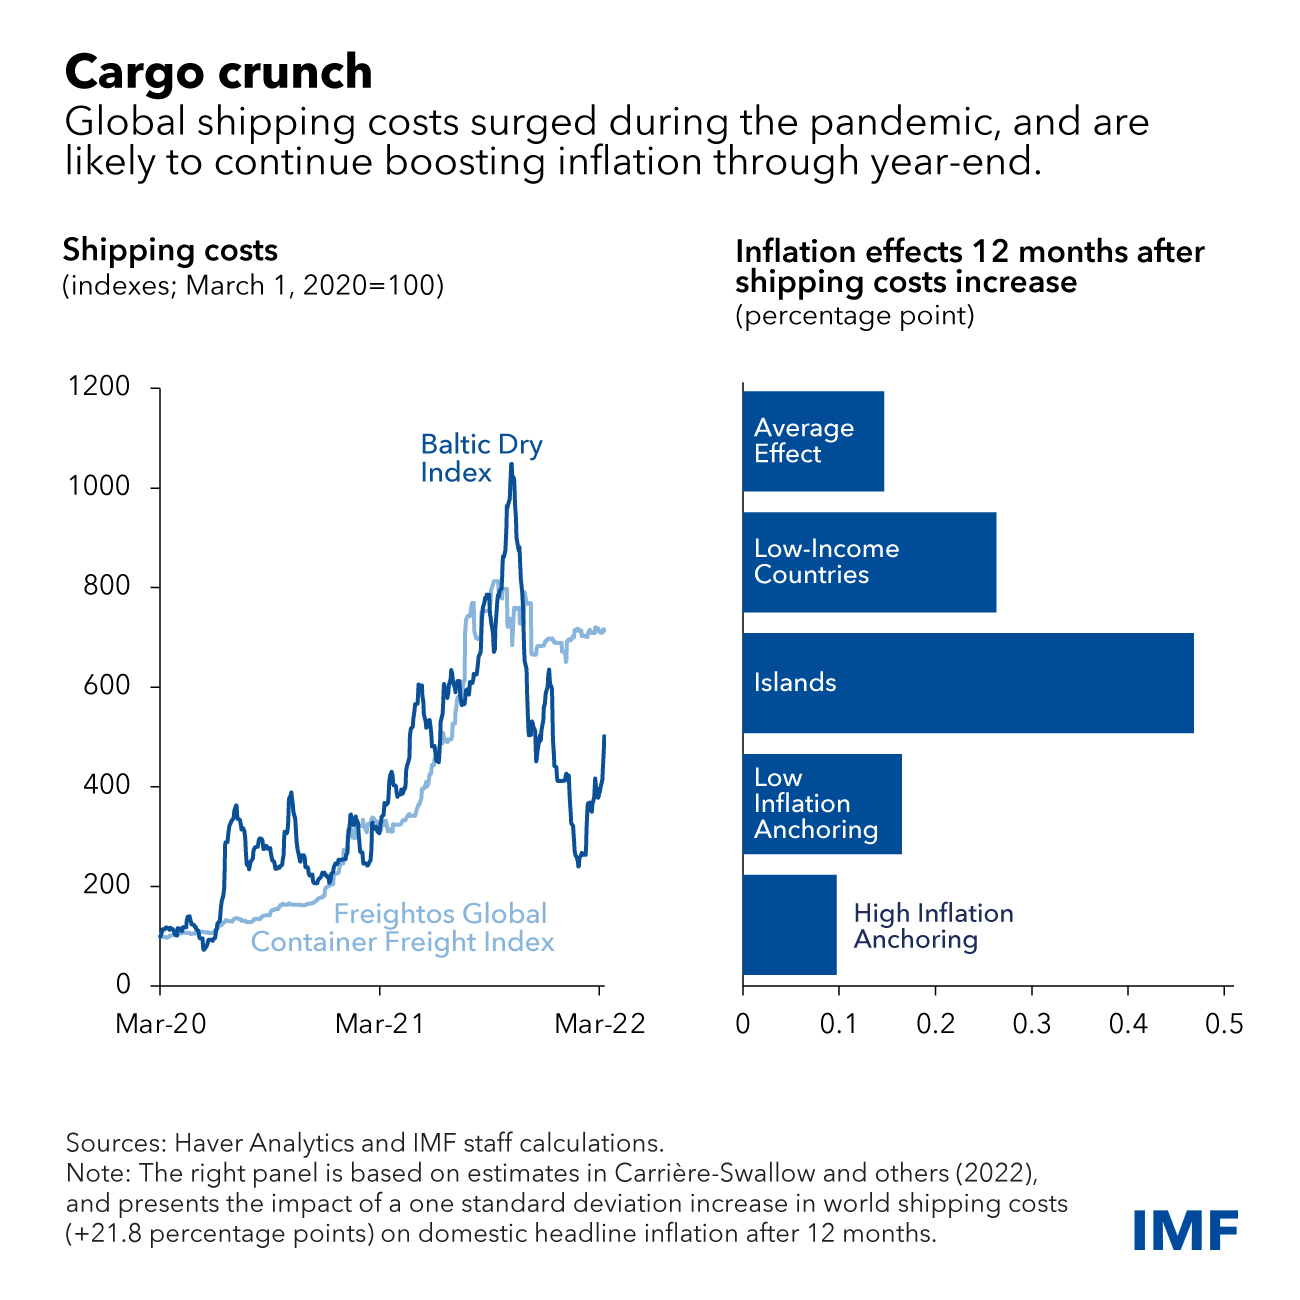
50% of the cost of transporting goods by ship is the cost of the fuel. Much more than that when fuel prices go up.
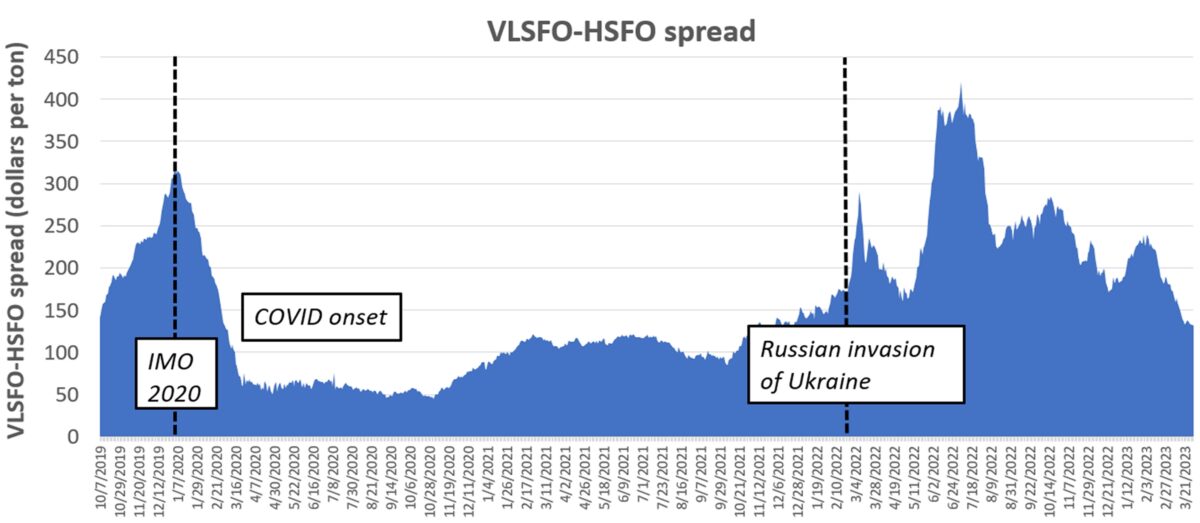
Very low sulfur fuel is always more expensive than high sulfur fuel. The ratio has changed with time. When COVID hit in 2020 prices crashed and their wasn't that much difference in price between the 2 fuels. After the invasion of Ukraine, the cost of both fuels spiked to extreme records highs with the low sulfur fuel price almost 5 times higher at its peak compared to the COVID low.
So there was an assumption that compliance with the new IMO rule would go down. We should note that high sulfur gas is still being used by ships with scrubbers.
During the last year, prices have slowly dropped back to pre war levels and pre COVID prices but with a pretty steep premium for the VLSFO price. With fuel prices being 50% of the cost for shipping, using the more expensive VLSFO clearly would contribute towards global inflation.
We didn't notice the impact in 2020 because of COVID, then the war caused the unsustainable spike but now, this new law will continue to put serious upward pressure on GLOBAL inflation because most of the worlds goods are transported over the oceans with ships.
·
https://www.freightwaves.com/news/ship-fuel-cost-down-from-war-peak-but-green-fallout-looms
Clarksons estimates that Capesize bulkers with scrubbers earned $4,400 per day more than nonscrubber Capesizes as of Friday. In July, the premium was $18,000 per day, over four times higher.
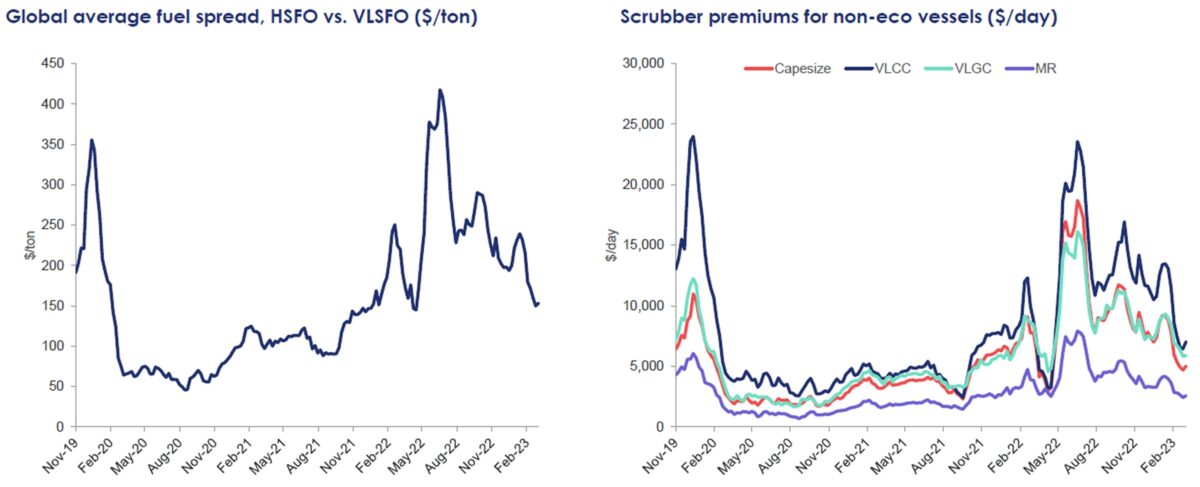
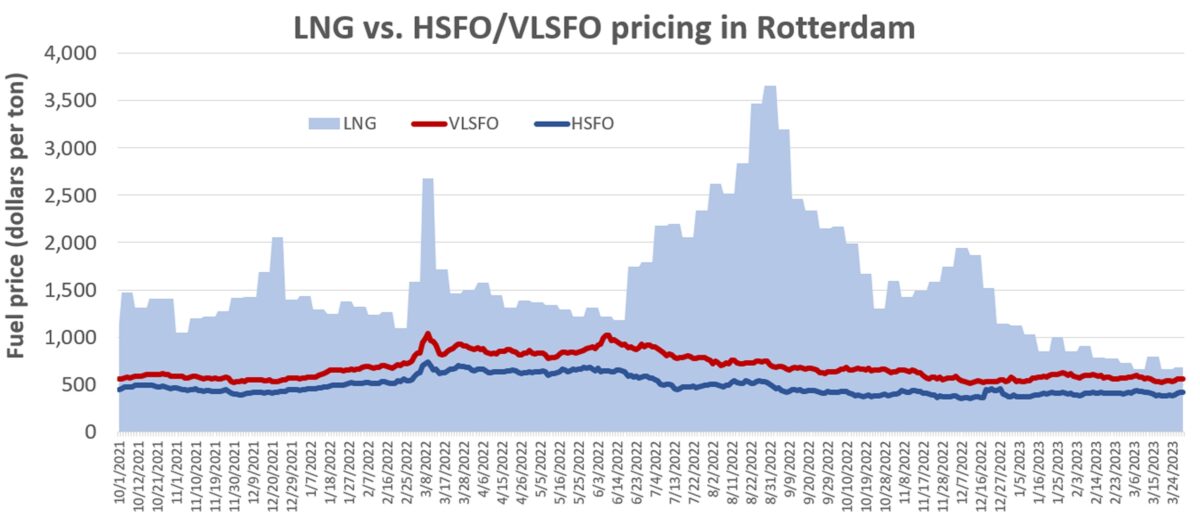
As of Thursday, bunkering with LNG was 62% more expensive than with HSFO. That’s actually minimal compared to the spread in the recent past. Since October 2019, LNG bunker prices have, on average, been more than triple HSFO prices in Rotterdam, according to Ship & Bunker data.
So we have a double whammy impact on inflation related to just the cost of shipping Goods.
80% of the worlds goods move around the world on the seas using ships.
more than 50% of the cost of transport via this method is the cost of fuel.
this new law to use much lower sulfur fuel,means higher priced low sulfur diesel costs Which is whammy 1
whammy 2 is from the war in Ukraine and it’s impact on energy/fuel prices.
In the US the amount of remaining SO2 in the air is insignificant in most places compared to 40 years ago!
This has reversed the solar dimming contribution from the US and caused solar brightening. Interestingly, temps in the US during the Summer with the highest sun angle have actually decreased a bit because the density of tightly packed corn plants has doubled during the period and created a micro climate from the increased evapotranspiration. More moisture, more low clouds, especially in the PM,blocking solar heating. More rain.
https://www.epa.gov/air-trends/sulfur-dioxide-trends

+++++++++++++++++
https://www.marketforum.com/forum/topic/86581/#86772
By metmike - July 5, 2022, 4:51 p.m.
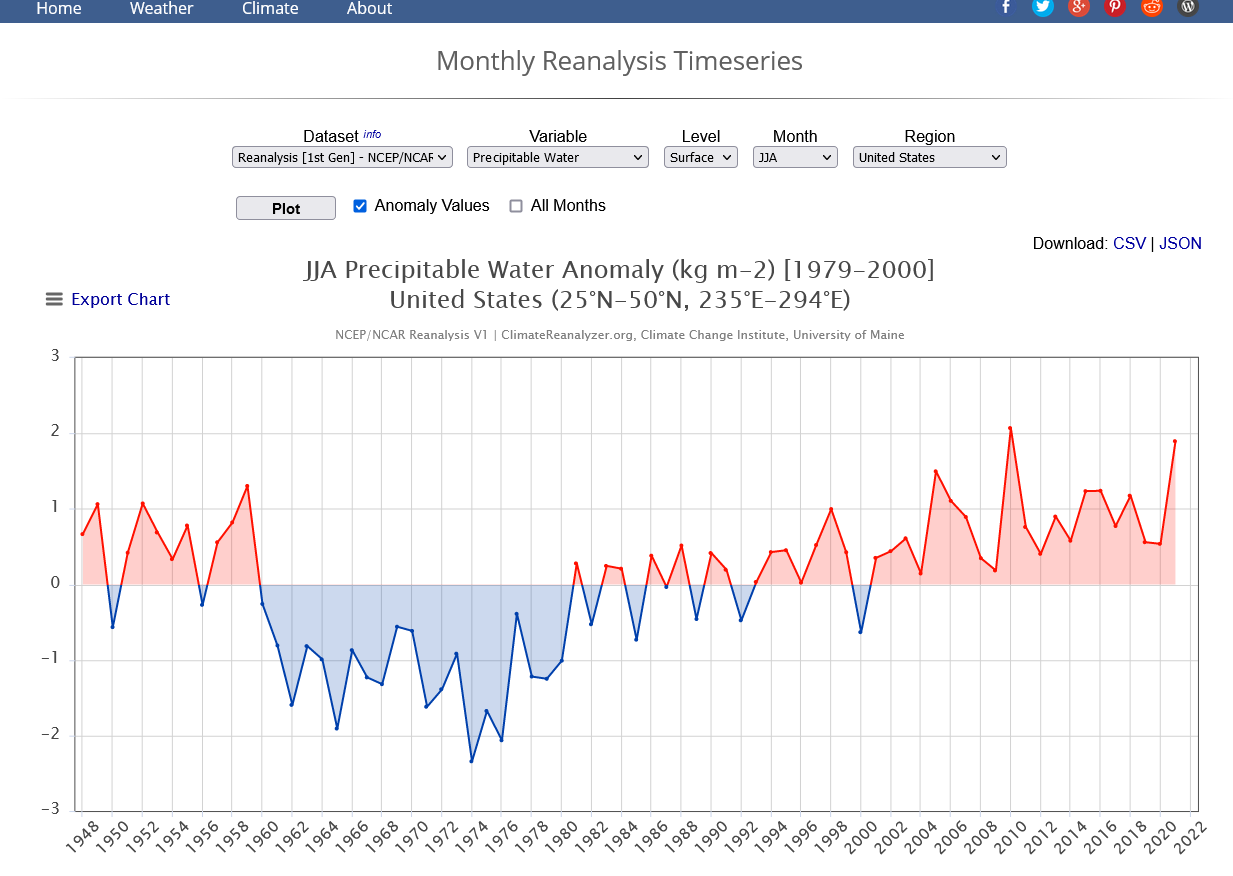
I found some great new sites thanks to this most recent video.......including this one and this graphic that I manufactured below(similar to the one on his video):
.png)
metmike: This confirms that climate change has been INCREASING the amount of rains in the Cornbelt during the main growing season.
There's been only 1 severe, widespread drought (2012) since 1988. 1993 featured the Great Flood.
Prior to 1937, most years were below to much below the mean.
After 1975, most years were above to much above the mean.
Part of this is the microclimate established by the tightly packed corn plants over this massive area that has greatly helped increase the dew points, precipitable water.
I had to copy this one from the video because its a product that Eric pays for.
It shows the big increase in dew points the last 3 decades:
%20Nutrien%20Ag%20Solutions%20July%204%202022.png)
i found my own link that shows the same thing in the US as a whole:
However, Eric totally missed out on the opportunity to explain the main reason for it to be greatly amplified in the J-J-A period in the Cornbelt.
https://www.marketforum.com/forum/topic/76156/#76158
https://journals.ametsoc.org/view/journals/clim/32/17/jcli-d-19-0096.1.xml

++++++++++++++++++++++++++++++++++++++++++++++++++++

America's Corn Fields Are Making the Weather Really Weird
https://www.wired.com/story/corn-fields-are-making-it-rain-more/?mbid=social_twitter_onsiteshare
Americans Have Planted So Much Corn That It’s Changing the Weather
https://www.atlasobscura.com/articles/corn-belt-weather
Climate change should help Midwest corn production
https://weatherfarm.com/2018/05/climate-change-should-help-midwest-corn-production/
https://www.sciencemag.org/news/2018/02/america-s-corn-belt-making-its-own-weather
https://addins.wrex.com/blogs/weather/2011/07/why-is-the-humidity-so-high-the-answer-is-pretty-corny