KEY EVENTS TO WATCH FOR:
Monday, May 15, 2023
8:30 AM ET. May Empire State Manufacturing Survey
Mfg Idx (previous 10.8)
Employment Idx (previous -8.0)
New Orders Idx (previous 25.1)
Prices Received (previous 23.7)
Tuesday, May 16, 2023
8:30 AM ET. April Advance Monthly Sales for Retail & Food Services
Overall Sales-SA, M/M% (previous -1%)
Sales, Ex-Auto, M/M% (previous -0.8%)
Sales, Ex-Auto & Gas, M/M% (previous -0.3%)
8:55 AM ET. Johnson Redbook Retail Sales Index
Ret Sales Mo-to-Date, Y/Y% (previous +1.3%)
Latest Wk, Y/Y% (previous +1.3%)
9:15 AM ET. April Industrial Production & Capacity Utilization
Industrial Production, M/M% (previous +0.4%)
Capacity Utilization % (previous 79.8%)
Capacity Utilization, Net Chg (Pts) (previous +0.2)
10:00 AM ET. May NAHB Housing Market Index
Housing Mkt Idx (previous 45)
10:00 AM ET. March Manufacturing & Trade: Inventories & Sales
Total Inventories (previous +0.2%)
4:30 PM ET. API Weekly Statistical Bulletin
Crude Stocks, Net Chg (Bbls) (previous +3.6M)
Gasoline Stocks, Net Chg (Bbls) (previous +0.4M)
Distillate Stocks, Net Chg (Bbls) (previous -3.9M)
Wednesday, May 17, 2023
7:00 AM ET. MBA Weekly Mortgage Applications Survey
Composite Idx (previous 227.8)
Composite Idx, W/W% (previous +6.3%)
Purchase Idx-SA (previous 173.7)
Purchase Idx-SA, W/W% (previous +4.8%)
Refinance Idx (previous 507.1)
Refinance Idx, W/W% (previous +10.0%)
8:30 AM ET. April New Residential Construction - Housing Starts and Building Permits
Total Starts (previous 1.420M)
Housing Starts, M/M% (previous -0.8%)
Building Permits (previous 1.413M)
Building Permits, M/M% (previous -8.8%)
10:30 AM ET. EIA Weekly Petroleum Status Report
Crude Oil Stocks (Bbl) (previous 462.584M)
Crude Oil Stocks, Net Chg (Bbl) (previous +2.951M)
Gasoline Stocks (Bbl) (previous 219.711M)
Gasoline Stocks, Net Chg (Bbl) (previous -3.167M)
Distillate Stocks (Bbl) (previous 106.153M)
Distillate Stocks, Net Chg (Bbl) (previous -4.17M)
Refinery Usage (previous 91.0%)
Total Prod Supplied (Bbl/day) (previous 20.164M)
Total Prod Supplied, Net Chg (Bbl/day) (previous +0.359M)
Thursday, May 18, 2023
8:30 AM ET. May Philadelphia Fed Business Outlook Survey
Business Activity (previous -31.3)
Prices Paid (previous 8.2)
Employment (previous -0.2)
New Orders (previous -22.7)
Prices Received (previous -3.3)
Delivery Times (previous -25.0)
Inventories (previous -17.9)
Shipments (previous -7.3)
8:30 AM ET. Unemployment Insurance Weekly Claims Report - Initial Claims
Jobless Claims (previous 264K)
Jobless Claims, Net Chg (previous +22K)
Continuing Claims (previous 1813000)
Continuing Claims, Net Chg (previous +12K)
8:30 AM ET. U.S. Weekly Export Sales
10:00 AM ET. April Existing Home Sales
Existing Sales (previous 4.44M)
Existing Sales, M/M% (previous -2.4%)
Unsold Homes Month's Supply (previous 2.6)
Median Price (USD) (previous 375700)
Median Home Price, Y/Y% (previous -0.9%)
10:00 AM ET. April Leading Indicators
Leading Index, M/M% (previous -1.2%)
Leading Index
Coincident Index, M/M% (previous +0.2%)
Lagging Index, M/M% (previous -0.2%)
10:00 AM ET. 1st Quarter Quarterly Retail E-Commerce Sales
10:30 AM ET. EIA Weekly Natural Gas Storage Report
Working Gas In Storage (Cbf) (previous 2141B)
Working Gas In Storage, Net Chg (Cbf) (previous +78B)
4:30 PM ET. Federal Discount Window Borrowings
4:30 PM ET. Foreign Central Bank Holdings
Friday, May 19, 2023
10:00 AM ET. 1st Quarter Advance Quarterly Services
10:00 AM ET. April State Employment and Unemployment
Thanks very much, tallpine!
Bullish USDA crop production for HRW crop still has that market higher tonight.
Mostly dry weather in the Upper and Central Midwest the next 2 weeks is still favorable for planting.
Wondering when dry becomes bullish for C and S???
Could be soon.
7 Day Total precipitation below:
http://www.wpc.ncep.noaa.govcdx /qpf/p168i.gif?1530796126

Extended weather.
https://www.cpc.ncep.noaa.gov/products/predictions/610day/ | |||||||||
| 6 to 10 day outlooks | |||||||||
| Click below for information about how to read 6-10 day outlook maps Temperature Precipitation | |||||||||
| Click below for archives of past outlooks (data & graphics), historical analogs to todays forecast, and other formats of the 6-10 day outlooks ArchivesAnalogsLines-Only FormatGIS Data | |||||||||
Temperature Probability | |||||||||
Precipitation Probability | |||||||||
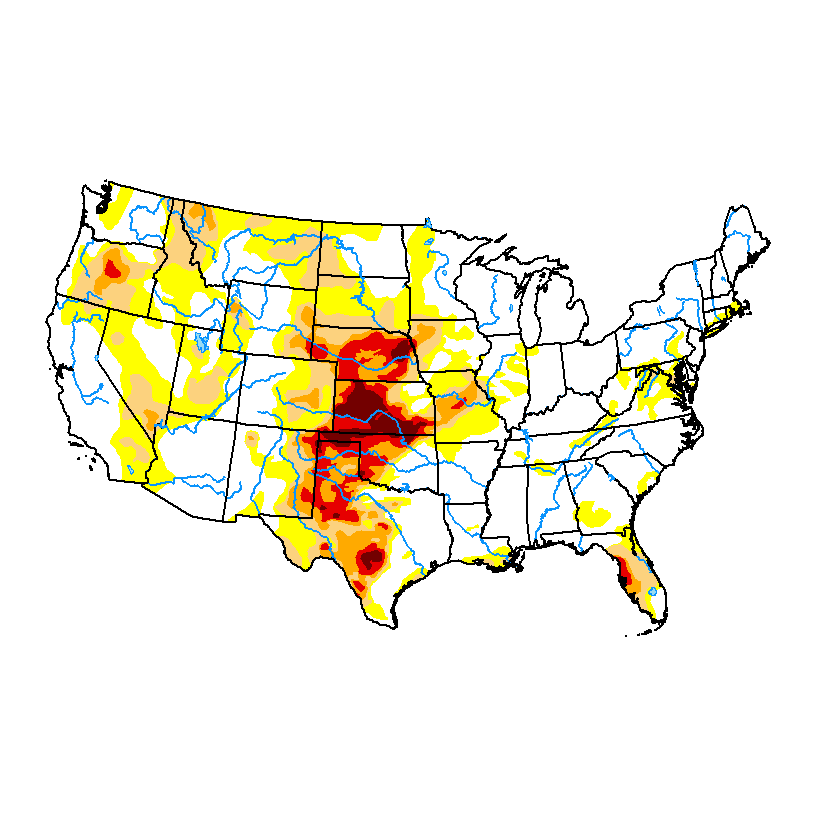
Soilmoisture anomaly:
These maps sometimes take a day to catch up to incorporate the latest data(the bottom map is only updated once a week).
https://www.cpc.ncep.noaa.gov/products/Soilmst_Monitoring/US/Soilmst/Soilmst.shtml#
![]()


++++++++++++++++++++++++++++
https://mrcc.purdue.edu/cliwatch/watch.htm#curMonths

Most of the drought in the West has been wiped out!
https://droughtmonitor.unl.edu/
Drought Monitor:
May 9, 2023
Drought monitor previous years: You can see the natural La Niña, (cold water-in the tropical Pacific)causing the drought! Starting in 2020, then worsening for 2+ years!
The ending of La Niña in 2023-heading towards El Nino, is causing the opposite weather-bombarding us with moisture.…..too much in some cases. This is a natural cycle NOT climate change!
All the weather:


