KEY EVENTS TO WATCH FOR:
Monday, June 12, 2023
2:00 PM ET. May Monthly Treasury Statement of Receipts and Outlays of the U.S. Government
The STOCK INDEXES? http://quotes.ino.com/ex?changes/?c=indexes
The Dow closed higher on Friday as it extends the rally off May's low.Today's mid-range close sets the stage for a steady to higher opening when Monday's day session begins trading. Stochastics and the RSI are overbought but remain neutral to bullish signaling that sideways to higher prices are possible near-term. If the Dow extends the rally off May's low, May's high crossing at 34,257.83 is the next upside target. Closes below the 20-day moving average crossing at 33,317.10 would signal that a short-term top has been posted. First resistance is today's high crossing at 33,975.32. Second resistance is May's high crossing at 34,257.83. First support is the 20-day moving average crossing at 33,317.10. Second support is last-Thursday's low crossing at 32,704.51. Third support is May's low crossing at 32,586.56.
The September NASDAQ 100 closed higher on Friday as it extends the trading range of the past two-weeks. The mid-range close sets the stage for a steady to higher opening when Monday's day session begins trading. Stochastics and the RSI are overbought but remain neutral to bullish signaling sideways to higher prices are possible. If September extends this year's rally, the 75% retracement level of the 2021-2022-decline on the weekly continuation chart crossing at 15,202.41 is the next upside target. Closes below the 20-day moving average crossing at 14,429.11 would signal that a short-term top has been posted. First resistance is Monday's high crossing at 14,869.50. Second resistance is the 75% retracement level of the 2020-2022-decline on the weekly continuation chart crossing at 15,202.41. First support is the 20-day moving average crossing at 14,429.11. Second support is the 50-day moving average crossing at 13,688.83.
The September S&P 500 closed higher on Friday as it extends the rally off March's low. The high-range close sets the stage for a steady to higher opening when Monday's day session begins trading. Stochastics and the RSI are overbought but remain neutral to bullish signaling that sideways to higher prices are possible near-term. If September extends the rally off March's low, the August-2022 high on the weekly chart crossing at 4409.00 is the next upside target. Closes below the 20-day moving average crossing at 4253.06 would confirm that a short-term top has been posted. First resistance is the 62% retracement level of 2022's decline crossing at 4358.36. Second resistance is the August-2022 high on the weekly chart crossing at 4409.00. First support is the 10-day moving average crossing at 4301.73. Second support is the 20-day moving average crossing at 4253.06.
INTEREST RATES? http://quotes.ino.com/ex?changes/?c=interest ""
September T-bonds closed down 4/32's at 127-16.
September T-bonds closed lower on Friday. The high-range close sets the stage for a steady to higher opening when Monday's day session begins trading. Stochastics and the RSI are turning neutral to bullish signaling that sideways to higher prices are possible near-term. Closes above last-Thursday's high crossing at 129-16 would confirm that a short-term low has been posted while opening the door for additional gains near-term. If September renews the decline off April's high, the 87% retracement level of the March- April rally crossing at 124-19 is the next downside target. First resistance is last-Thursday's high crossing at 129-16. Second resistance is the 50-day moving average crossing at 130-02. First support is the 75% retracement level of the March-April rally crossing at 125-30. Second support is the 87% retracement level of the March- April rally crossing at 124-19.
September T-notes closed down 110-pts. At 113.130.
June T-notes posted an inside day with a lower close on Friday. The mid-range close sets the stage for a steady to lower opening when Monday's day session begins trading. Stochastics and the RSI are neutral signaling that sideways to lower prices are possible near-term. If June renews the decline off May's high, the 75% retracement level of March's rally crossing at 112.190 is the next downside target. Closes above the 20-day moving average crossing at 114.115 would signal that a short-term low has been posted. First resistance is last-Thursday's high crossing at 115.000. Second resistance is the 50-day moving average crossing at 115.139. First support is the 75% retracement level of March's rally crossing at 112.190. Second support is the 87% retracement level of March's rally crossing at 111.243.
ENERGY MARKETS? http://quotes.ino.com/ex?changes/?c=energy ""
July crude oil closed lower on Friday as it extends the May-June trading range. The low-range close sets the stage for a steady to lower opening when Monday's day session begins. Stochastics and the RSI are turning neutral to bearish signaling that sideways to lower prices are possible near-term. Closes below the May 31st low crossing at $67.03 would confirm that a double top has been posted with the late-May high. Closes above Monday's high crossing at $75.06 would confirm that a short-term low has been posted while opening the door for additional short-term gains. First resistance is Monday's high crossing at $75.06. Second resistance is the April 28th high crossing at $76.74. First support is the May 31stlow crossing at $67.03. Second support is May's low crossing at $63.90.
July heating oil closed lower on Friday. The low-range close sets the stage for a steady to lower opening when Monday's day trading session begins. Stochastics and the RSI are neutral to bullish signaling that sideways to higher prices are possible near-term. Closes above the 50-day moving average crossing at 2.4279 would mark an upside breakout of the May-June trading range. Closes below Thursday's low crossing at $2.3174 would signal that a short-term top has been posted. First resistance is the 50-day moving average crossing at 2.4279. Second resistance is the April 24th high crossing at $2.5332. First support is the May 31st low crossing at $2.2268. Second support is May's low crossing at $2.1550.
July unleaded gas closed lower on Friday as it consolidated some of the rally off May's low. The mid-range close sets the stage for a steady to lower opening when Monday's day session begins trading. Stochastics and the RSI are diverging but remain neutral to bullish signaling that sideways to higher prices are possible near-term. If July extends the rally off May's low, the 87% retracement level of the April-May decline crossing at 2.6958 is the next upside target. Closes below the 20-day moving average crossing at 2.5210 would signal that a short-term top has been posted. First resistance Thursday's high crossing at 2.6822. Second resistance is the 87% retracement level of the April-May decline crossing at 2.6958. First support is the June low crossing at 2.4016. Second support is the May 15th low crossing at 2.3565.
July Henry natural gas closed lower on Friday as it consolidated some of this week's rally. The low-range close sets the stage for a steady to lower opening when Monday's day session begins trading. Stochastics and the RSI are turning neutral to bullish signaling that sideways to higher prices are possible near-term. Closes above the 50-day moving average crossing at 2.482 would signal that a short-term low has been posted. If July renews the decline off March's high, the September-2020 low on the monthly continuation chart crossing at 1.795 is the next downside target.First resistance is the 20-day moving average crossing at 2.415. Second resistance is the 50-day moving average crossing at 2.482. First support is last-Thursday's low crossing at 2.136. Second support is the September-2020 low on the monthly continuation chart crossing at 1.795.
CURRENCIES? http://quotes.ino.com/ex?changes/?c=currencies ""
The September Dollar posted an inside day with a higher close on Friday. The high-range close sets the stage for a steady to higher opening when Friday's session begins trading. Stochastics and the RSI are neutral to bearish signaling that sideways to lower prices are possible near-term. Multiple closes below the 20-day moving average crossing at 103.182 would confirm that a short-term top has been posted while opening the door for additional weakness near-term. If September resumes the rally off May's low, the March 15th high crossing at 104.250 is the next upside target. First resistance is the March 15th high crossing at 104.250. Second resistance is the March 8th high crossing at 104.730. First support is Thursday's low crossing at 102.875. Second support is the 50-day moving average crossing at 101.989.
The September Euro closed lower on Friday. The low-range close sets the stage for a steady to lower opening when Monday's day session begins trading. Stochastics and the RSI are neutral to bullish signaling that sideways to higher prices is possible near-term. Closes above the 20-day moving average crossing at $1.08325 would signal that a short-term low has been posted. If September renews the decline off May's high, the 38% retracement level of the 2022-2023 rally crossing at $1.06472 is the next downside target. First resistance is the 20-day moving average crossing at $1.08325. Second resistance is the 50-day moving average crossing at 1.09656. First support is May's low crossing at $1.07025. Second support is the 38% retracement level of the 2022-2023 rally crossing at $1.06472.
The September British Pound closed higher on Friday. The high-range close sets the stage for a steady to higher opening when Monday's day session begins trading. Stochastics and the RSI are neutral to bullish signaling sideways to higher prices are possible near-term. If September extends the rally off May's low, May's high crossing at 1.2705 is the next upside target. If September resumes the decline off May's high, the 25% retracement level of the 2022-2023 rally crossing at 1.2100 is the next downside target. First resistance is today's high crossing at 1.2610. Second resistance is May's high crossing at 1.2705. First support is May's low crossing at 1.2333. Second support is April's low crossing at 1.2316.
The September Swiss Franc closed lower on Friday. The low-range close sets the stage for a steady to lower opening when Monday's day session begins trading. Stochastics and the RSI are neutral to bullish signaling that sideways to higher prices are possible near-term. Closes above the 50-day moving average crossing at 1.12853 would signal that a short-term low has been posted. If September resumes the decline off May's high, the 38% retracement level of 2022-2023 rally crossing at 1.10197 is the next downside target. First resistance is the 50-day moving average crossing at 1.12853. Second resistance is the May 4th high crossing at 1.14920. First support is the 38% retracement level of 2022-2023 rally crossing at 1.10197. Second support is the 50% retracement level of 2022-2023 rally crossing at 1.08741.
The September Canadian Dollar closed higher on Friday as it extends the rally off May's low. The mid-range close sets the stage for a steady to higher opening when Monday's day session begins trading. Stochastics and the RSI are overbought but remain neutral to bullish signaling that sideways to higher prices are possible near-term. If September extends the aforementioned rally, April's high crossing at 75.31 is the next upside target. Closes below the 20-day moving average crossing at 74.31 would signal that a short-term top has been posted. First resistance is May's high crossing at 75.26. Second resistance is April's high crossing at 75.31. First support is the 20-day moving average crossing at 74.31. Second support is May's low crossing at 73.44.
The September Japanese Yen closed lower on Friday as it extends the trading range of the past two-weeks. The low-range close sets the stage for a steady to lower opening when Monday’s day session begins trading. Stochastics and the RSI are neutral to bullish signaling that sideways to higher prices are possible near-term. Closes above the 20-day moving average crossing at 0.073361 would signal that a short-term low has been posted. If September renews the decline off March's high, the 87% retracement level of the October-January rally crossing at 0.070777 is the next downside target. First resistance is the 20-day moving average crossing at 0.073361. Second resistance is the 50-day moving average crossing at 0.075131. First support is the 75% retracement level of the October-January rally crossing at 0.072174. Second support is the 87% retracement level of the October-January rally crossing at 0.070777.
PRECIOUS METALS? http://quotes.ino.com/ex?changes/?c=metals ""
August gold closed lower on Friday as it extends the trading range of the past four-weeks. The low-range close sets the stage for a steady to lower opening when Monday's day session begins trading. Stochastics and the RSI are neutral to bullish signaling that sideways to higher prices are possible near-term. Closes above the 50-day moving average crossing at $2016.80 would signal that a short-term low has been posted. If August renews the decline off May's high, the 38% retracement level of the 2022-2023 rally crossing at $1941.90. First resistance is the 20-day moving average crossing at $1988.30. Second resistance is the 50-day moving average crossing at $2016.80. First support is the 38% retracement level of the 2022-2023 rally crossing at $1941.90. Second support is the 50% retracement level of the 2022-2023 rally crossing at $1892.30.
July silver closed slightly higher on Friday as it extended the rally off May's low. The low-range close sets the stage for a steady to slightly lower opening when Friday's day session begins trading. Stochastics and the RSI are neutral to bullish signaling that sideways to higher prices are possible near-term. If July extends the rally off May's low, the 50-day moving average crossing at 24.711 is the next upside target. If July renews the decline off May's high, the 62% retracement level of the March-May rally crossing at 22.546 is the next downside target. First resistance is today's high crossing at 24.620. Second resistance is the 50-day moving average crossing at 24.711. First support is the 62% retracement level of the March-May rally crossing at 22.546. Second support is the 75% retracement level of the March-May rally crossing at 21.708.
July copper closed lower on Friday as it consolidates some of the rally off May's low. The low-range close sets the stage for a steady to lower opening when Monday's day session begins trading. Stochastics and the RSI are overbought but remain neutral to bullish signaling that sideways to higher prices are possible near-term. If July extends the rally off May's low, the 50-day moving average crossing at 3.8632 is the next upside target. Closes below the 20-day moving average crossing at 3.7046 is the next downside target. First resistance is today's high crossing at 3.8335. Second resistance is the 50-day moving average crossing at 3.8632. First support is the 20-day moving average crossing at 3.7046. Second support is May's low crossing at 3.5450.
GRAINS? http://quotes.ino.com/ex?changes/?c=grains "
July Corn closed down $0.06-cents at $6.04 1/4.
July corn post closed lower on Friday as it extends this week's trading range. The mid-range close sets the stage for a steady to lower opening when Monday's night session begins trading. Stochastics and the RSI are overbought but remain neutral to bullish signaling that sideways to higher prices are possible near-term. If July extends the rally off May's low, the 75% retracement level of the April-May decline crossing at $6.22 1/2 is the next upside target. Closes below last-Friday's low crossing at $5.81 1/4 would temper the near-term friendly outlook. First resistance is Monday's high crossing at $6.14. Second resistance is the 75% retracement level of the April-May decline crossing at $6.22 1/2. First support is last-Wednesday's low crossing at $5.77 1/2. Second support is May's low crossing at $5.47.
July wheat closed up $0.04-cents at $6.30 1/4.
July wheat closed higher on Friday. The high-range close sets the stage for a steady to higher opening when Monday's day session begins trading. Stochastics and the RSI are neutral to bullish signaling signaling that sideways to higher prices are possible near-term. Closes above the 50-day moving average crossing at $6.48 1/2 would open the door for a possible test of May's high crossing at $6.69 later this week. If July renews the decline off February's high, the March-2021 low crossing at $5.71 is the next downside target. First resistance is the 50-day moving average crossing at $6.48 1/2. Second resistance is May's high crossing at $6.69. First support is May's low crossing at $5.73 1/4. Second support is the March-2021 low crossing at $5.71.
July Kansas City Wheat closed down $0.07-cents at $7.97 3/4.
July Kansas City wheat posted an inside day with a lower close on Friday. The high-range close sets the stage for a steady to higher opening when Monday's day session begins trading. Stochastics and the RSI are turning neutral to bullish signaling that sideways to higher prices are possible near-term. Closes above the 50-day moving average crossing at $8.29 would signal that a short-term low has been posted. If July renews the decline off May's high, the 87% retracement level of May's rally crossing at $7.59 3/4 is the next downside target.First resistance is the 50-day moving average crossing at $8.29. Second resistance is the May 10th high crossing at $8.63 3/4. First support is the 87% retracement level of May's rally crossing at $7.59 3/4. Second support is May's low crossing at $7.36 1/4.
July Minneapolis wheat closed down $0.04-cents crossing at $8.11 3/4.
July Minneapolis wheat posted an inside day with a lower close on Friday. The high-range close sets the stage for a steady to higher opening when Monday's day session begins trading. Stochastics and the RSI have turned neutral to bullish signaling that sideways to higher prices are possible near-term. Closes above the 50-day moving average crossing at $8.36 would signal that a short-term low has been posted. If July renews the decline off May's high, May's low crossing at $8.69 is the next downside target. First resistance is the 50-day moving average crossing at $8.36. Second resistance is May's high crossing at $8.88 1/2. First support is the May 31st low crossing at $7.75 1/2. Second support is May's low crossing at $7.69.
SOYBEAN COMPLEX? http://quotes.ino.com/ex?changes/?c=grains "
July soybeans closed up $0.23 1/4-cents at $13.86 1/2.
July soybeans closed sharply higher on Friday as it extends the rally off May's low. The high-range close sets the stage for a steady to higher opening when Monday's day session begins trading. Stochastics and the RSI are overbought but remain neutral to bullish signaling that sideways to higher prices are possible near-term. If July extends the rally off May's low, the 50-day moving average crossing at $14.05 3/4 is the next upside target. Closes below the 20-day moving average crossing at $13.43 3/4 would signal that a short-term top has been posted. Closes below the 20-day moving average crossing at $13.43 3/4 would signal that a short-term top has been posted. First resistance is the 50-day moving average crossing at $14.05 3/4. Second resistance is May's high crossing at $14.46 3/4. First support is the 20-day moving average crossing at $13.43 3/4. Second support is May's low crossing at $12.70 3/4.
July soybean meal closed down $6.80 at $397.20.
July soybean meal closed lower on Friday. The low-range close sets the stage for a steady to lower opening when Monday's day session begins trading. Stochastics and the RSI are neutral to bullish signaling that sideways to higher prices are possible near-term. Closes above the 20-day moving average crossing at $407.40 would signal that a short-term low has been posted. If July renews the decline off March's high, the 62% retracement level of the 2020-2023 rally crossing at $365.60 is the next downside target. First resistance is the 20-day moving average crossing at $407.40. Second resistance is the 50-day moving average crossing at $428.20. First support is May's low crossing at $386.30. Second support is the 62% retracement level of the 2020-2023 rally crossing at $365.60.
July soybean oil closed up 209-pts. at 54.59.
July soybean oil closed higher on Friday as it extends the rally off May's low.The high-range close sets the stage for a steady to higher opening when Monday's day session begins trading. Stochastics and the RSI are overbought but remain neutral to bullish signaling that sideways to higher prices are possible near-term. If July extends the aforementioned rally, May's high crossing at 55.12 is the next upside target. Closes below the 20-day moving average crossing at 48.85 would signal that a short-term top has been posted. First resistance is May's high crossing at 55.12. Second resistance is the April 18th high crossing at 56.21. First support is the 20-day moving average crossing at 48.85. Second support is May's low crossing at 44.53.
LIVESTOCKhttp://quotes.ino.com/exchanges/?c=livestock
July hogs closed up $2.68 at $89.88.
July hogs closed higher on Friday and above the 50-day moving average crossing at 87.58. The high-range close sets the stage for a steady to higher opening when Monday's day session begins trading. Stochastics and the RSI are overbought but remain neutral to bullish signaling that sideways to higher prices are possible near-term. If July extends the rally off May's low, the April 28th high crossing at $94.00 is the next upside target. Closes below the 20-day moving average crossing at $83.62 would signal that a short-term top has been posted. First resistance is Today's high crossing at $90.20. Second resistance is the April 28th high crossing at $94.00. First support is Monday's gap crossing at $85.00. Second support is last-Wednesday's gap crossing at $79.53.
August cattle closed up $0.33 at $171.93.
August cattle closed lower on Friday as it extended the decline off Wednesday's high. The low-range close sets the stage for a steady to lower opening on Monday. Stochastics and the RSI have turned neutral to bearish signaling that a short-term top might be in or is near. Closes below the 20-day moving average crossing at $167.26 would signal that a top has been posted. If August extends this year's rally unto uncharted territory, upside targets will be hard to project. First resistance is Wednesday's high crossing at $178.10. Second resistance is unknown. First support is the 10-day moving average crossing at $171.15. Second support is the 20-day moving average crossing at $167.26.
August Feeder cattle closed up $0.43 at $239.08.
August Feeder cattle closed higher on Friday as it consolidates some of the decline off May's high. The mid-range close sets the stage for a steady to higher opening when Tuesday's day session begins trading. Stochastics and the RSI are neutral to bearish signaling that sideways to lower prices are possible near-term. Closes below the 20-day moving average crossing at $236.35 would signal that a short-term top has been posted. If August extends the rally off May's low, the October-2014 high on the monthly continuation chart crossing at $245.20 is the next upside target. First resistance is Wednesday's high crossing at $245.18. Second resistance is the October-2014 high on the monthly continuation chart crossing at $245.20. First support is the 20-day moving average crossing at $236.35. Second support is the 50-day moving average crossing at $229.76.
FOOD & FIBERhttp://quotes.ino.com/ex changes/?c=food
July coffee closed lower on Friday as it consolidates some of the rally off May's low. The low-range close sets the stage for a steady to lower opening on Monday. Stochastics and the RSI are neutral to bullish signaling sideways to higher prices are possible near-term. Closes above May's high crossing at $19.44 would open the door for a possible test of April's high crossing at $20.49. Closes below the 10-day moving average crossing at $18.37 would signal that a short-term top has been posted. First resistance is today's high crossing at $19.66. Second resistance is April's high crossing at $20.49. First support is the 10-day moving average crossing at $18.37. Second support is May's low crossing at $17.56.
July cocoa higher on Friday as it extends this year's rally. The high-range close sets the stage for a steady to higher opening on Monday. Stochastics and the RSI are overbought but remain neutral to bullish signaling that sideways to higher prices are possible near-term. If July extends the rally off March's low, monthly resistance crossing at 32.15 is the next upside target. Closes below the 20-day moving average crossing at 30.32 would signal that a short-term top has been posted.
July sugar closed lower on Friday, The low-range close sets the stage for a steady to lower opening on Monday. Stochastics and the RSI are neutral to bullish signaling that sideways to higher prices are possible near-term. If July extends this week's rally, the May 23rd high crossing at 26.22 is the next upside target. Multiple closes below Tuesday's low crossing at 24.23 would open the door for additional weakness near-term.
July cotton closed lower on Friday. The low-range close sets the stage for a steady to lower opening on Monday. Stochastics and the RSI are turning neutral to bearish signaling sideways to lower prices are possible near-term. Closes below the 50-day moving average crossing at 82.73 would signal that a top has been posted. If July extends the rally off the May 25th low crossing at 79.86, May's high crossing at 87.98 is the next upside target.
Thanks tallpine!
Upper Midwest is skinny on the upcoming rains:
7 Day Total precipitation below:
http://www.wpc.ncep.noaa.govcdx /qpf/p168i.gif?1530796126

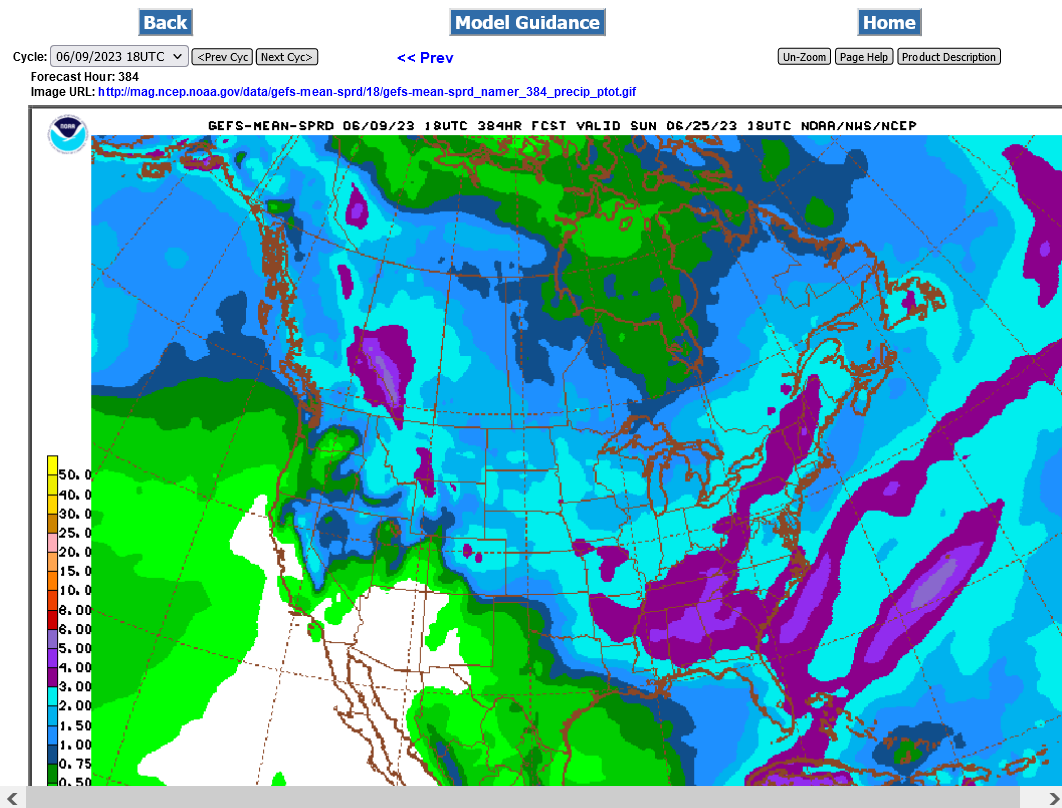
Last 18z GEFS rains the next 2 weeks:
Temperature Probability | Precipitation Probability (Experimental)  |