
A Great August 5th to you!
Scroll down and enjoy the latest comprehensive weather to the max!!
Alot of rain coming to many areas............especially by August standards(August/September are typically the 2 driest months) about the same compared to yesterday's week 1 forecast on NWS maps below, although rains are slowly marching s/se. Number #1 producer Iowa is a big winner.
Still...........maybe a dry slot southwest Cornbelt.
The latest rain forecasts are below...........broken down into each period coming up. Then the 1 week totals.
Day 1 below:
http://www.wpc.ncep.noaa.gov/qpf/fill_94qwbg.gif?1526306199054

Day 2 below:
http://www.wpc.ncep.noaa.gov/qpf/fill_98qwbg.gif?1528293750112

Day 3 below:
http://www.wpc.ncep.noaa.gov/qpf/fill_99qwbg.gif?1528293842764

Days 4-5 below:
http://www.wpc.ncep.noaa.gov/qpf/95ep48iwbg_fill.gif?1526306162

Days 6-7 below:
http://www.wpc.ncep.noaa.gov/qpf/97ep48iwbg_fill.gif?1526306162

7 Day Total precipitation below:
http://www.wpc.ncep.noaa.govcdx /qpf/p168i.gif?1530796126

Excessive Rainfall threat. Shifts slowly south and southeastward this week. New areas of heavy rain possible because of progression. Rains almost entirely beneficial. See maps below:
Current Day 1 Forecast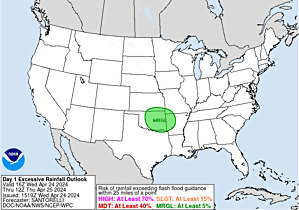 |
Day 1 Threat Area in Text Format
Current Day 2 Forecast |
Day 3 forecast below
Severe Storm Risk. Hit the map for full screen. Central Plains/ Midwest/W. Great Lakes today..............then shifting slowly southeast every day.
https://www.spc.noaa.gov/products/outlook/
Current Day 1 Outlook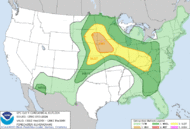 | |
Current Day 2 Outlook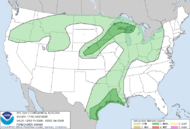 | |
Current Day 3 Outlook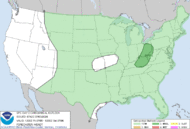 | |
Current Day 4-8 Outlook |
High Temperatures today and Monday. Heating up in some places(Southwest/S.Plains/SW Cornbelt/East Coast.
N.Rockies/N. Plains/U. Midwest pleasant.


Dew points. 70+ on this scale makes it feel uncomfortable(sticky air)! Getting more humid with southerly winds over the eastern half of the country....but this moisture will be converted to rains over the next week as it pools towards the cold front which will be slowly sinking south.

Heat and high humidity COMBINED. Feels like temperature. Feeling sultry over much of the country.
https://www.youtube.com/watch?v=X8Ow1nlafOg

Highs days 3-7.
Cooling nicely for a few days, Eastern Lakes and vicinity. Intense heat West............that shifts east .........spilling into the N.Plains, while Pacific Northwest cools.

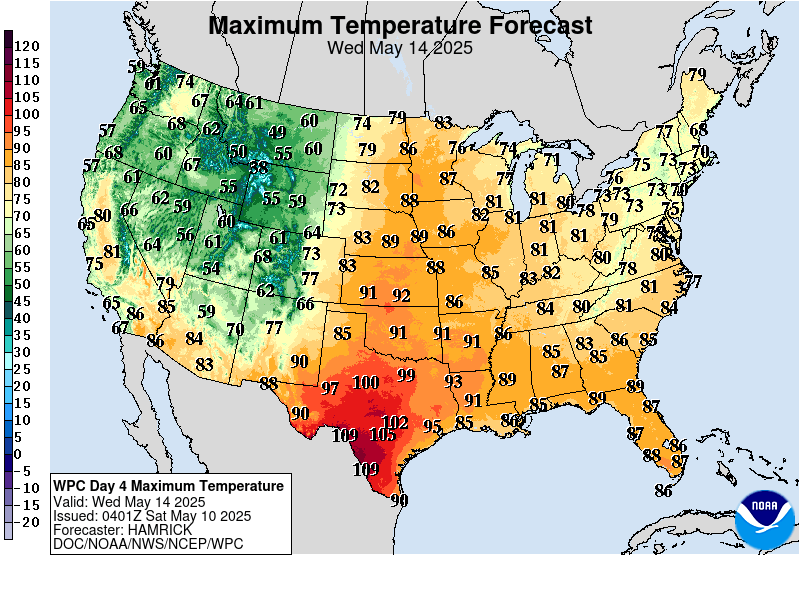


How do these days 3-7 temperatures compare to average at this time of year? We have now past the climatological time of year when temperatures are the hottest.
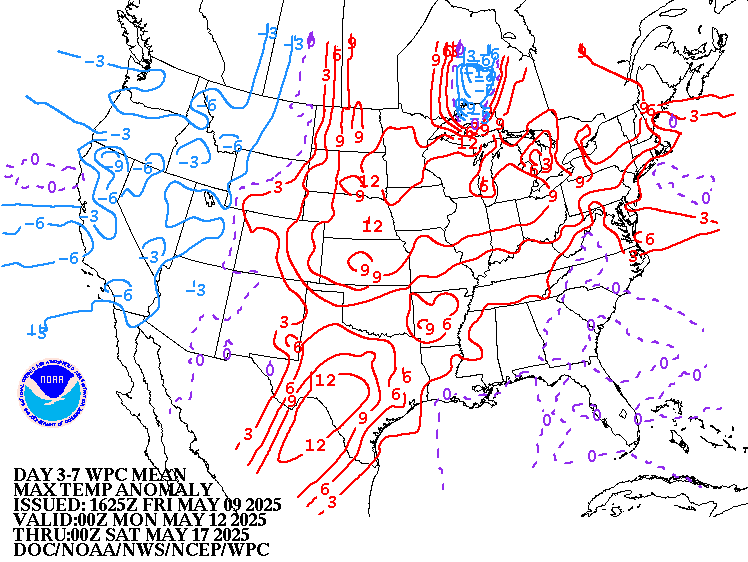
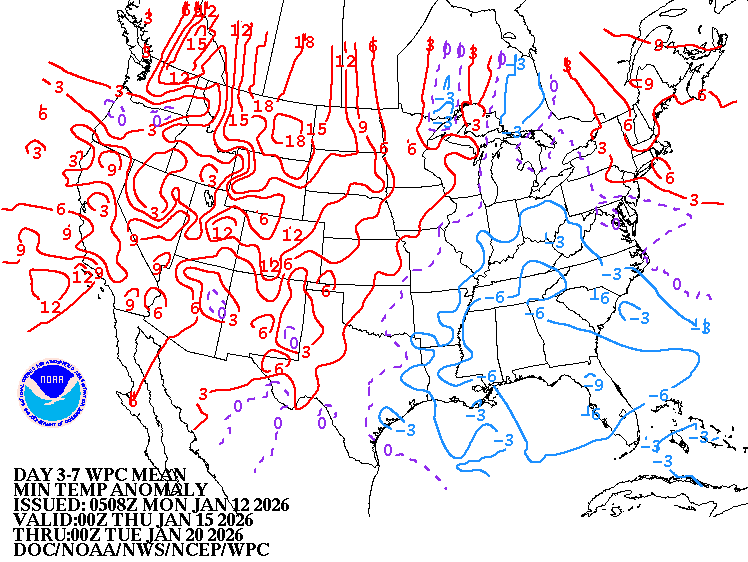
Above average West/Rockies to N.Plains and eventually Upper Midwest. Northeast has somee warm days/nights.
High temperature departures:
Low Temperature Departures:
Weather system from Plains to Great Lakes. High pressure Southeast.
https://weather.com/maps/currentusweather

Satellite picture. Clouds in the Upper Midwest to Plains.

Rains the past 24 hours. N/C.Plains to Upper Midwest to W.Great Lakes(Northern IA/Southern MN heaviest).
![]()
Missouri to S.Plains in bad shape....too dry. Some relief headed that way. 
You can go to this link to see rain totals from recent time periods:
https://water.weather.gov/precip/
Go to precipitation, then scroll down to pick a time frame. Hit states to get the borders to see locations better. Under products, you can hit "observed" or "Percent of normal"
Below are rains compared to average of the last 7, 14, 30 and 60 days.
https://www.atmos.illinois.edu/~snodgrss/Ag_Wx.html


Drought Monitor. This product is updated every Thursday.
http://droughtmonitor.unl.edu/Maps/CompareTwoWeeks.aspx

The product below has not been updated the past 2 days.........not sure why. I apologize for not recognizing that in yesterdays update. Disregard the 2 day old maps/descriptions below. I'm keeping it here to let you know that yesterdays version, which was a day old, presented by me below was not right. Todays is off by 2 days.
Temperature Anomalies from GFS ensembles(fairly reliable product) going out 2 weeks. These maps show the Northern Hemisphere. The map of the US is front center. Look for the state borders in white.
Today: Heat spills into the Plains.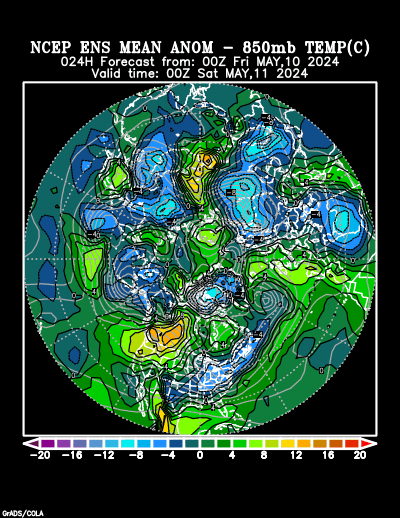
In 5+ days:
Heat builds again West.............ready to push into the N.Plains again. Left over cool air East.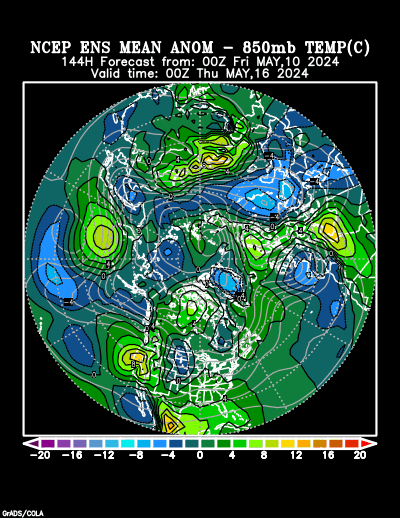
In 10+ days Hot West spilling into Plains/Upper Midwest. Not too hot Southeast.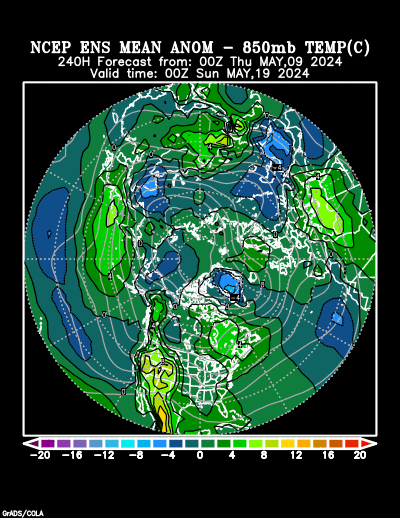
Day 15 Hot to Very Warm across most of the country.......especially North compared to average.
Here is the 0Z GFS ensemble mean average for 500 mb........same product above with the temp anomalies above.........that isn't updated but this is updated.
It looks MUCH different than the previous 2 days for late week 2. Yesterday showed an impressive upper level heat ridge building from the C/S Plains to the East Coast. This would bring major heat to the Plains, Midwest and East.
Today, the upper level heat ridge is trying to rebuild again farther west with a trough and cooler temperatures in the East.
Active tropical systems in the Pacific for the next 2 weeks are going to mess up week 2 forecasts for awhile downstream!
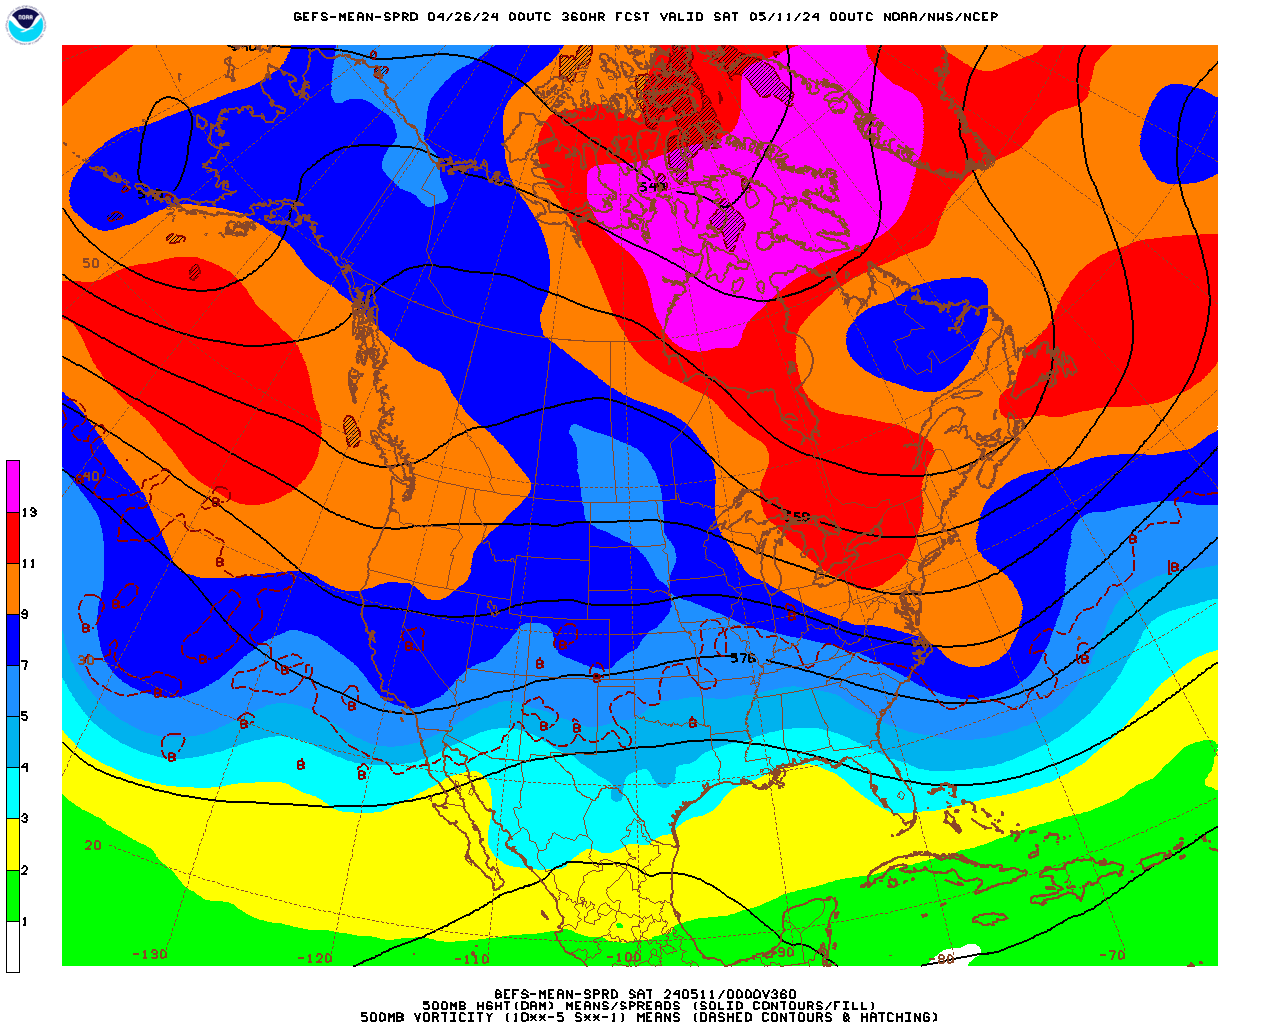
The Canadian model ensembles, still have some members that disagree, with the ridge in the east and some completely the opposite.............a deep upper level trough Midwest/Northeast.
Active tropical systems in the Pacific for the next 2 weeks are going to mess up week 2 forecasts for awhile downstream!
384h GZ 500 forecast valid on Aug 21, 2018 00 UTC
Forecasts for the control (GEM 0) and the 20 ensemble members (global model not available)
The low skill, longer range CFS model for weeks 3 and 4. Unstable/changeable pattern.
Since week 2 is discombobulated by big data changes in the very active Pacific during week 1, what can we say about weeks 3 and 4?

Precip below:

By frey_1999 - Aug. 5, 2018, 11:26 a.m.
with the changes in weather one should look for a stronger open on Sunday night in the Grains and would think that Natty is also stronger on the open.
Thanks very much frey and welcome back.
It seems like we have seen these types of maps on sundays before only to see it fade as the time frame comes closer. I think we may get to trend on corn and beans but by no means is it a given at this point.
I was actually thinking that the overnight maps looked less bullish and the main bullish item was the 6-10/8-14 day forecasts from yesterday.
Not really sure because there are alot of unusual forces pushing the markets that are not normally there in early August.
The tariff war in grains/beans. Europe's drought in wheat. Very low storage in ng.
This were today's NWS extended forecasts.
I'll just copy my comments from yesterday/Saturday below and note that the biggest change today in these computer generated maps(no human influence dialed in) are significant in the the 8-14 day........the result of more upper level ridging in the Southeast, pumping up more Gulf moisture. So that forecast is MUCH wetter in the north and also the West..................where it is also MUCH, MUCH cooler........going from much above temps to below temps in some places.
Previous discussion:
Since Thursday, I've been seeing the guidance in week 2, especially late in week 2, moving all the main weather features..........so that the maps below will be looking different.....in my current opinion....which changes like the winds-which is a good thing if you want the latest updates (-:
The 6-10 day below has a decent chance of verifying, especially early in the period........very warm/hot and dry north........wet south?
After that, the 8-14 day outlooks are even more uncertain that the usual uncertainty of those week 2 forecasts. WxFollower will tell you that this is exactly what makes following the weather so much fun and challenging. You might like 75-80 degrees and clear skies every day(with an inch of rain once a week during the growing season) but weather geeks prefer more interesting stuff.
We don't wish for bad things............hurricanes, tornadoes, record heat/cold, flooding and weather that hurts people but are fascinated with analyzing the scientific aspect...........especially the part that is constantly changing every day.
Some of us with public forecasts are committed to assisting others by providing timely weather information that can be used to make important decisions. Commodity traders and Farmers know that the weather effects the price of things that they own or trade. However, almost everybody needs to know the weather at various times during the year. .....whether it's for planning an outdoor event, planning for an upcoming snowstorm(where will the kids go if there is no school on Thursday?) or if there is the threat of severe weather(should I plan to go to the basement?).
6-10 day Temperature Probability | |
Precipitation Probability | |
8-14 day Temperature Probability | |
Precipitation Probability | |
Latest 12z Canadian ensembles(and the mean at the top). Upper level trough in the West, Upper level Ridge downstream(maybe the Southeast?)
This is 100% the opposite of the late week 2 forecasts from late last week on NWS outlooks.
Instead of the dry forecasts for the Upper Midwest/N.Plains with the week 2 pattern forecast, this would bring wet weather to those areas and also farther west.................and the heat would shift from the west to points farther east.....but this is extremely uncertain.
384h GZ 500 forecast valid on Aug 21, 2018 12 UTC
Forecasts for the control (GEM 0) and the 20 ensemble members (global model not available)
Look at the 12z GFS ensemble average and the much farther west location of the upper level features.........an upperr level trough in the Northeast too.
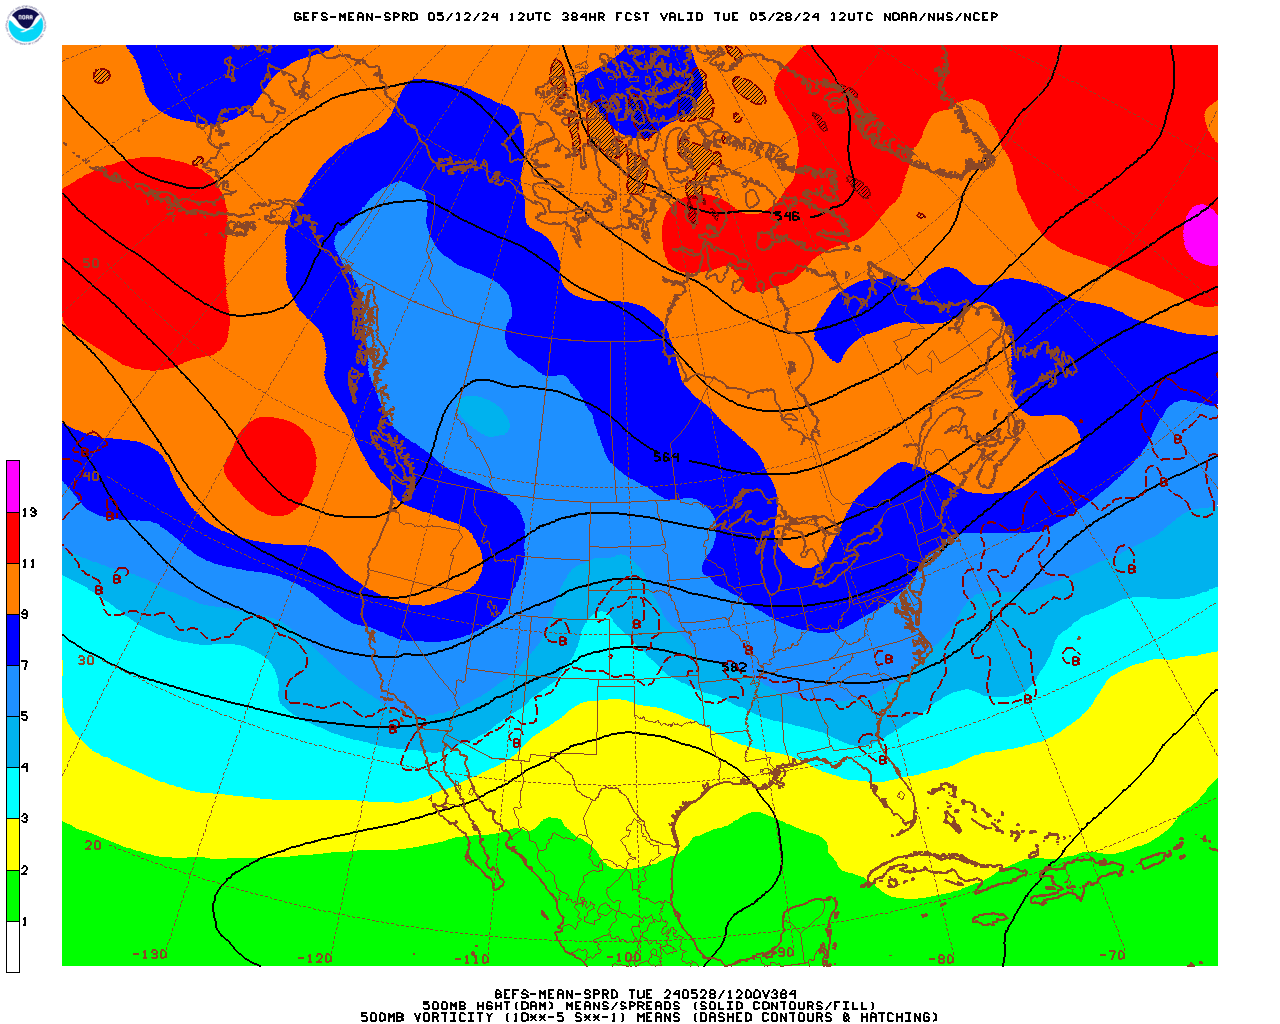
Just over half of the individual members of the 12z ensemble mean have a very impressive dome/heat ridge in the center of the country!

The product below, actually combines the Canadian and GFS ensembles and comes up with this for the upper level features at the end of 2 weeks.............a compromise for the location of the Upper level ridge.......about half way between the 2.
https://weather.gc.ca/ensemble/naefs/cartes_e.html

It is on the wet side though-map below

The European control model has the upper level ridge much farther west: