For weather that effects the natural gas market(Cooling Degree Days in the Summer help gauge residential natural gas use because natural gas is used to generate electricity for air conditioning:
https://www.marketforum.com/forum/topic/9901/
Monday Morning:
Weather slightly cooler overnight vs a couple of days ago, but still some heat in the forecast and storage is LOW!
Storage is LOW for this time of year!! This is why the temperature forecast matters.
Storage is at the very bottom of the 5 year average:

Storage +35 Billion Cubic Feet-Bullish last Thursday for the 3rd straight week!
Heat in the West to TX caused drawdowns in the Pacific and South Central regions.
| Working gas in underground storage, Lower 48 states Summary textCSVJSN | |||||||||||||||||||||||||
|---|---|---|---|---|---|---|---|---|---|---|---|---|---|---|---|---|---|---|---|---|---|---|---|---|---|
| Historical Comparisons | |||||||||||||||||||||||||
| Stocks billion cubic feet (Bcf) | Year ago (07/27/17) | 5-year average (2013-17) | |||||||||||||||||||||||
| Region | 07/27/18 | 07/20/18 | net change | implied flow | Bcf | % change | Bcf | % change | |||||||||||||||||
| East | 552 | 527 | 25 | 25 | 647 | -14.7 | 650 | -15.1 | |||||||||||||||||
| Midwest | 552 | 524 | 28 | 28 | 752 | -26.6 | 707 | -21.9 | |||||||||||||||||
| Mountain | 146 | 145 | 1 | 1 | 200 | -27.0 | 178 | -18.0 | |||||||||||||||||
| Pacific | 250 | 257 | -7 | -7 | 293 | -14.7 | 313 | -20.1 | |||||||||||||||||
| South Central | 808 | 820 | -12 | -12 | 1,104 | -26.8 | 1,025 | -21.2 | |||||||||||||||||
| Salt | 203 | 214 | -11 | -11 | 298 | -31.9 | 279 | -27.2 | |||||||||||||||||
| Nonsalt | 604 | 606 | -2 | -2 | 806 | -25.1 | 746 | -19.0 | |||||||||||||||||
| Total | 2,308 | 2,273 | 35 | 35 | 2,996 | -23.0 | 2,873 | -19.7 | |||||||||||||||||
Prior to the report, consensus had settled around a build in the low 40 Bcf range, in line with the five-year average. Kyle Cooper of IAF Advisors had projected a 40 Bcf build, while Genscape Inc. expected a 45 Bcf injection. A Bloomberg survey had a range between 25 Bcf and 58 Bcf, with the median response of survey participants coming in at 43 Bcf. Intercontinental Exchange settled at 43 Bcf.
The EIA’s reported 35 Bcf build was 5 Bcf below projections by Bespoke Weather Services, which said “today’s print continues to demonstrate a tight market (albeit one that has loosened slightly from last week’s print).
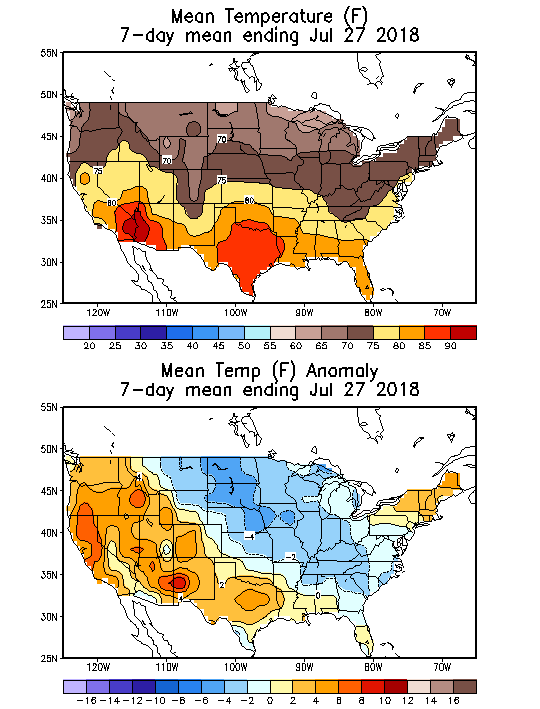
These were the temperatures for the 7 day period for that last EIA report.......hot in the West to TX..........much cooler than the previous week, especially Midwest..... so a bigger injection was expected.
With 3 bullish(low) injections in a row and low storage, expectations and reactions to this coming Thursday's EIA number will be a huge factor for trading this week.
One way to estimate that number is to look at temperatures that occurred during the 7 day period covered for this next report and compare them to the temps from the last report(above) which featured a +35 bcf injection. Here they are:
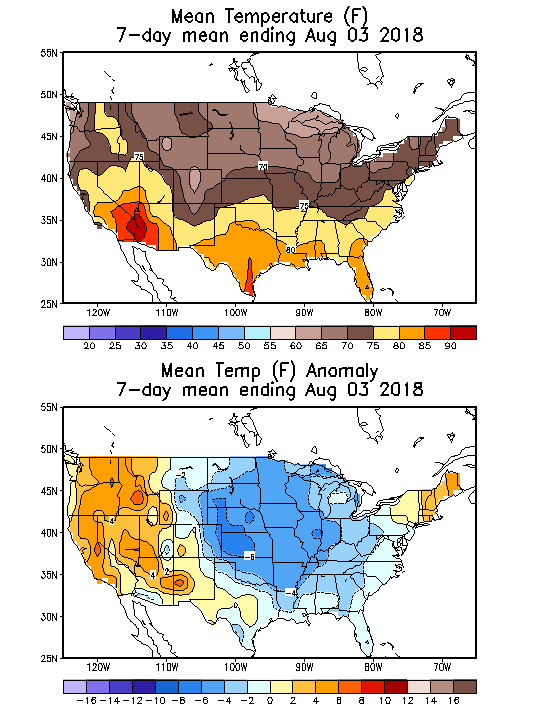
Let's see if I can put them on the same page to have a better close up comparison. The first 2 maps are the temps/departure for last weeks +35 bcf. The 2nd 2 maps are the temps/departure for this weeks number. Who wants to point out the changes?
Natural gas breaking out to the upside? Got some tough resistance ahead but storage data and weather are bullish(expections for big increases in supplies coming soon are bearish):
| Natural gas 3 months |
Naturalgas 1 year below
Naturalgas 5 years below
| Naturalgas10years below
|
Seasonals based on historical prices.

By WxFollower - Aug. 2, 2018, 4:03 p.m.
Today's EIA of +35 was, as noted by Mike, quite bullish. That includes in relation to the DJ news survey average, which had +44. So, it was a 9 bcf bullish miss for that. The prior two were also quite bullish with bullish misses of 10 bcf last week and 12 bcf the week before. One miss of 9 bcf is notable but I normally don't put too much weight on it for the longer term because of the chance of it being due to a statistical anomaly. However, three 9+ misses in a row in the same direction is very notable and significantly lessens the chance that there's merely a statistical anomaly.
When was the last times there were three weeks in a row that missed the DJ News survey average by 9+ bcf on the bullish side? Way back in November of 2011! Here is the data:
Week ending 11/11/11: actual missed 15 bcf to the bullish side
Week ending 11/18/11: actual missed 10.5 bcf to the bullish side
Week ending 11/25/11: actual missed 11 bcf to the bullish side
+++++++++++++++++++++++++++++++++++++++++++++++++++++++++++++++++++++++++++++++++++++++++
By WxFollower - Aug. 3, 2018, 12:31 p.m.
Hey Mike et al,
The semi-reliable/decent skill ensemble model consensus (GFS and Euro) for 0Z today vs 0Z yesterday was a few CDDs hotter for weeks 1 & 2, combined. That was enough when combined with follow through from yesterday's solidly bullish EIA to cause a pretty good rally this morning on top of yesterday's pretty strong rally on the EIA report, itself. The CFS is, as you showed, significantly cooler weeks 3-4 vs yesterday. The market didn't care much, if any, about it as it stayed strong. That model often bounces around like a ping pong ball like it has in recent days and is, therefore, hard for the market to take seriously most of the time. Also, it has a significant cool bias. As mentioned a few days ago, 30 year climatology is actually more accurate than the CFS by day 10! The market rallied on the slightly hotter much more reliable weeks 1-2 guidance and essentially ignored the cooler "entertainment" shown for weeks 3-4.
Now let's see what the 12Z model consensus will show.
By the way, thanks, Mike for all that you do at this board! You're awesome!
+++++++++++++++++++++++++++++++++++++++++++++++++++++++++++++++++
By metmike - Aug. 3, 2018, 10:58 p.m.
You're welcome Larry!
Am wondering if industrial demand is a bit stronger than expected and part of the increased demand that is causing these bullish surprises on the EIA storage reports.
I have not analyzed what regions are the most bullish with regards to guesses and don't know if its been consistently the same region(s) that are using up more gas than expected.
We have been having drawdowns in the Southcentral and Pacific regions because of the intense heat from Texas to the West but the storage injection guessers have all known what the CDD's have been in the entire US for the past 3 weeks and would have dialed in the appropriate numbers, weighted for population in those areas....but we had bullish surprises in each of those weeks.
I remember in late 2008 and especially early in 2009, we were having some pretty bearish(smallish) drawdowns for the amount of HDD's because of sluggish demand in the industrial sector as a result of the big economic slowdown.
It would make sense, right now if the opposite is happening............industrial demand for natural gas ramping up with the economy roaring. What do you think Larry?
Supplies have increased significantly. According to most accounts, supplies coming to the market have been setting records recently. Expectations for this growth to continue are what's keeping a lid on prices..........which should be at $3, based on previously/past low storage and forecast heat coming up.
Mike,
To answer your Q: slightly cooler Midwest, SE, TX, and Rockies. Near the same in NE US and west coast states. Going on memory, nationally weighted CDDs are down around 4 to near 79 vs prior week.
I figured that you would have the answer..........thanks again!
Mike,
You're welcome. However, I remembered incorrectly. The latest week's CDDs were actually at 76 rather than at 79. So, that means a drop of 7 CDDs from last week's 83 rather than just a 4 CDD drop.
Natural Gas Intelligence Monday Morning:
September Natural Gas Called Lower as Weather Models Turn Cooler
8:53 AM
September natural gas prices were set to open Monday almost 3 cents lower at $2.823 as the latest weather guidance was mixed but showed less sustained heat in the medium and long term.
I believe the idea that NG was down early on cooler 2 week models/forecasts vs Friday and vs Sunday. The bulk of this was for the period 8/13-16 or early week 2. However, regarding the later morning rise, I don’t think that was wx related but rather probably related to leftover bullishness from the 3 prior EIA reports and the related persistent storage deficits. Also, I had the 12Z models as mixed, a neutral signal.
Thanks Larry,
Interesting how we like to guess what caused natural gas to move the way it did.
Models were not as warm today as they were Friday, so certainly one would think the weather was less bullish.............and that was a good reason for ng to be lower overnight and during part of the morning.
A few weeks ago, a forecast with less heat might have kept the selling pressure on but the mentality may have changed because of 3 bullish EIA reports in a row.
So we held Friday's lows(actually during the overnight session on Thursday Night), which provided enough support.
The 12z GFS was cooler overall and that caused a bit of a dip before noon when it was coming out but we continue to see support being bought now.....with a different mentality.........buy the dips, instead of sell the bounces.
Question is will we get above Friday's highs? After looking at the charts again, it seems like the question might be WHEN will we break higher?
If the models turn decisively hotter, then that seems like a no brainer. If we morph to gradually cooler, will this tough resistance hold?
Looks like cash prices are well above $3 with the current heat as low storage is effecting it. The front month, Sept is battling to stay down.
Closing comments from Natural Gas Intelligence:
September Natural Gas Holds Steady as Market Awaits Fresh News; Spot Gas Up Again
September natural gas prices were about as exciting as a paint-drying viewing party Monday as traders still had last week’s low storage injection fresh on their minds even as weather guidance was expected to turn cooler as the week progresses. Spot gas prices were mostly higher as hot weather returned to key demand regions early in the week. The NGI National Spot Gas Average rose 22 cents to $3.19. Read More