I messed up in copying his report yesterday but here is the last one from this morning.
THE BEST WX ON THE INTERNET FOR FREE!
https://www.youtube.com/watch?v=ThsMsP5sF0s
+++++++++++++
I guess no updates on Friday because of the holiday.
Great discussion here on the stratosphere and polar vortex. This guy is a good source!
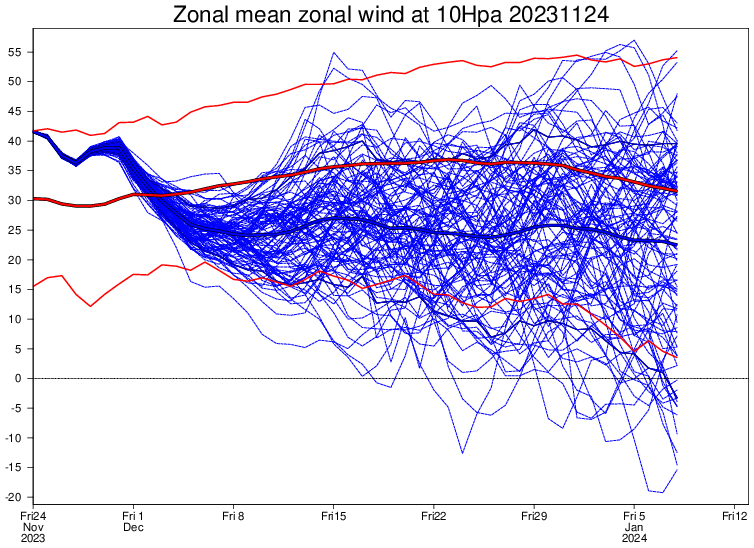
The last few days of Euro Weeklies have shown an even weaker SPV for Dec as a whole! The Euro mean (thick blue) on this latest run (11/24) has the 60N winds up in the strat. (at 10 mb) in mid to late Dec at only ~2/3 the climo mean (thick red) and has ~20% of the members dipping below 0, meaning a major SSW in either 2nd half of Dec or early Jan (20% for that period is above avg for that early in season):
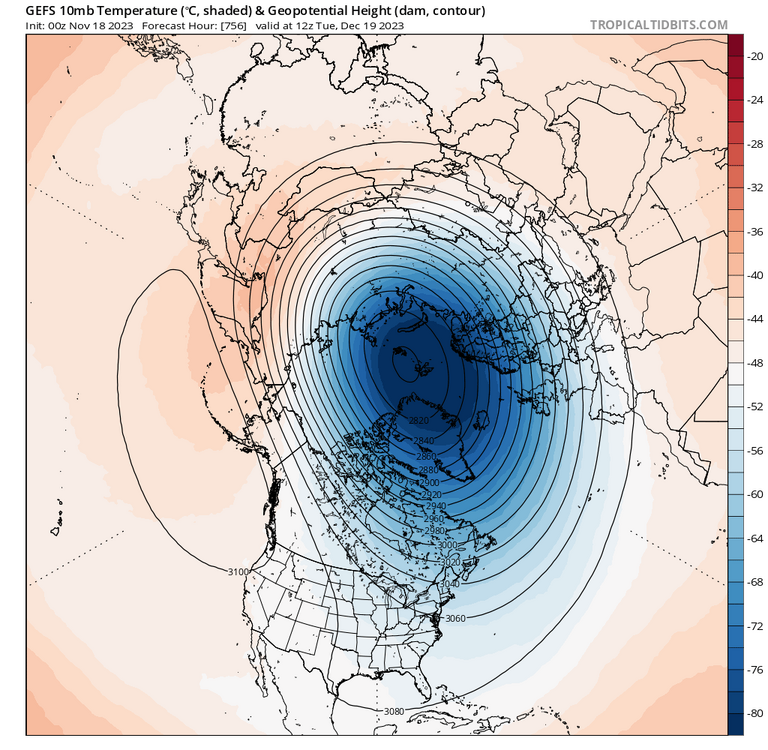
Consistent with the 11/24 Euro, the 0Z 11/24 GEFS run for 12/19 has a hint of a potential major SSW soon after this (~12/20+): note how much warmer is W Siberia to NW Can, further N/stronger S AK high, and sig weaker SPV on this vs 11/18 run map below: these strong trends are hints of an increasing shot at a SSW ~12/20: if a major SSW actually happens, look out for the chance for a very cold Jan in the E US:
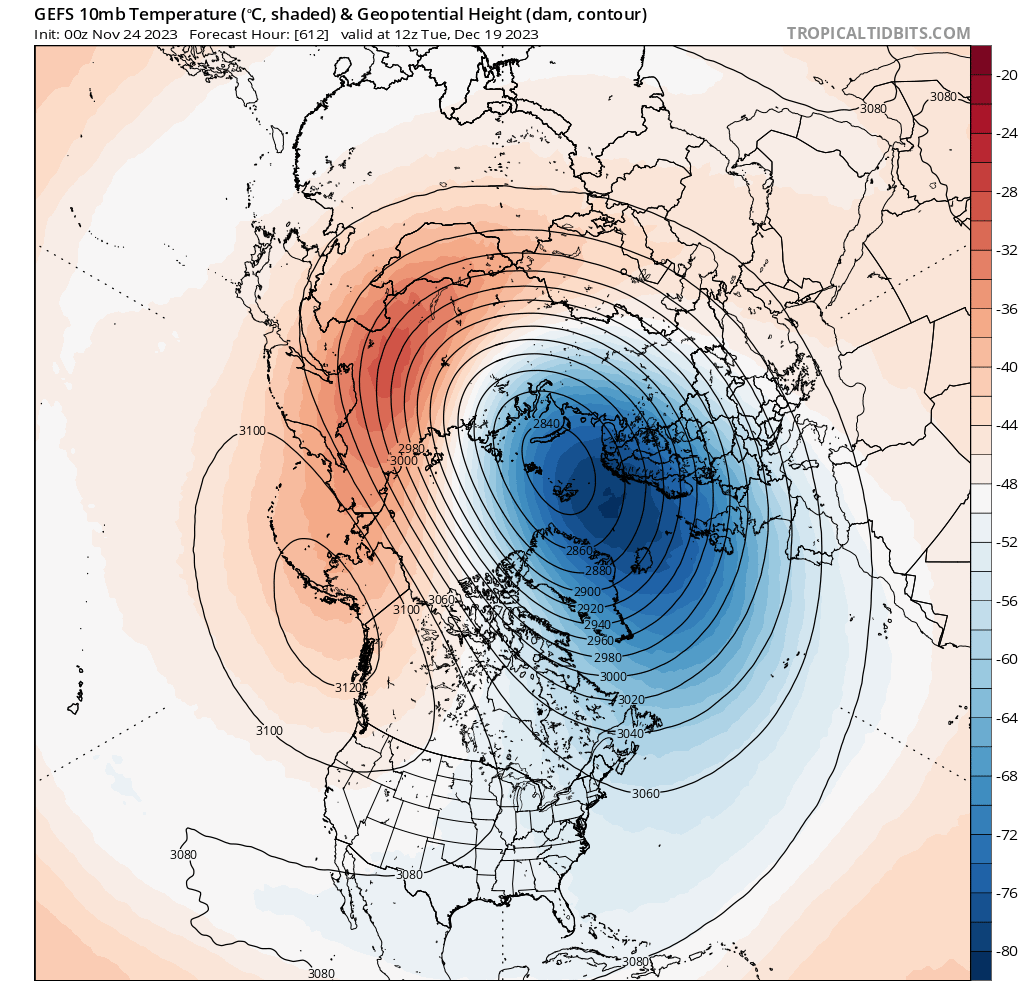
Compare that top map to what the extended GEFS showed just 6 days earlier for 12/19:
Thanks Mike
Larry,
This is a wonderful contribution and sources.
If you don't mind sharing the sources because I'd like to add it to mine.
It's great too if it requires a subscription as I might be willing to pay a small fee to get that same stuff.
Thanks!
Euro Weeklies’ 10 mb 60N winds:
https://charts.ecmwf.int/products/extended-zonal-mean-zonal-wind?area=nh&base_time=202311240000
0Z GEFS 10 mb temp/ht N Hem:
Thanks much, Larry!
The 12z run of the Canadian model has the coldest solution of all the models.
Here is the average/mean, then individual ensembles for 384 hours.
The surface solutions on just over half of them suggests some pretty cold air, unlike the NWS 8-14 day, copied below it.
384h GZ 500 forecast valid on Dec 11, 2023 12UTC


++++++++++++++++++++++++++++++++++++
384h sea level pressure forecast valid on Dec 11, 2023 12UTC


+++++++++++++++++++++++
https://www.cpc.ncep.noaa.gov/products/predictions/814day/index.php
The last run of the 0z Canadian model was NOT AS COLD.
https://weather.gc.ca/ensemble/charts_e.html?Hour=384&Day=0&RunTime=00&Type=gz
https://weather.gc.ca/ensemble/charts_e.html?Hour=384&Day=0&RunTime=00&Type=pnm
For numerous days, the GEFS ensembles have shown a positive anomaly over EastCentral Canada which would teleconnect well to high latitude blocking and lower heights in the mid latitudes of the US......that could be a source for cold air being flushed south out of Canada.
It a bit weaker today and the brand of cold coming from this pattern is moderate because EastCentral Canada will have record warmth in this kind of pattern.
Record warmth in that region that is shoved bodily south into the Eastern US will be relatively chilly by mid latitude standards but not bonified Arctic air.
Of course, Siberian air masses with cross polar flow are the coldest(because thats the largest land mass to brew extreme cold in the dark Winter nights with no solar radiation...........perpetual darkness means perpetual heat to space at this time of year....... unless the heat is advected in from elsewhere or trapped by clouds.
The positive anomaly below has LESS magnitude than the past 5 days and at this point, with mostly zonal flow in the US, is going to be a source for MILD temps in Canada which means the source region for any U.S. cold will also be very mild vs average.
https://www.psl.noaa.gov/map/images/ens/z500anom_nh_alltimes.html
+++++++++
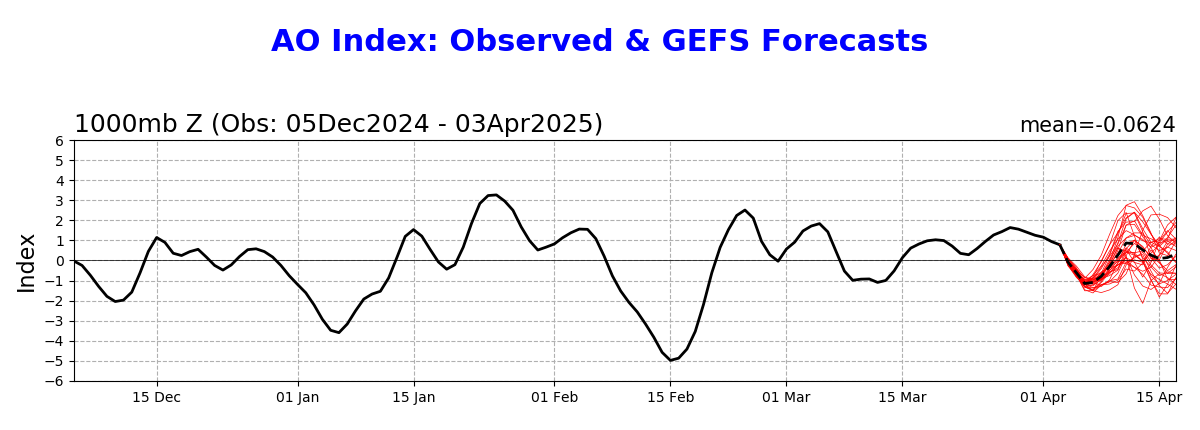
The AO below is spiking EXTREMELY LOW and helped usher is the current cold but is increasing but still negative which is a reflection of the positive anomaly in Canada above and modestly lower anomalies in the Southeast US(with the best chance for below temps in Larry-Land).
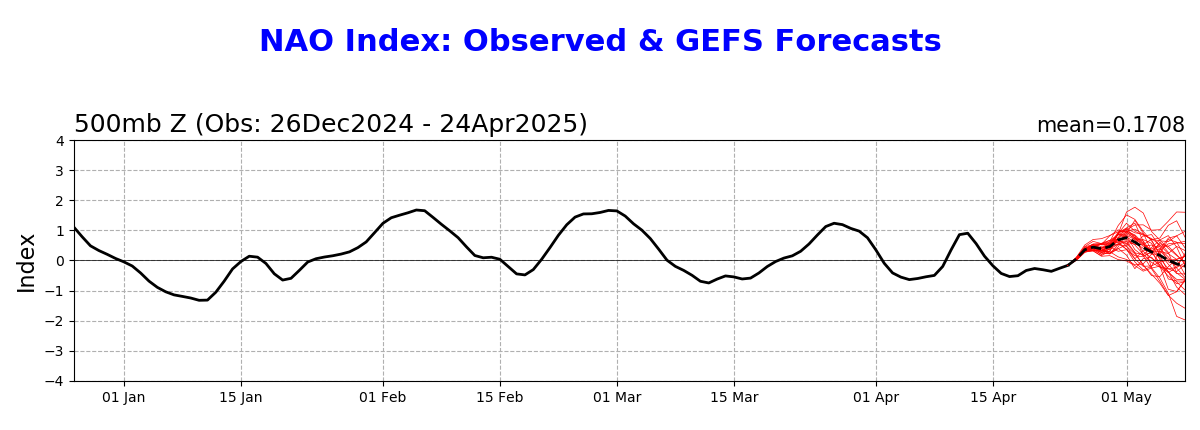
The spike lower in the NAO is also good for the cold to flush pretty far south but it increases, almost back to 0 by the end of 2 weeks.
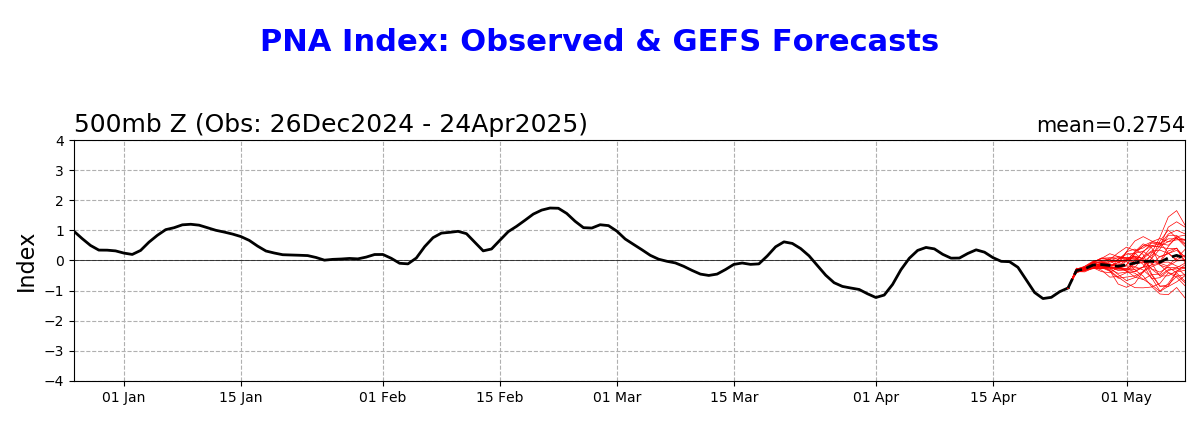
PNA is flat. We need that to be positive in order to favor cold, downstream in the Midwest and East.
Arctic Oscillation Index, North Atlantic Oscillation Index, Pacific North American Index.
https://www.cpc.ncep.noaa.gov/products/precip/CWlink/daily_ao_index/ao.shtml
https://www.cpc.ncep.noaa.gov/products/precip/CWlink/pna/nao.shtml
https://www.cpc.ncep.noaa.gov/products/precip/CWlink/pna/pna.shtml
+++++++++++
I copied the same map above for 360 hours, at 144 hours, which is 6 days so you can see the what the maps look like when the AO and NAO are spiking lower.
Extremely amplified positive anomaly in Northeast Canada but sort of isolated/small size but the models weaken it after this peak period and it never turns into a blocking type feature/pattern (long lasting) type dynamic. https://www.psl.noaa.gov/map/images/ens/z500anom_f144_nhbg.gif
That can change as the models try to figure out how to balance this northern stream, against the back drop of the powerful El Nino generated jet stream farther south that will try to oppose the cold.
The last 0z Canadian model ensembles has some pretty cold./bullish members.
A couple of them have the polar vortex over the Great Lakes in 2 weeks. Gefs doesn’t have that at all.
Thanks much, cutworm!
This is great!
European model is MUCH milder than any run of the last several days.
South American rain discussion starts 19:50
thanks, cutworm!
Thanks much, cutworm!
You’ve helped chip in with several much appreciated contributions this week!
Great pictures of the Mississippi river at Memphis
Thanks much, cutworm!
Really cool animation of the extent of sunshine at about 3:28
thanks, cutworm!