YouTube·GavsWeatherVids·Dec 20, 2023
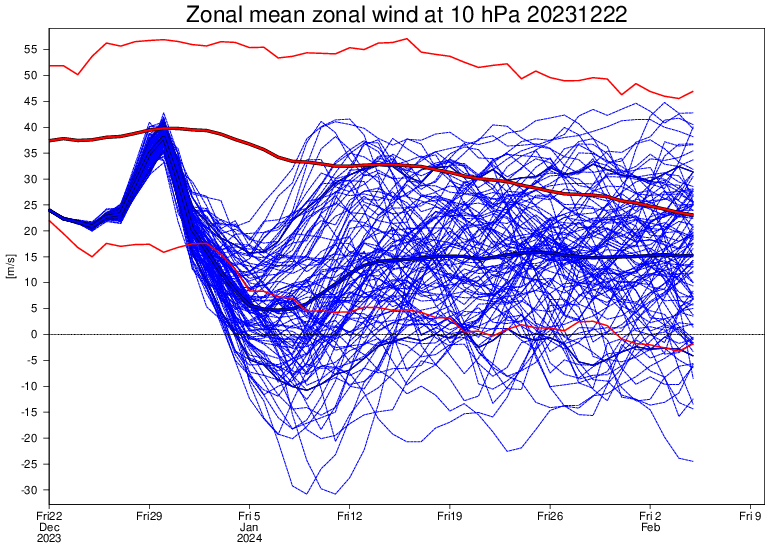
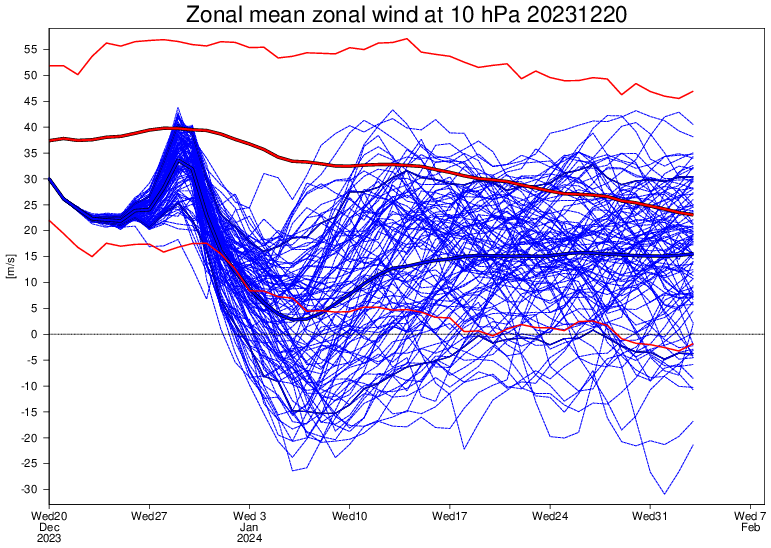
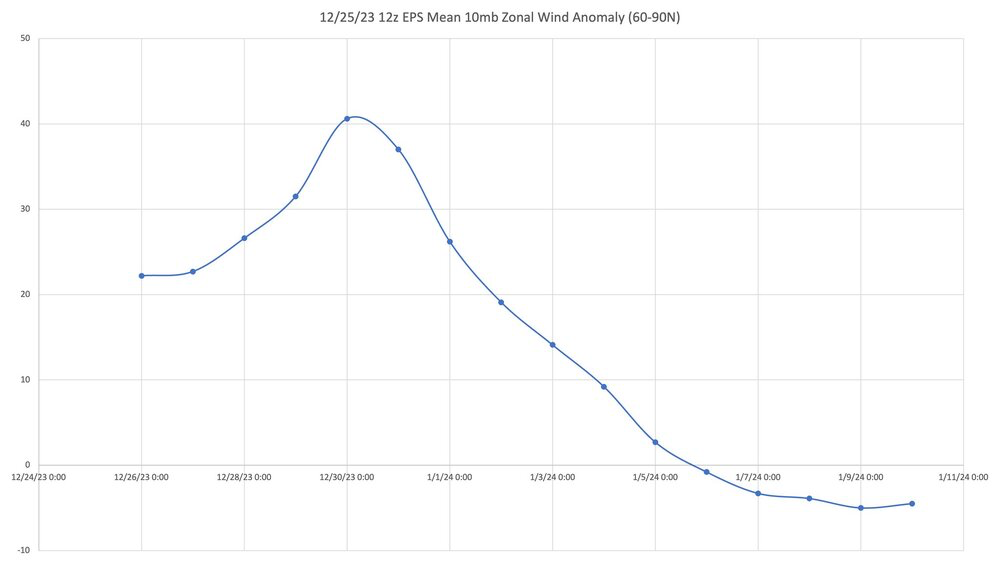
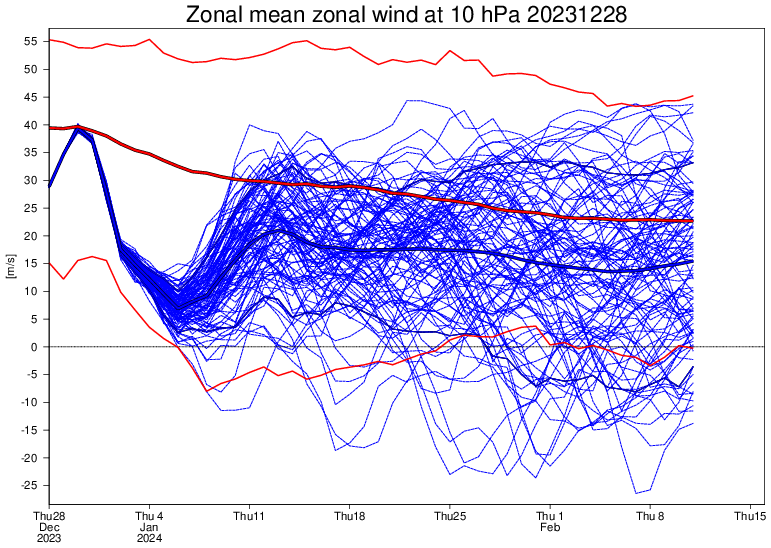
Today’s EE extended has markedly increased the chance for a major sudden stratospheric warming (SSW) in early Jan. I estimate 40+ just for 1/2-9, alone. This run has by far the weakest SPV/strongest concentration of members with major SSWs of any run for Jan 2-13 with the mean 60N 10 mb wind dipping to a mere +3 on Jan 7th vs a climo mean of +33! The lowest mean of any day prior to this run was +11 to +12:
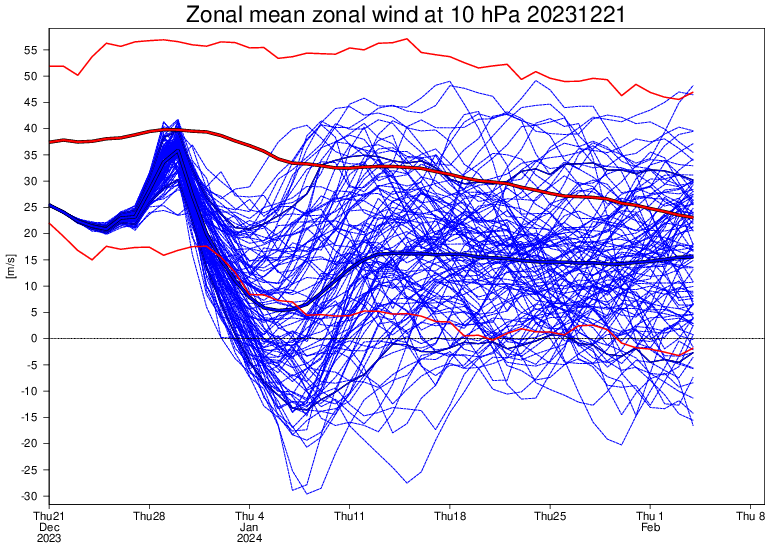
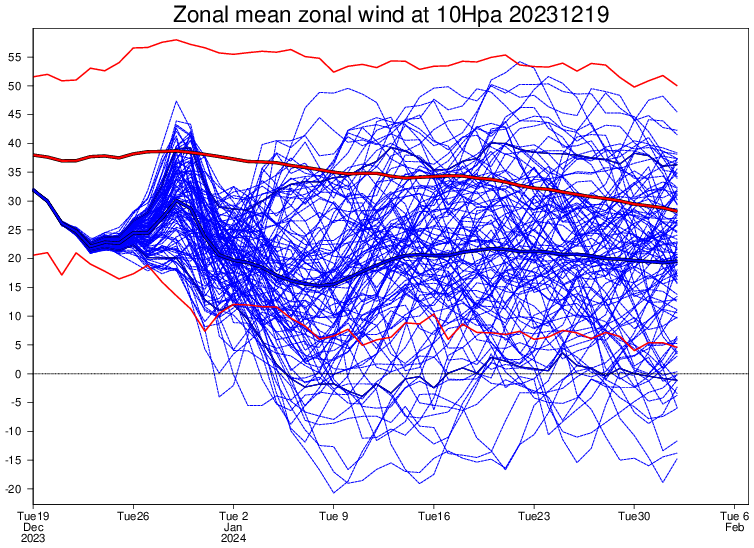
To compare, here was the run from yesterday:

Thanks a ton, Larry.
That's a massive forecast change in just 1 day! Pretty close to a wind reversal of the mean in early January!
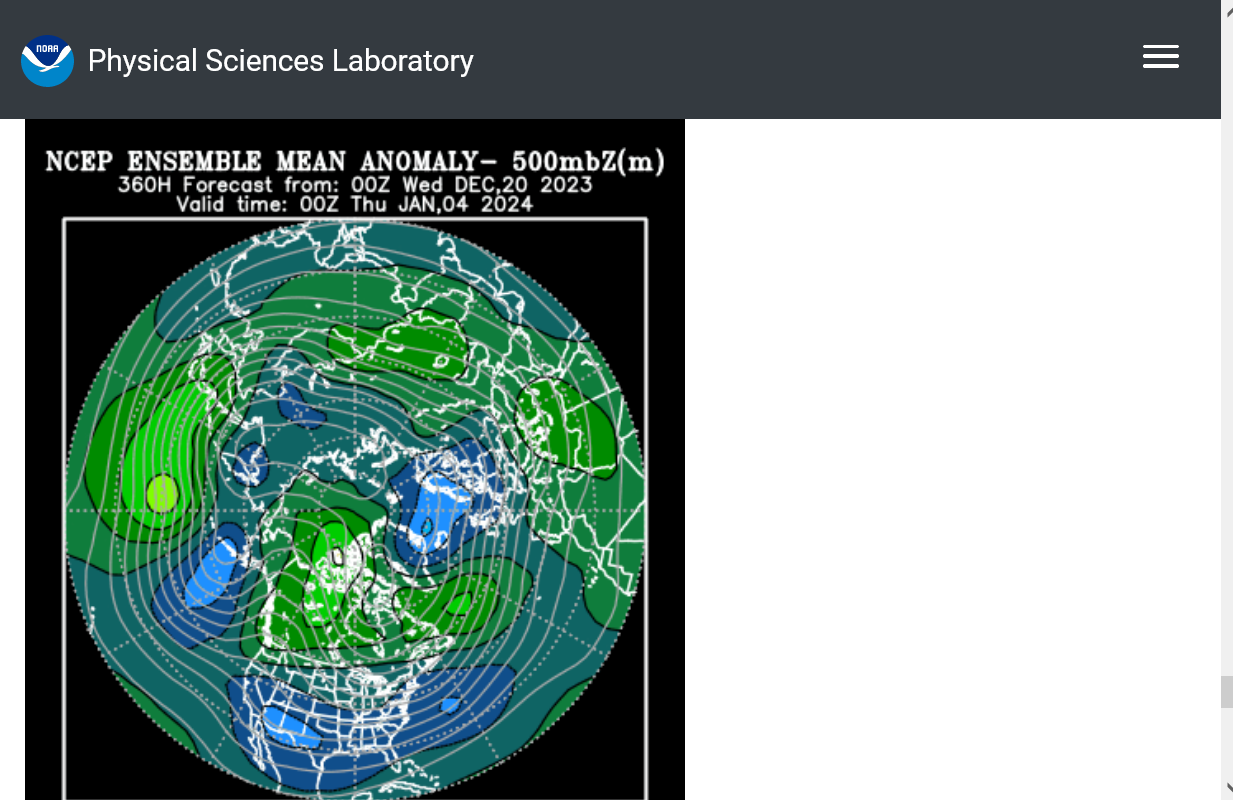
This is an interesting solution, considering this last 0z GEFS, 500 mb anomaly map at the last time frame, Jan. 4, just a few days before the peak in the SSW, shows very little sign of it in the troposphere. ........where it matters to our weather.
https://www.psl.noaa.gov/map/images/ens/z500anom_nh_alltimes.html
The individual Canadian model solutions are more bullish for potential impacts in the troposphere on January 5, with several solutions bringing the Polar Vortex south into Canada but still nothing extreme yet.
384h GZ 500 forecast valid on Jan 5, 2024 12UTC


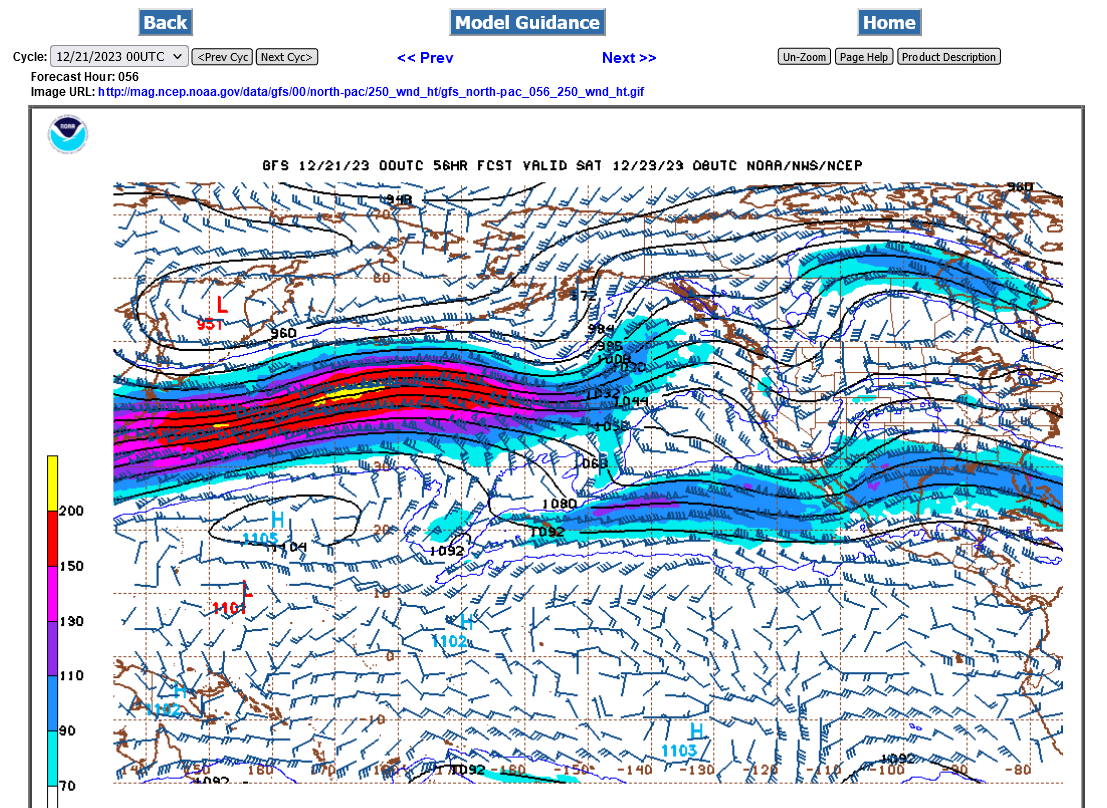
I think the potential SSW may be related to this feature at the end of this week.
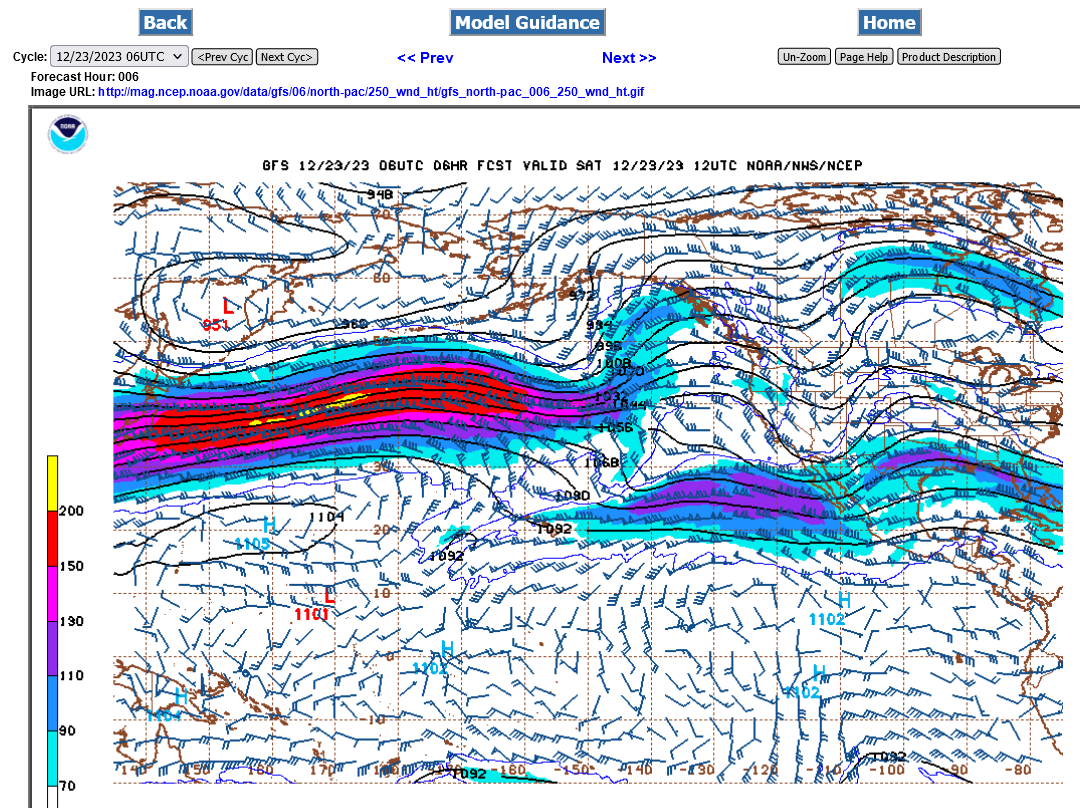
Very strong jet stream! This is the look at winds at 250 mb which is around 34,000 feet or 6+ miles above the ground. The jet max in yellow indicates a 240 mph wind speed.
This powerful feature will cause tremendous lift and could also cause the jet stream to buckle.
This is just speculative from me.
Mike and others,
Normally it takes 1-3 weeks for the affects of a major SSW to first get down into the troposphere, assuming it does get down that far (often does). The potential SSW date looks to be ~Jan 3-9. So, I’d add 7-21 days to that to get a most likely starting point of tropospheric effects to be mid to late Jan.
Is there any evidence that SSW's might have occurred in the winters of 77+78?
SCROLL DOWN FOR MORE, PLEASE!
Thanks very much, Larry!
This is extremely informative and enlightening.
I think that what cutworm was wondering was whether that extremely cold period was associated with an uptick in SSW activity.
In fact, there was only the 1 SSW event that you noted.
There were other much milder time frames that featured more than 1 event during the cold weather season.1987/88 and 1998/99 for instance.
The bitter cold weather during that period, 77/78 may have been in response to an SSW but other Winters have had MORE SSWs.
But we also went from the late 1980s to the late 1990s with ZERO MAJOR SSWs in almost a decade!! This was also at a time when global warming accelerated at its greatest rate. Was this related??
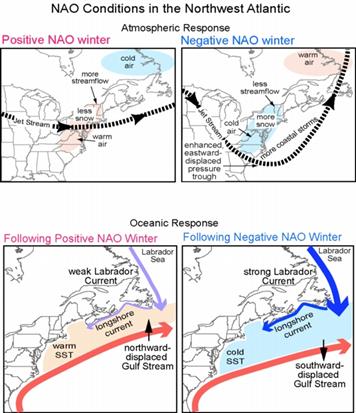
Also very important. The location matters a great deal.
A major SSW can dump all the cold air at the surface into Europe and Asia, while it stays mild in North America. Or it can be the other way around.
Just like the recent brutal cold and snow has battered much of that same area, while we’ve been extremely mild in North America(not from an SSW)..
A good follow up question might be “what % of our brutal cold is caused by SSTs?”
I“ll try to see if there’s an answer to that and maybe Larry knows.
Wonderful topic!
I'm still extremely impressed by this current jet stream.
What can often happen with a very powerful, ZONAL, west to east jet stream is that at some point, it buckles and causes an extreme meridional, blocking flow pattern because of the forces being diverted in the north/south direction, instead of west/east.
A zonal jet like this is usually associated with very mild air to its south and cold to the north. A huge temperature differential. This is why we NEVER see a feature like this in the warm season.
The atmosphere is constantly trying to balance the unequal heating (from the sun angle) between warmth in the south and cold in the north. A zonal jet stream like this that feeds on the temperature difference and provides energy for surface systems and lift to make stormy weather is not especially effective at transferring heat northward and cold southward.
When that jet buckles and takes on a more north/south component, THEN we get the effective, planetary heat transfer and balancing, which can result in large scale, high amplitude/anomalous extreme blocking features after the buckling that interacts with Rossby waves that can lead to an SSW event.
I believe the models having an elevated chance for a SSW event is connected to the jet stream below which could initiate the process.
Earlier in the week I showed the forecast and this is how it looks currently.
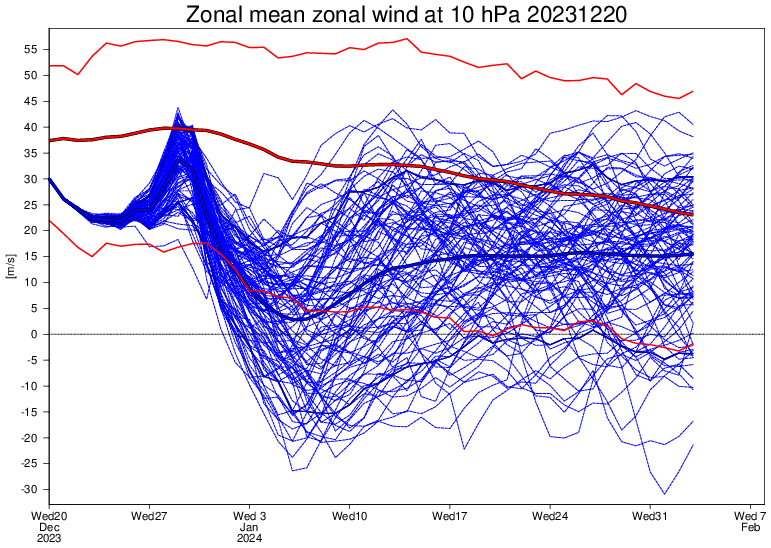
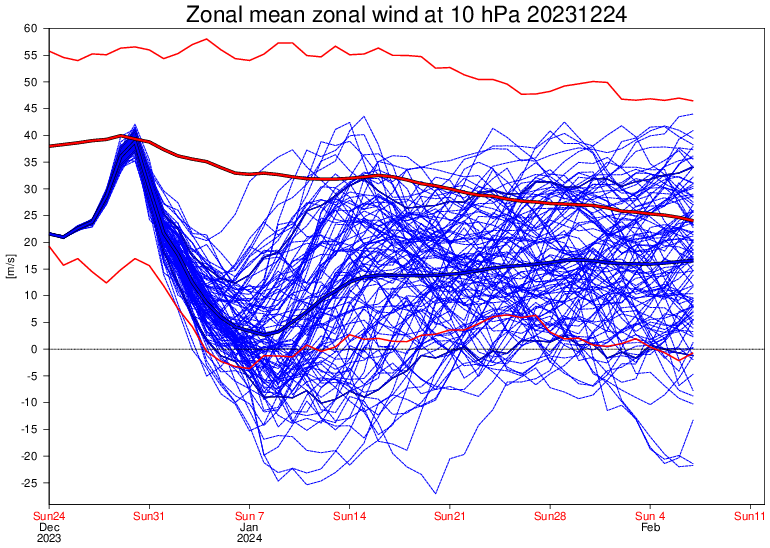
The Stratospheric wind forecast that plunged lower on Wednesday, as Larry noted has remained close to the level (up a tad on Thu/Fri, then back down a tad today).
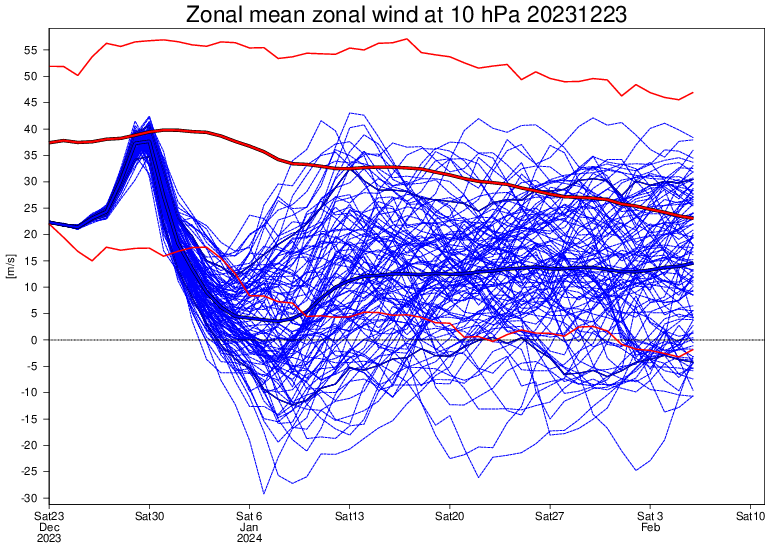
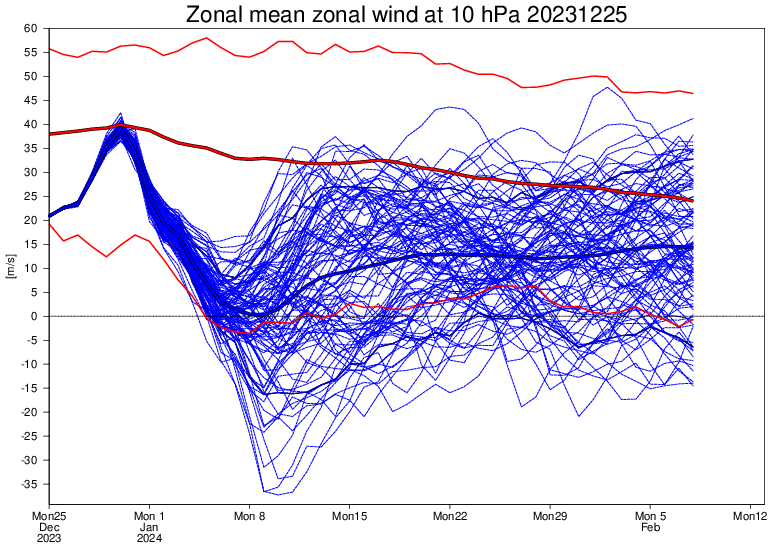
This is the forecast for the west to east stratospheric wind at 60 Deg. North which is just south of the the latitude of Anchorage Alaska.
This time of year averages the strongest wind around 40 m/s, which would be around 88 mph seen in the dark red. Light reds define the 10th and 90th percentile of past readings. NOTE: the bottom light red line DROPS with time because, seasonally SSW event odds go UP at this time of year.
Here's the forecast from the last 5 days with the last one at the top. Note the bottom one, Tuesday the HIGH point was +15 m/s, then Wednesday's forecast plunged to around +3 m/s. Thursday and Friday were + 5 m/s and today it's almost down to +3 m/s again.
1 m/s = 1 meter/second = 2.2 miles/hour =2.2 mph
So +3 m/s = +6.6 mph ...pretty dang slow from the west =dark blue line=average of 100 ensembles.
We should note that a number of light blue INDIVIDUAL ensemble solutions are below zero which means the winds reverse and go east to west instead of the usual west to east. This is the defining trait for a major SSW.
Last 5 days. Latest one is at the top
++++++++++++++++++++++++++
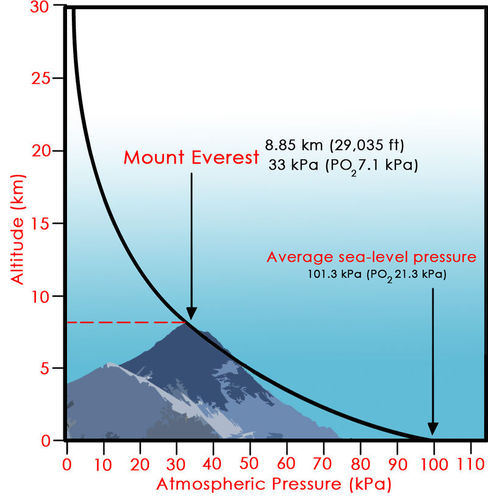
These predictions are for the 10 mb(millibar) level. The pressure at the surface is around 1,000 mb, so at 10 mb, there's only 1% of the atmosphere left! (it's in the stratosphere)
This is 65,000 feet above the ground, which is 12 miles up.........well above where the planes fly.
It would be over 2 times higher than Mt. Everest, the highest point on earth.
The conversion to KPa (pressure) below is:
1 KPA = 10 mb which is towards the top of the stratosphere with only 1% of the atmosphere left.
On the forecasts at the top we are using 10 mb which is the same as 1 KPa(Kilipascal) below. 10 MB is the pressure that we are using for the stratospheric wind forecast. It would be towards the top of the chart, which is 30 km. 30 km = 98,000+ feet on the left/Y axis below. The stratosphere actually starts much lower in the Arctic compared to the Tropics because the thickness of the atmosphere increases as the temperature increases. So the 10 MB level in the Arctic might only be a bit more than twice as high as Mt. Everest.
There will be a test next week (-:
Actually, I'll be in Detroit next week visiting my 98 year old Dad (playing chess) and my middle sisters family.
This explains the SSW that happened early this year:
++++++++++++++
https://www.noaa.gov/jetstream/atmosphere/layers-of-atmosphere

Average temperature profile for the lower layers of the atmosphere above
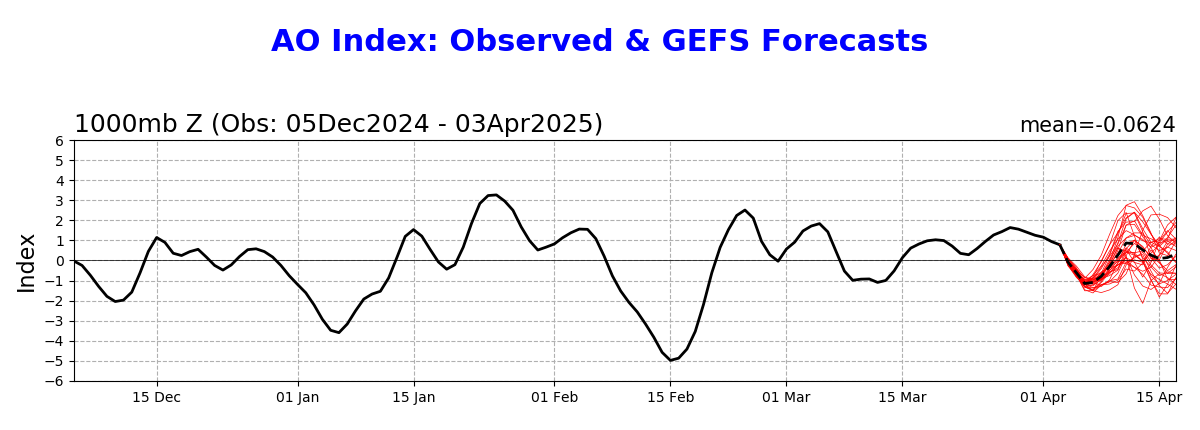
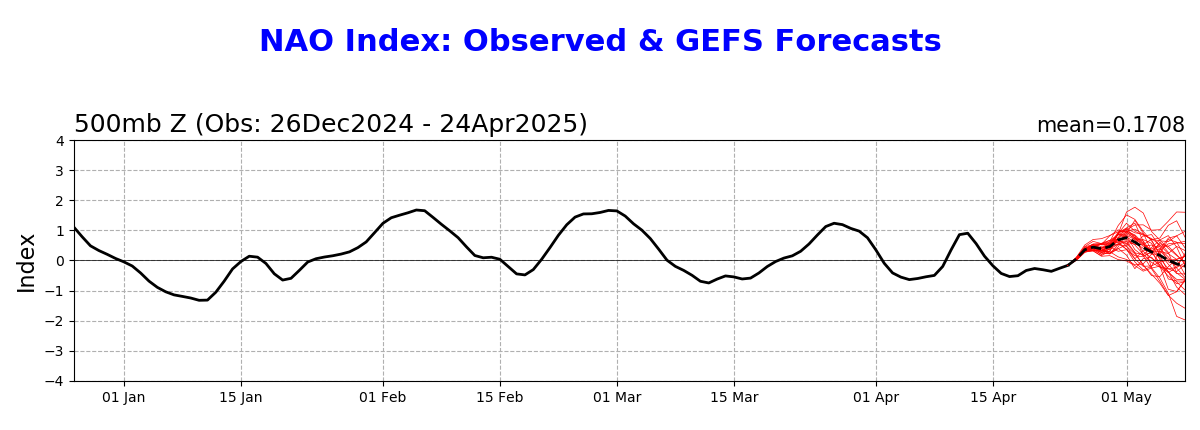
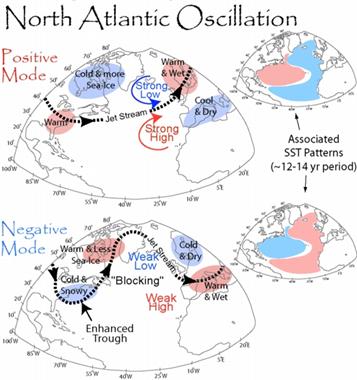
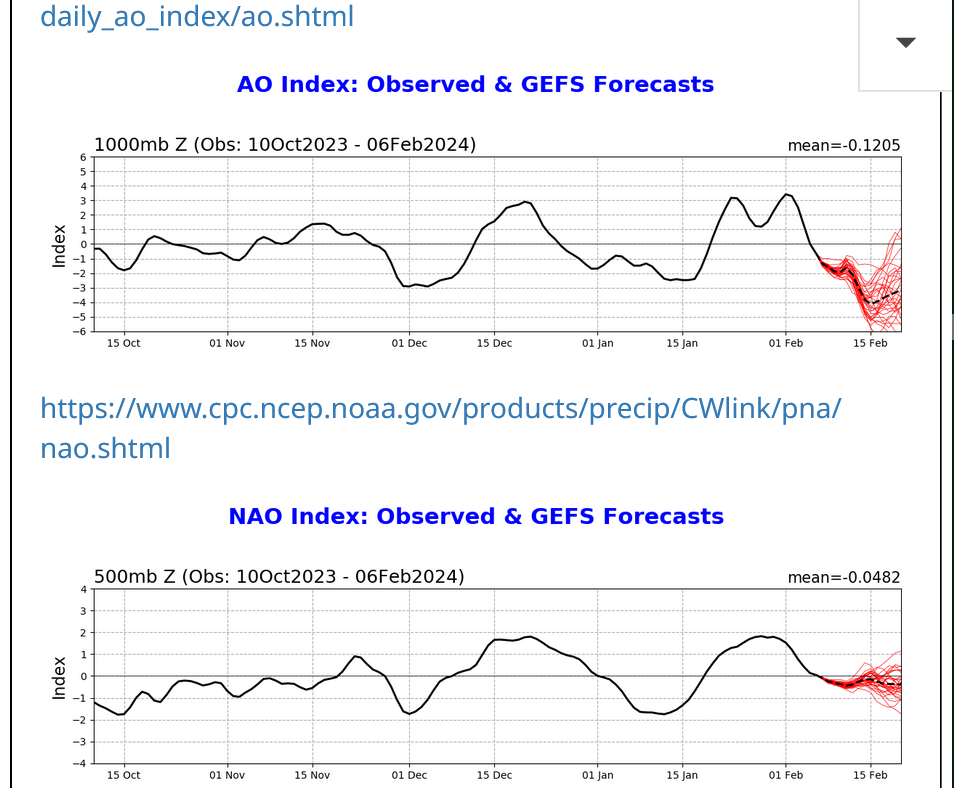
The AO (peaking near +3) and NAO(near +2 peak) have been extraordinarily positive in December, strongly correlated with our very mild weather in the Eastern half of the U.S.
However, the forecast below shows the AO mean crashing to -2 with an extreme spread in individual members.
A -AO is favorable for cold to get flushed from high latitudes to mid latitudes.
The NAO drops below 0 with less spread. This helps push the cold deeply south in the eastern half of the US.
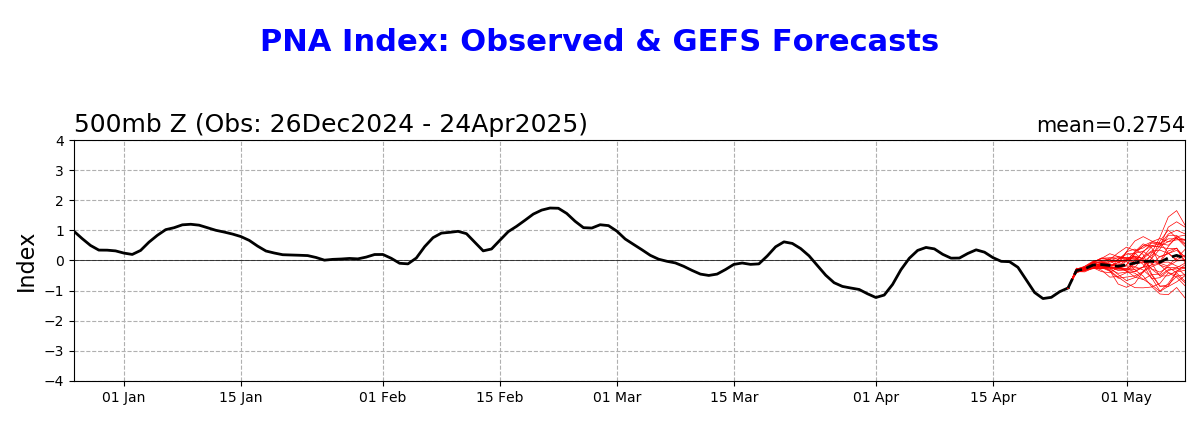
Arctic Oscillation Index, North Atlantic Oscillation Index, Pacific North American Index.
https://www.cpc.ncep.noaa.gov/products/precip/CWlink/daily_ao_index/ao.shtml
https://www.cpc.ncep.noaa.gov/products/precip/CWlink/pna/nao.shtml
https://www.cpc.ncep.noaa.gov/products/precip/CWlink/pna/pna.shtml
+++++++++++
http://appinsys.com/globalwarming/ao_nao.htm
AO BELOW
We should note 3 extremely critical things here:
1. A disruption in the stratospheric polar vortex is NOT for sure in the forecast, just an elevated potential.
2. It takes weeks after that event for that to be passed down to the troposphere, where all of the atmosphere is and then fully dialed into teleconnections downstream of the initial impacted polar areas.
3. The exact location means everything. There's only so much cold air in the Arctic. Not enough to cool off ALL the mid latitudes of the northern hemisphere, maybe enough to impact something approaching much less than half of it. That means winds coming from the north over that portion.For every X amount of air flowing from north to south, there will be an equal and opposite amount of air flowing from south to north, somewhere. So while half of the northern hemisphere could be experiencing brutal cold and snow, the other half is likely to be experiencing the EXACT OPPOSITE.
In fact, that's exactly what happened in December 2023.
Not from a SSW but much of Europe and Asia saw brutal cold and record snows in December...........while much of North America’s weather featured extremely mild temperatures.
It's always been that way and always will be. This is part of expected, very normal but extreme weather variability.
+++++++++++++
Regardless of what happens with this potential SSW, the mild weather pattern from December is about to end with MUCH colder weather in january extremely likely.
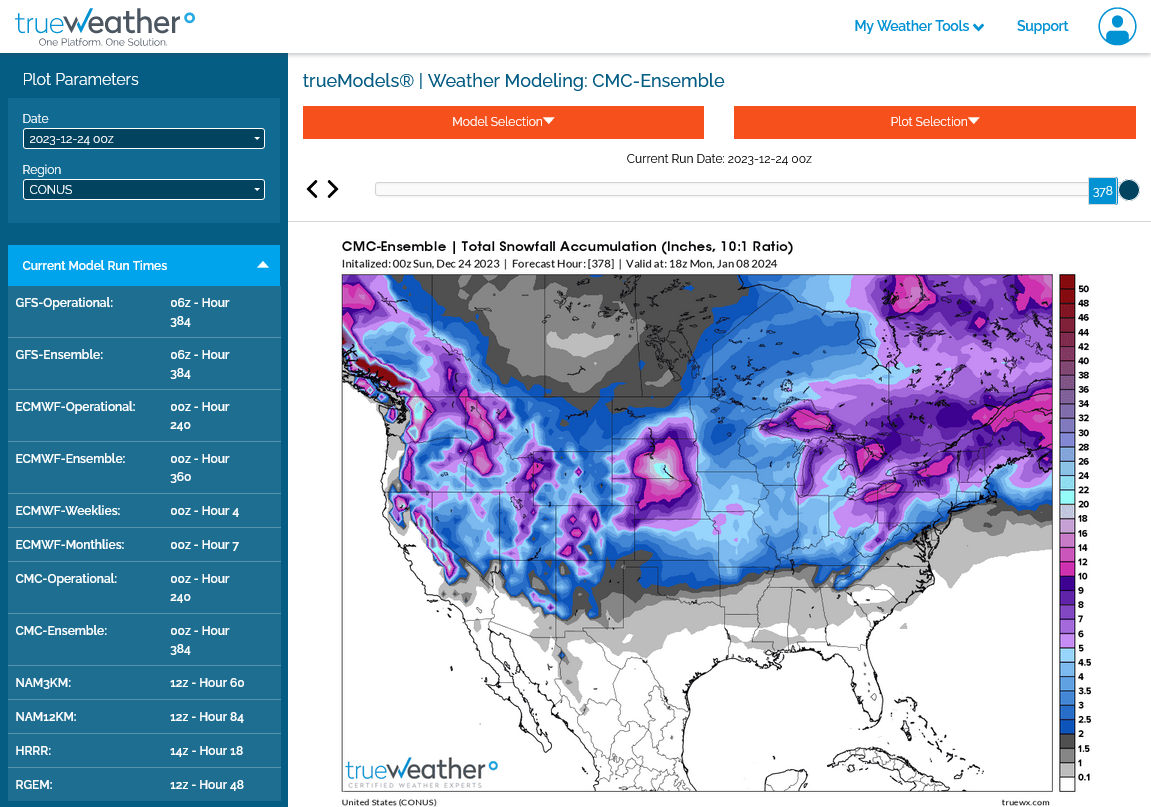
A great deal of snow is also going to accompany the new pattern.
This is the total snow thru January 8th from the snow and cold bullish Canadian model, which already disrupts the tropospheric polar vortex on our side of the northern hemisphere in early January.
++++++++++++
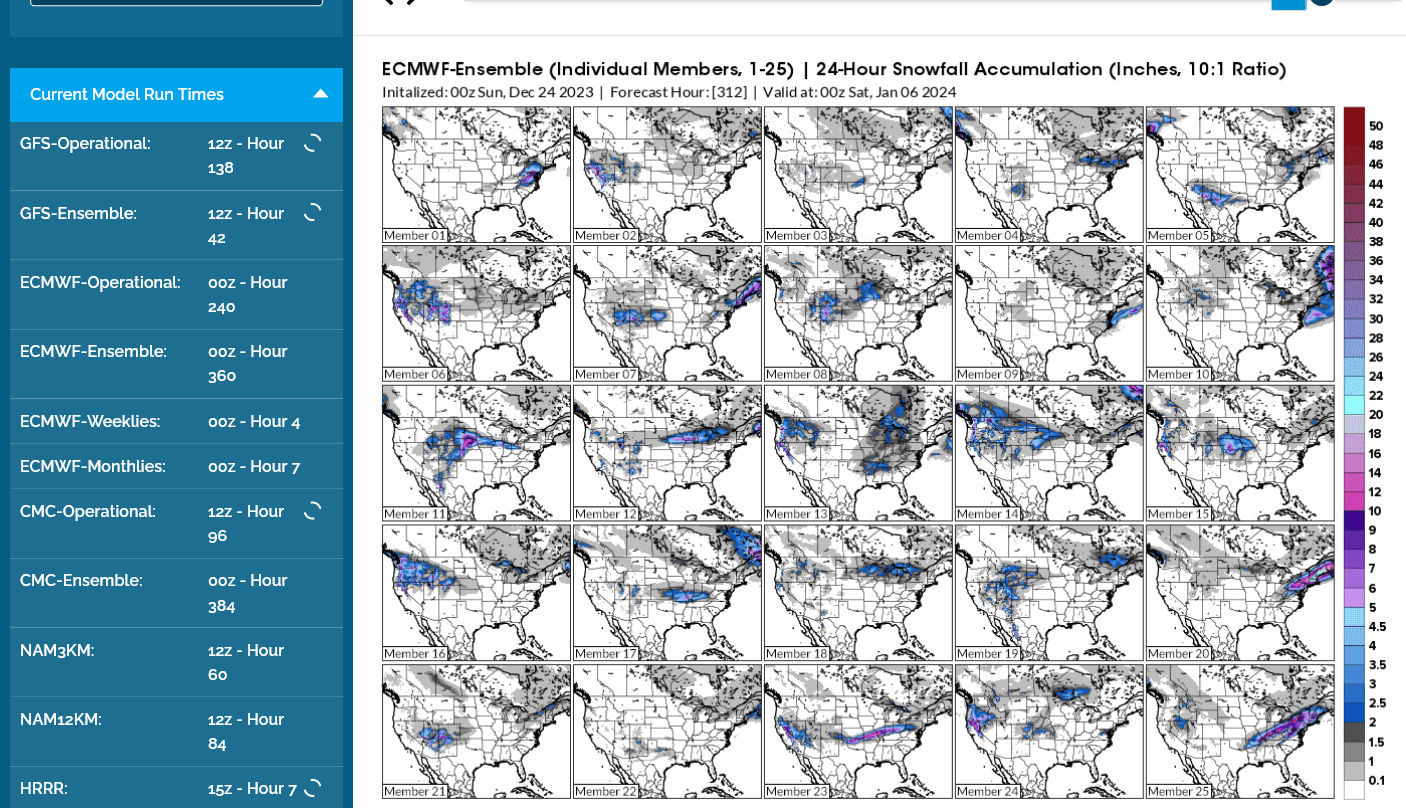
3 of these 25 individual European model ensembles have a big snow for Southern Indiana on January 5th. Any other day is fine but if schools close here on that day, we can't set up for our Jan 6th tournament and need to reschedule for the following Saturday.
Regardless of what happens on that day in that location there SHOULD BE frequent snow events in the Eastern 2/3rds of the country during January.
Latest forecast. Still an ensemble mean around +3 m/s in early January with several dozen below 0, which would be a reversal of the wind from westerly to easterly.
Not much change in the SSW status but there is with regards to the potential snowstorm at the end of the 1st week in January. The outlier European model solutions that linked up a strong southern stream wave and interacted with the northern stream during that time frame have abandoned that solution except for 1 out of the total 50 on the European model. Anything that falls will be snow but it's very DRY!
The very snow bullish Canadian model has other ideas with numerous waves and snow opportunities in early January but amounts are REDUCED since yesterday.
The GEFS(American model) is in between.
So the chances of a major snow in Indiana in the Jan 5-6 time frame are LESS than yesterday.
From the 12Z EE, the 60N 10 mb wind plunged all of the way down to -5 m/s on 1/9/23 with a most likely wind reversal date within Jan 5-8:
Thanks much, Larry!
The last ensemble mean solution has it going to ZERO in 2 weeks.
If we use this anomaly map at 500 mb in 2 weeks for any clues, one would guess the cold air and polar vortex is most likely to be over N.Europe.
However, this is very uncertain and the AO is crashing to very low values with the NAO plunging well below 0, negative anomalies could develop in the Eastern US to replace the positive ones on this map because the atmospheric teleconnections like that solution.
The El Nino is closer to the US and we are directly downstream so the El Nino could deflect the SSW inpact farther downstream by thousands of milles?
GFS ensemble mean anomalies at 2 weeks.
https://www.psl.noaa.gov/map/images/ens/z500anom_nh_alltimes.html 
Mike, Larry, you guys are the best. I read your work here at MF regular, rich and deep. My next HO trade is depend on your call -
Corn, Bean, gotta swing the bat, stay cold but not hot.
Thanks beckah!
HO had a 25c bounce, over 2 weeks, with a Spike up last week that tested a 3 month old downtrend line.
Its not been the greatest weather market in recent years like NG is.
however, supplies were pretty low last time I looked a month ago, so extreme cold should provide good bullish potential.
Thanks, beckah.
The ensemble mean below is down to -3, which means stratospheric polar winds reversing from the normal west to east and going from east to west, which should work its way down to the troposphere, where our weather systems are.
AO and NAO crashing lower in week 2 which favors cold air getting flushed from high latitudes to middle latitudes.
https://www.marketforum.com/forum/topic/83844/#83856
None of the 2 week forecasts are depicting intense cold penetrating into the US............YET! However, the dynamics are setting up for some mid/late January cold blasts.
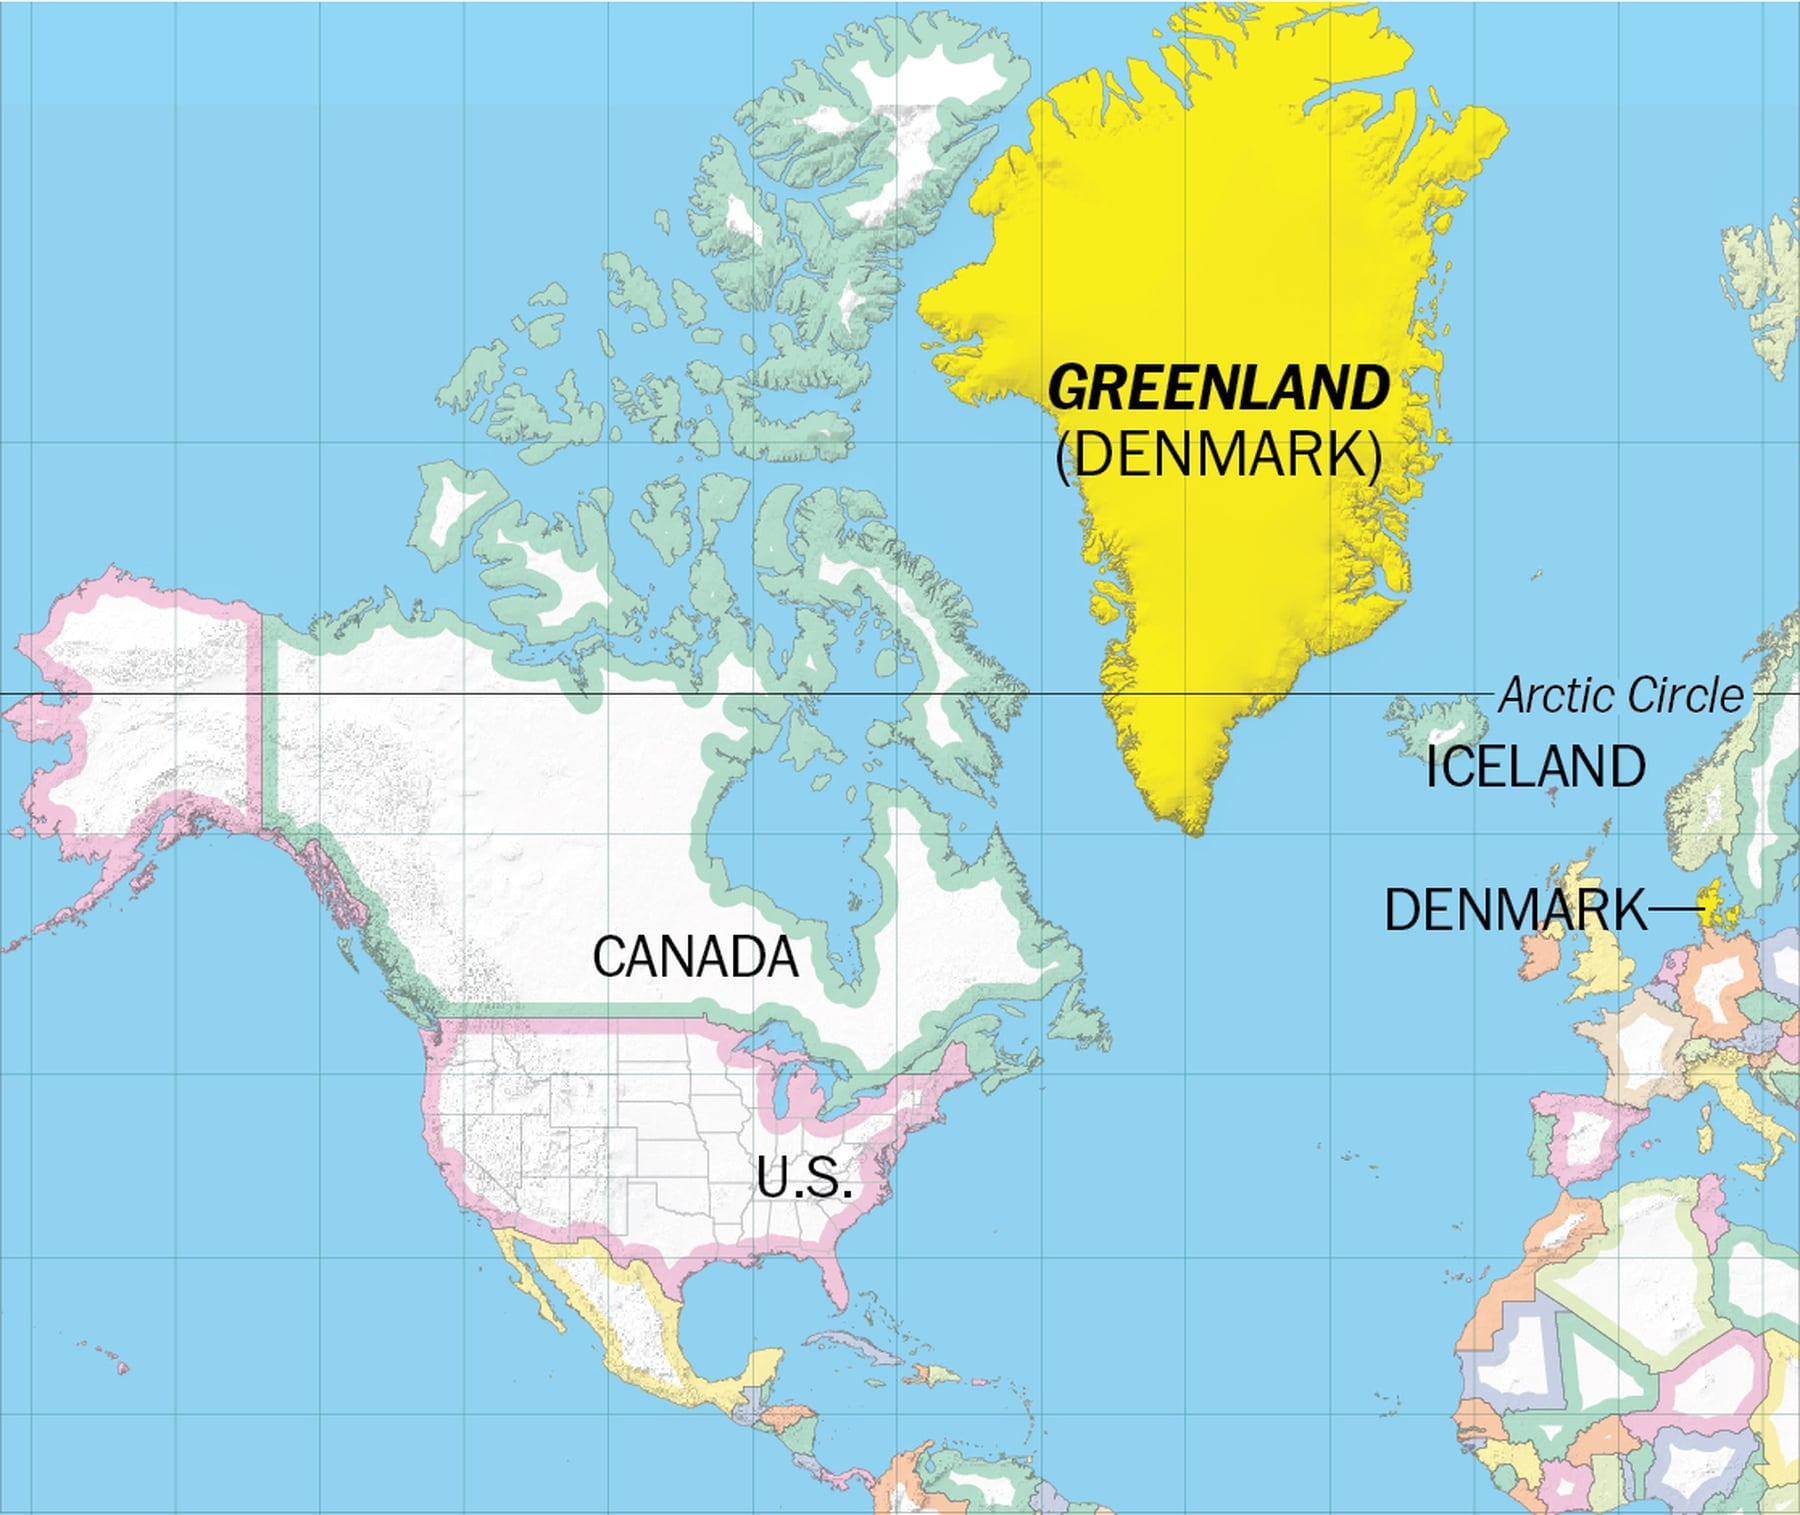
Powerful positive anomaly growing in vicinity of Greenland. Potential Greenland block building in week 2.
The last 12z European model was +9 HDDs on the bullish side.

I appreciate Larry starting this thread so we can analyze this potential SSW as the forecast evolves. Exciting stuff in an area of atmospheric science that we've only recently been covering this closely.
HERE WE GO!
The GEFS is finally coming around overnight by forecasting an atmospheric COUPLET associated with the -NAO, -AO regime that we've been touting for several days.....which is in response to the SSW in 2 weeks.
Impressive high latitude positive anomaly over Greenland with the mid latitude negative anomalies teleconnecting with a pattern that features favorable movement of cold air from high latitudes to mid latitudes.
Previously, the negative anomalies were over Europe with great uncertainty. Now they are over the Eastern US, which would dump the cold air into the US. All the NWS forecasts for every extended period have been mild for much of the US but this will likely change as they finally dial the new pattern in.
Natural gas prices have remained supported the last couple of weeks, despite the mild NWS forecasts as the market is usually extremely weather savvy.
Also, compared to extremely mild the last month, just average would be relatively bullish.
Here's a layman's discussion on how this pattern caused cold from a year ago, when we were experiencing unusual cold in December 2022.
https://www.foxweather.com/weather-news/greenland-block-eastern-us-snow-arctic-air
This was sort of a surprise. The update today was up to +5 m/s with no reversal. A small minority of the individual ensembles drop below 0 now.
Regardless, the solidly negative AO and NAO tell us the threat of MUCH colder weather later this month is REAL.
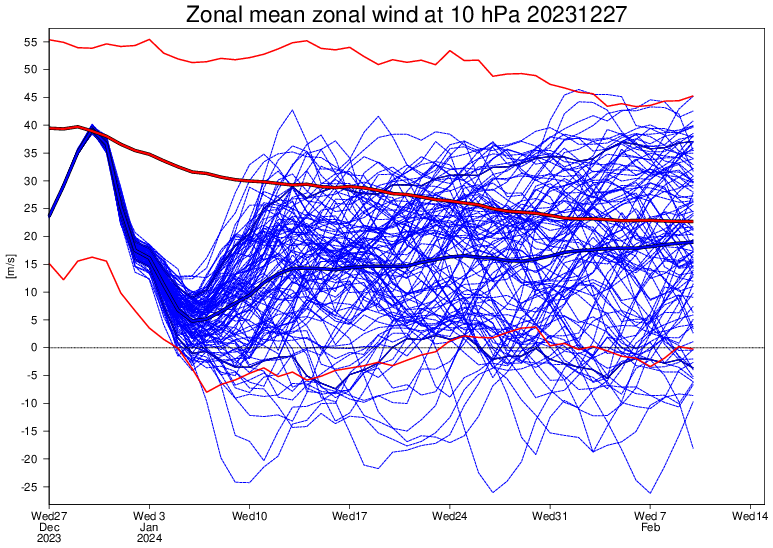
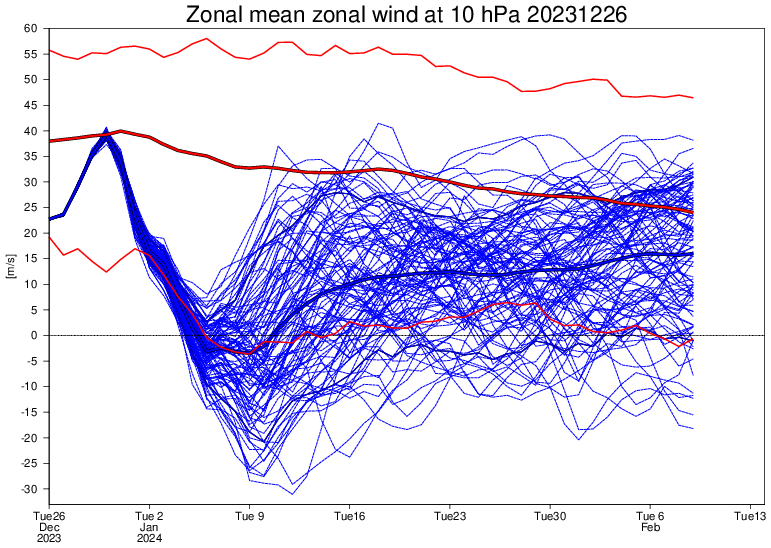
The 0Z EE incredibly enough went from its strongest to its weakest signal yet for an early Jan major SSW over just a two day period, an amazingly unexpected turn of events:
Here’s the 0Z 12/26 EE run, the strongest suggestion yet for an early Jan major SSW:
And now here’s the run from a mere two days later, the 0Z 12/28 EE run (latest currently available with this graph as 0Z 12/29 run not out til this afternoon). This 0Z 12/28 run has a mere 4 members (8%) with a major SSW in early Jan, which is so amazingly unexpected to me (look at the huge difference from the graph posted just above this):
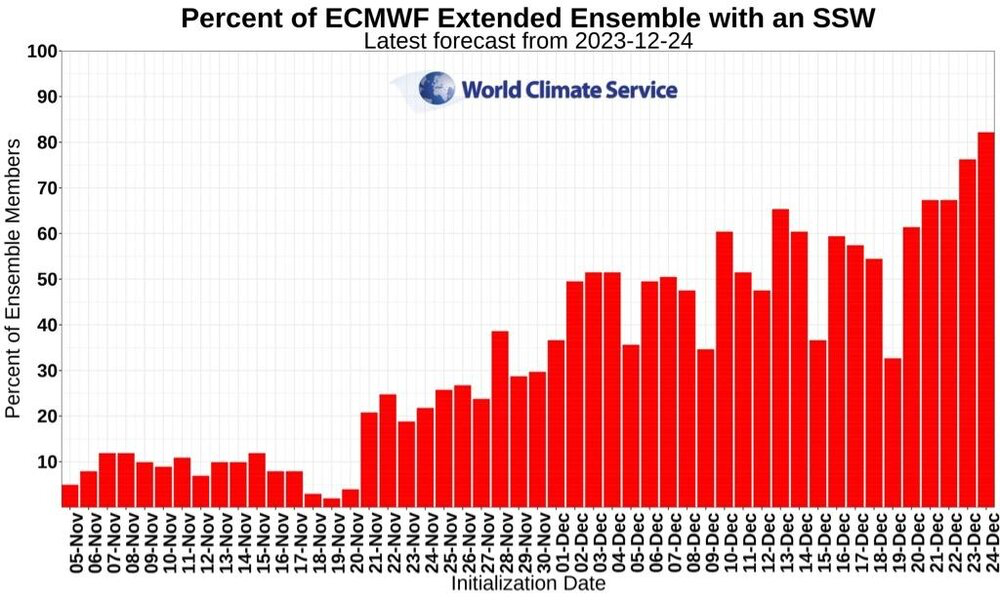
I’m still amazed at how the Euro weeklies went from this increased trend toward a major SSW, which covers through the 12/24 run (see image below) to the strongest signal for a major in early Jan (12/26 run posted two posts above this) to suddenly about the weakest signal on the 12/28 run as addressed in my post just above this:
I share your amazement loud and clear Larry.
The biggest change took place with the solution of 12-27-23.
https://www.marketforum.com/forum/topic/101402/#101520
Like you showed, the solutions were all moving in one direction. The trend is your friend also applies to weather models/solutions too.
https://www.marketforum.com/forum/topic/101402/#101546
A wind reversal looked extremely likely based on more and more of the 100 individual ensemble solutions embracing that solution.
A big reason for model ensembles (same model but tiny tweaks in a few of the equations because there is NO PERFECT set of equations to represent the physics of the atmosphere) to be so valuable and consistent is that it averages all the solutions combined.
This waters down the extreme outliers, which are usually wrong and it gravitates towards the most likely scenario which is usually close to the average.
There are situations when half the solutions are supporting one extreme and the other half show the opposite extreme and the average is in the middle which represents very few individual solutions. So one extreme or the other extreme is most likely not the ensemble mean........but that's an exception and NOT what we had here.
As Larry noted, the number of ensemble members supporting a reversal was growing and up to 80% just 3 days ago(giving us increasing confidence) then BOOOOM! 2 days ago the majority suddenly jumped ship and kept the winds blowing from west to east(+/positive values).
I will make some specific, relevant comments.
1. We all know how weather forecasts can suddenly change. All my biggest losses trading were from holding a weather position over the weekend and the weather forecast maps flipped from extremely bullish to bearish. This was mainly from 6-10 day forecast period changes.
2. The wind reversal forecast had been in the Jan. 5-8 time frame, so this actually falls in the 8-14 day time frame.........even farther out, when you consider the 12-27-23 abrupt.
3. I've never tracked a potential SSW in the forecast for this long but can imagine it MIGHT BE much harder to predict than regular weather in the troposphere because we have thousands of points around the globe that are updated around the clock for weather. And thousands of equations that represent the physics in the troposphere.
The stratosphere is a different deal. I would be interested in what data is fed in and what the model equations are compared to the weather model equations.
The number of potential SSW events each year are just a few. So we don't have the sample size and history for comparisons like we do for weather systems in the troposphere.
All things considered, maybe this should not be as big of a surprise because we haven't had enough SSWs to know what the range and frequency of abrupt shifts has been in the past at this time frame.
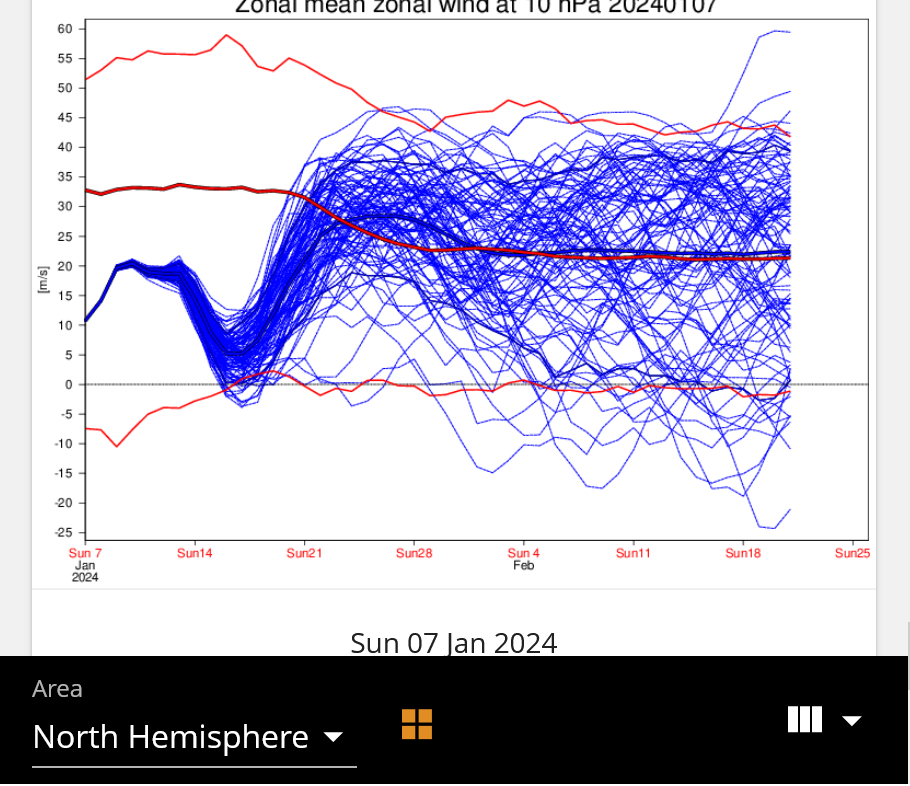
Ensemble mean only drops to +10 now!
So no SSW.
However, it’s going to turn MUCH colder during the 2nd week of January!C
We’re having another SSW THIS week!
This means another polar vortex disruption possible in early February.
I hadn’t checked for 2 weeks but it’s been on the models And I just missed it!
More about that when I get back to my office.
It's baaaaaack.
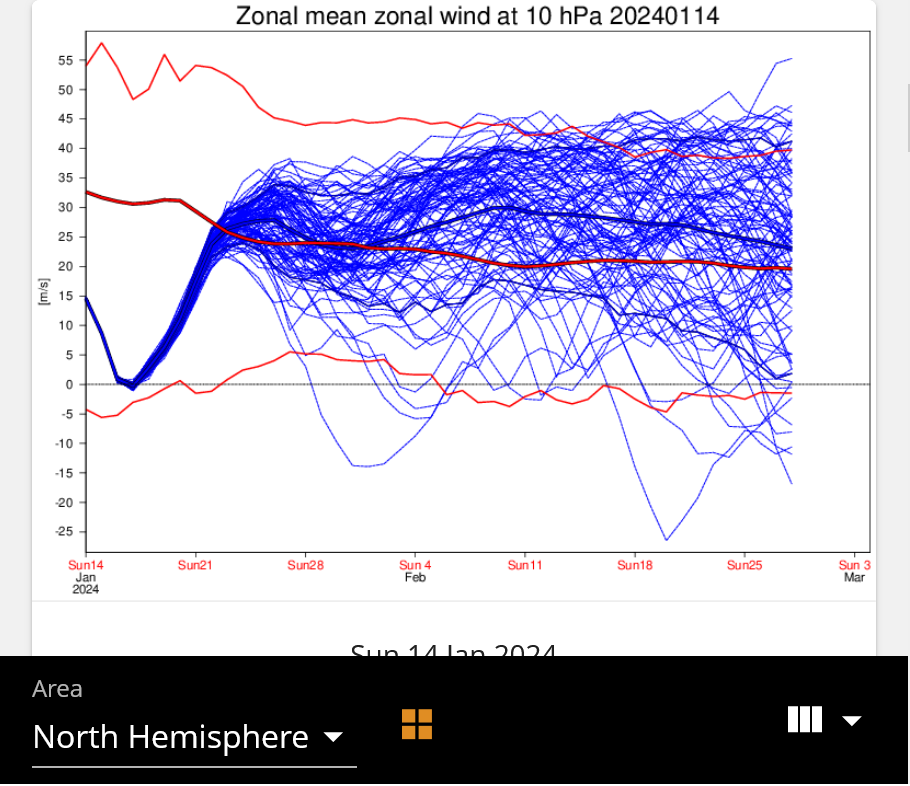
Previous forecast for Stratospheric winds back in late December. After the dip in the first week of January, stratospheric winds were predicted to increase during the 2nd week of January.

++++++++++++++++++++
I stopped watching but we have another event with winds dropping to ZERO, even lower than earlier this month.
This was the forecast 1 week ago:
Last forecast........winds in the stratosphere approaching 0 the next couple of days.
The Arctic will not have time to build up the cold that we had plummeting down this time, so its unlikely to be this cold again for the rest of the season......even with the same pattern, should it manage to get as extreme which is extraordinarily unlikely in itself.
If you're wondering where Larry is, his beloved brother that lived with him and he was devoted to caring for as long as I've known Larry, passed away in December.
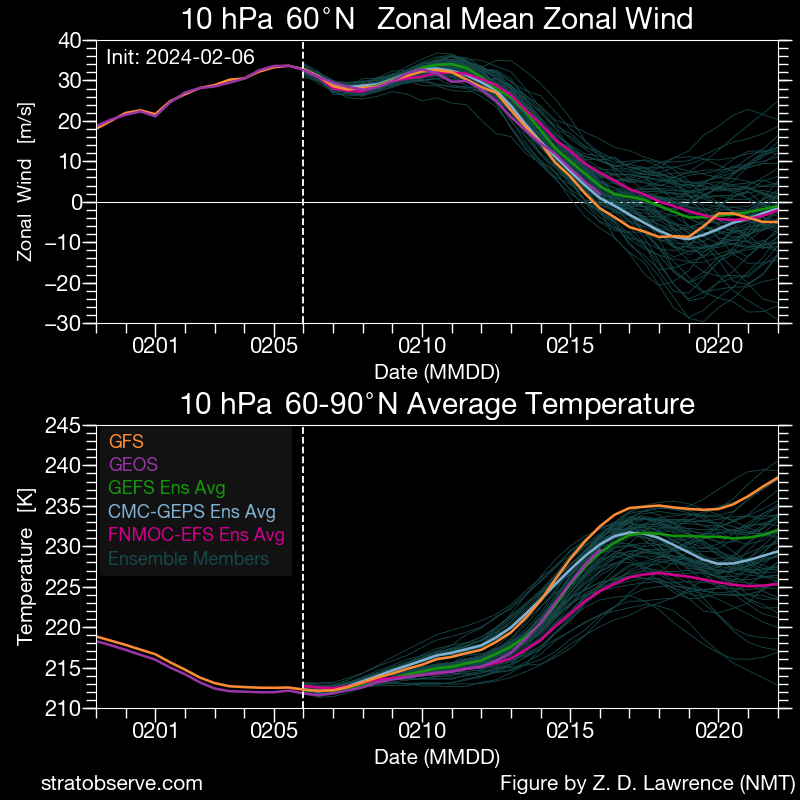
We're seeing the peak of another SSW right now which will likely be transported from the stratosphere down to the troposphere where our weather is.........and cause another disruption of the polar vortex in February.
You can see below that the normal 31 meter/second (69 mph) winds from the west to east have stopped and taken on a very tiny east to west component, indicated by the tiny negative value.
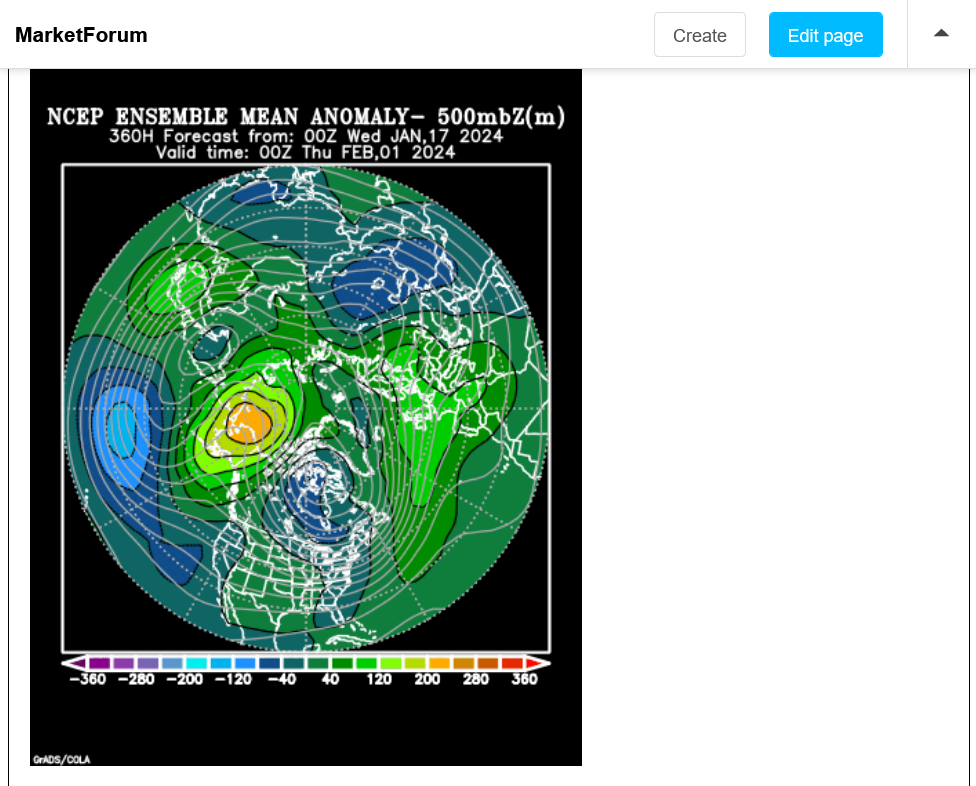
Below is giving us an early glimpse of where that might be at the very end of January.
This is the 360 hour GEFS anomaly map for 500 mb.
Growing positive anomaly from Alaska into Siberia with cross polar flow dumping Siberian air into Canada. Growing negative anomaly in Eastern Canada.
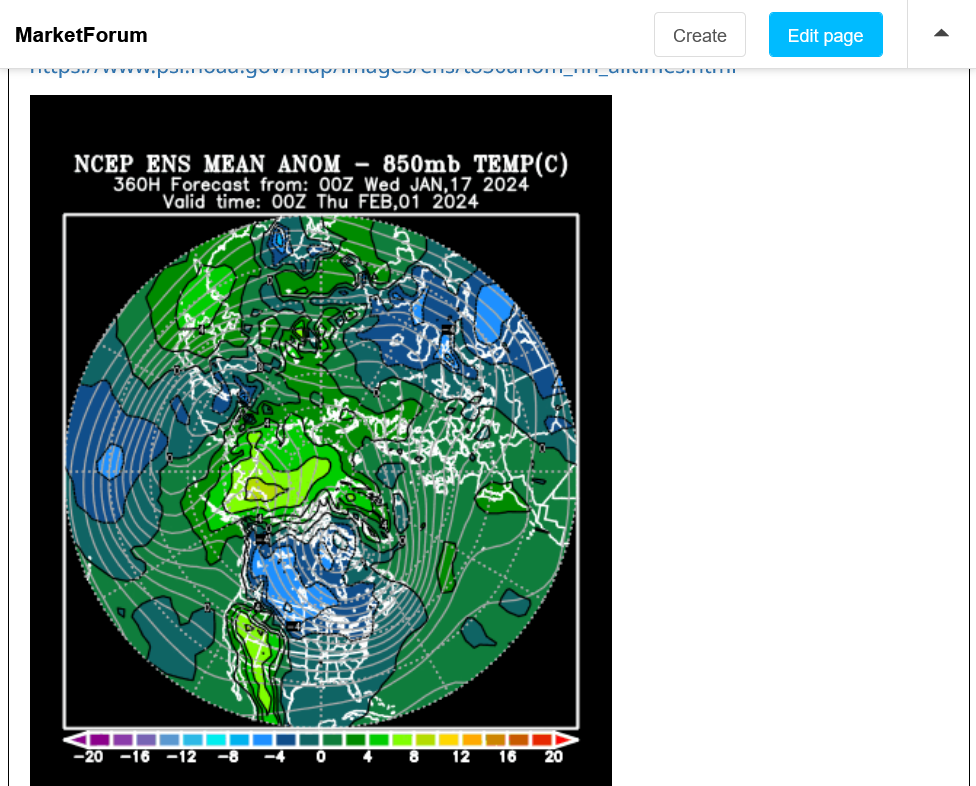
850 mb anomaly temps below for 360 hours out. Cold in Canada has already started to dump across the border into the United States.
Below: we should note the couplet this last time in its EXTREME mature stage at 500 mb early this last weekend. With the Polar Vortex waaaay far south and extreme positive anomaly in Canada to Greenland(where the polar vortex usually is).
In Late December, we had no idea that it would look this extreme 2+ weeks later.
So in early a February, when this next event matures, it could look much different than the map above.
Last weekend map below.
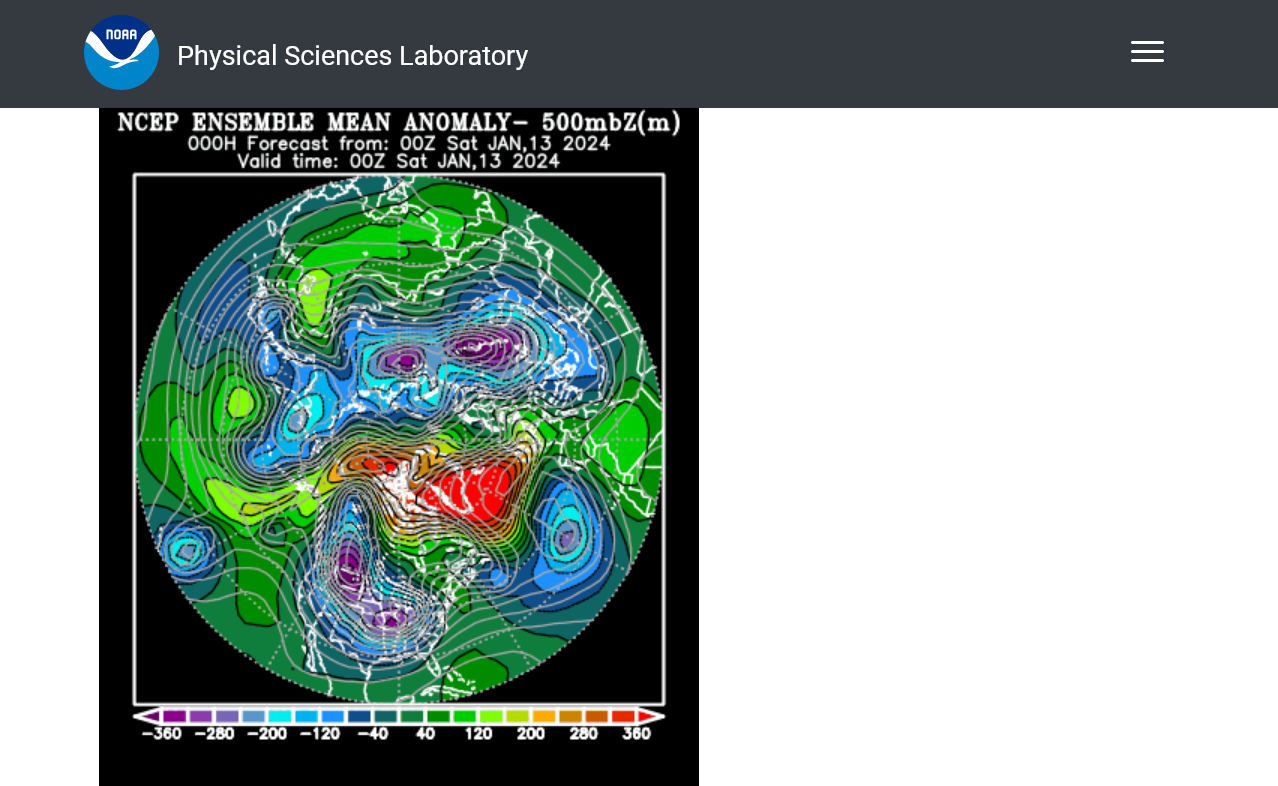
This next blast of cold could take on a completely different configuration than the last one did.
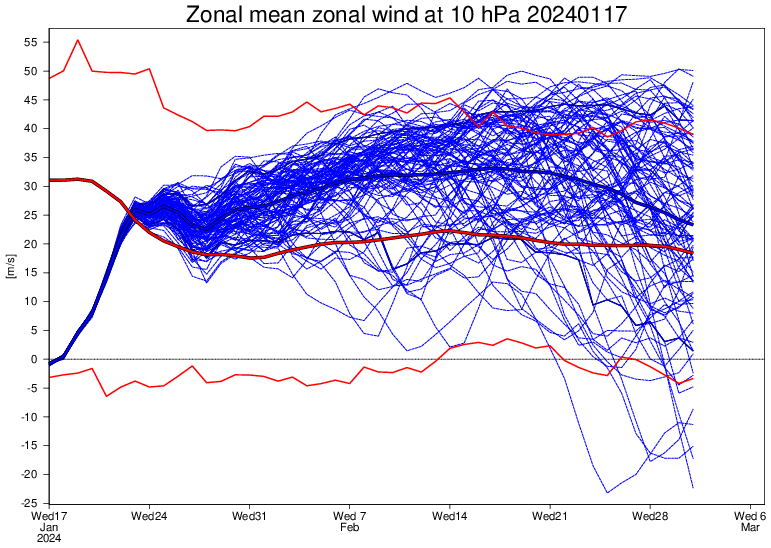
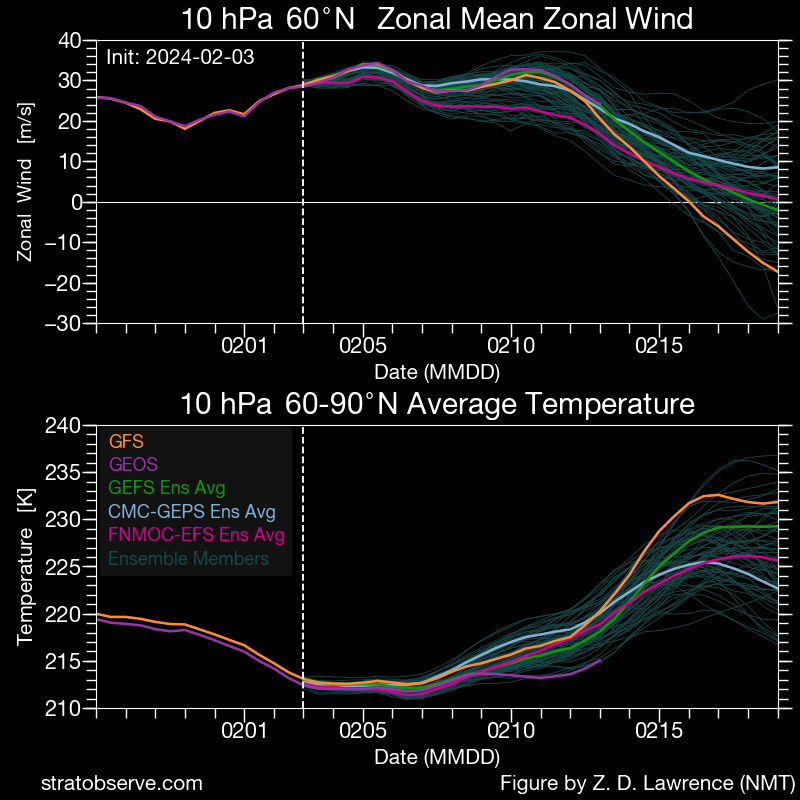
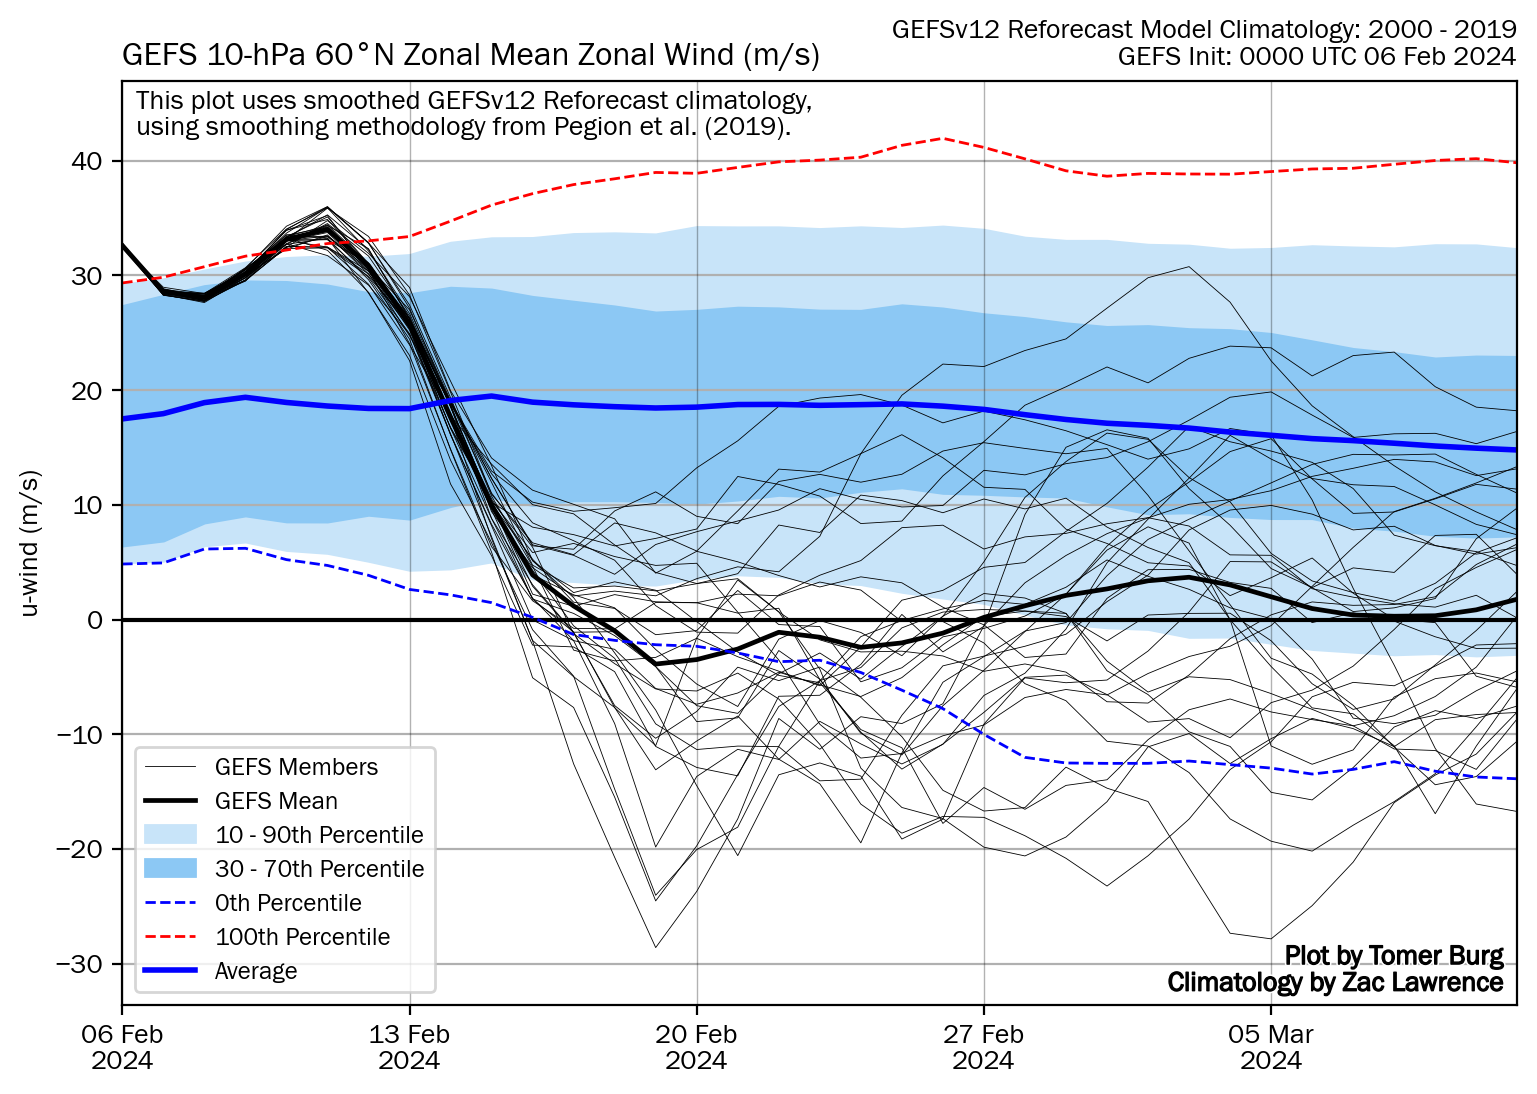
The 2/3 models (image below) are even more bullish for a major SSW with the GFS’ 2/16 reversal plunging way down to -17 and still dropping at the end (likely overdone)! GEFS mean now drops to -2 and still dropping at the end. Including the GFS, 6 members drop below -10 with a couple more possible after the end.
GEFS extended means for mid to late Feb
-1/25 run: stayed over +30
-1/29 run: stayed over +20
-1/30 run: stayed over +15
-1/31 & 2/1 runs: stayed over +10
-2/2 run: stayed over +7
-2/3 run: dipped to -2 and still dropping into extended, which hasn’t been released yet:
Thanks much, Larry. Do you mind sharing that source please(so that I can follow it).
~80% of the 100 European model ensemble solutions disagree with most of those extreme solutions.
https://charts.ecmwf.int/products/extended-zonal-mean-zonal-wind?area=nh&base_time=202402030000
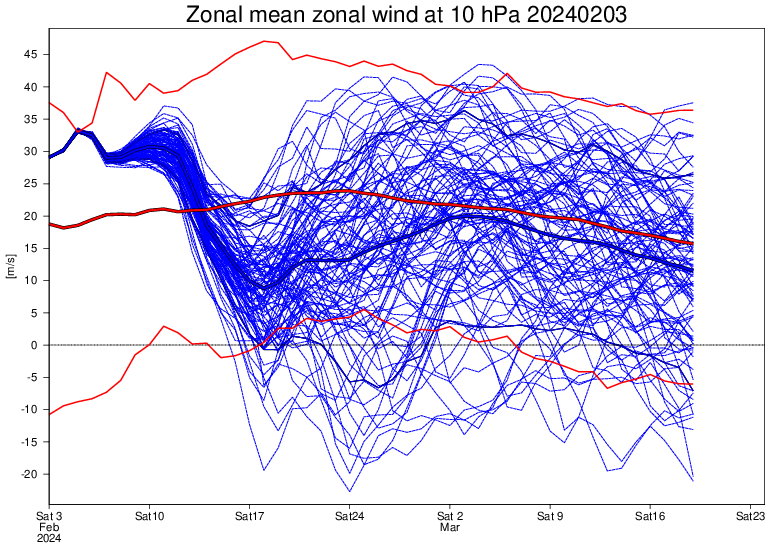
However, the wind forecast has been dropping in the last week
++++++++++
For sure a strong potential contributing factor later this month is the high magnitude --AO late in the period, associated with building positive anomalies in the high latitudes and weakening anomalies in the southern mid latitudes.
https://www.marketforum.com/forum/topic/83844/#83856
++++++++
Though the -AO this time is forecast to be as impressive as the January cold there will be a HUGE difference.
1. In January, the negative mid latitude height anomalies were forced entirely by the NORTHERN stream. Which had total control and it maximized the flush of air from north to south and caused a big piece of the Polar Vortex to reform in the United States.

2. This time, the negative southern/mid latitude anomalies will be forced entirely by the SOUTHERN stream coming from the Pacific. An El Nino looking analog. The Polar Vortex will likely be displaced southward but still be in Central Canada, around Hudson Bay but 1,500 miles farther north than the January intrusion that caused the frigid outbreak.
That could amplify after this 15 day period below but the couplet/teleconnection dynamics are extremely different this time.
You’re welcome, Mike! Here’s the image link:
I just posted this at AmericanWx:
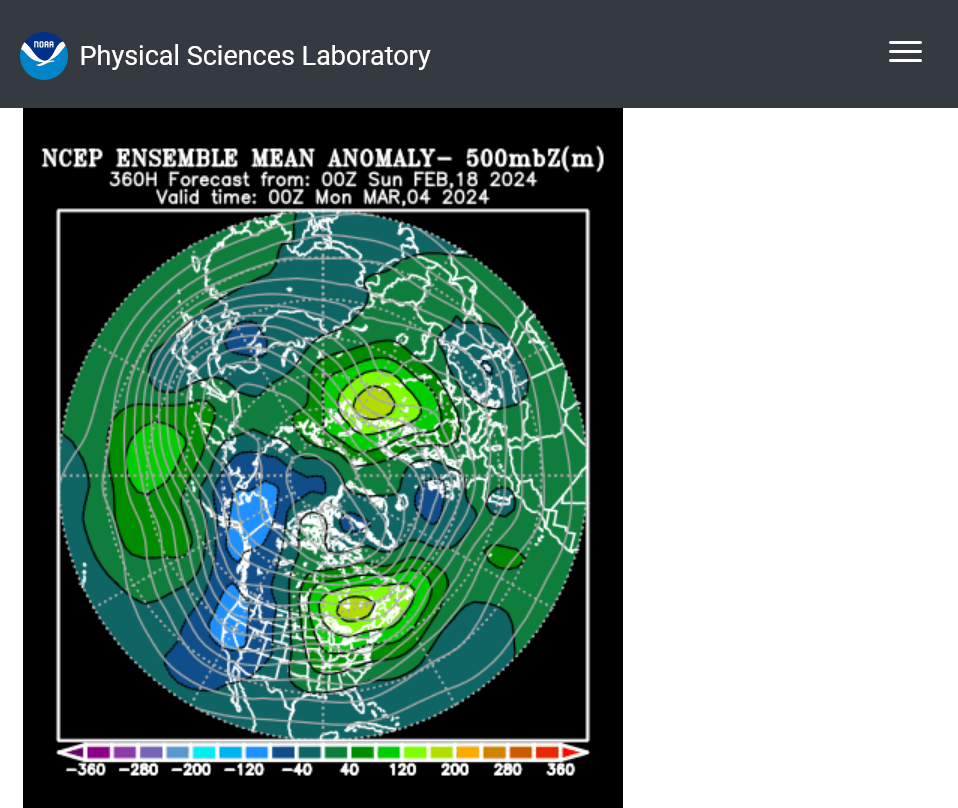
Today’s extended EPS mean drops to a mere +4 (vs +11 two days ago and +31 nine days ago) with numerous members having a major SSW. Also, like is the case on the extended GEFS, the SPV is now much weaker than normal from mid Feb into March. The chance for a cold E US March continues to increase!
Thanks much, Larry!
Latest discussion on this in the natural gas thread.
-4 AO on the last forecast. That's at the bottom of the graph. Unbelievable!
Slightly -NAO so the very cold air coming south from high latitudes to mid latitudes from the -4 AO won't get that much push from the NAO after it crosses into the US. That cold dense air at the lower levels will seep/drift in and modify as it undercuts the less than optimal upper levels in the US.
Give us something less than a -1 NAO(like the last cold outbreak) and that provides much more push.
https://www.marketforum.com/forum/topic/83844/#83856
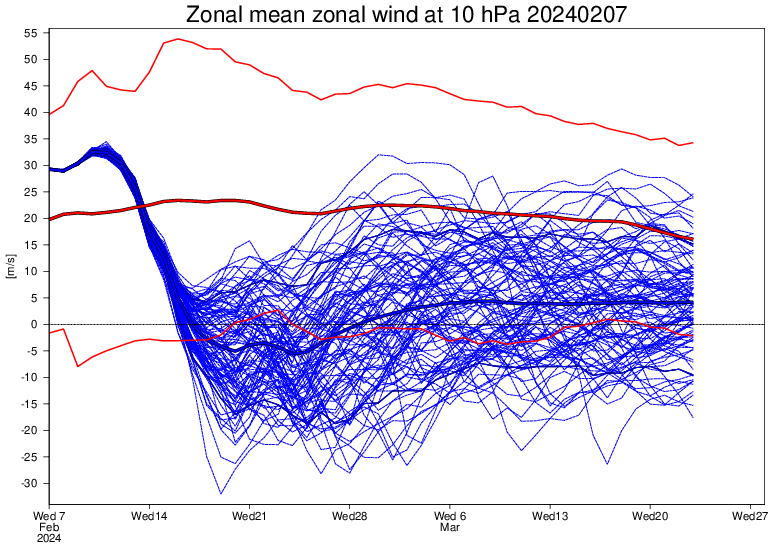
Major SSW likely now per yesterday’s models: look out for increasing chance for cold E US March
Euro ensemble:
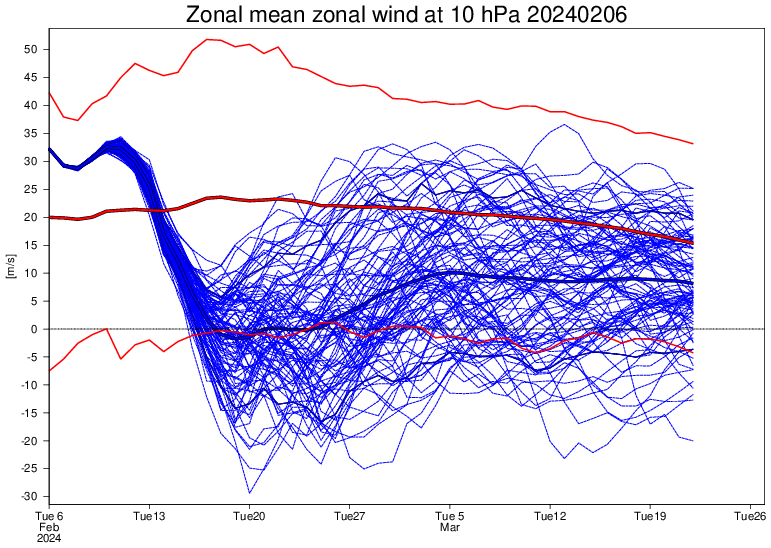
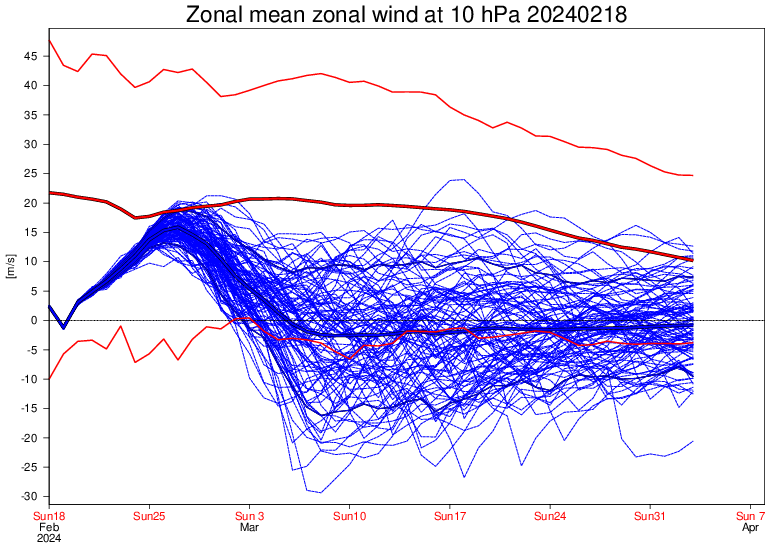
GEFS:
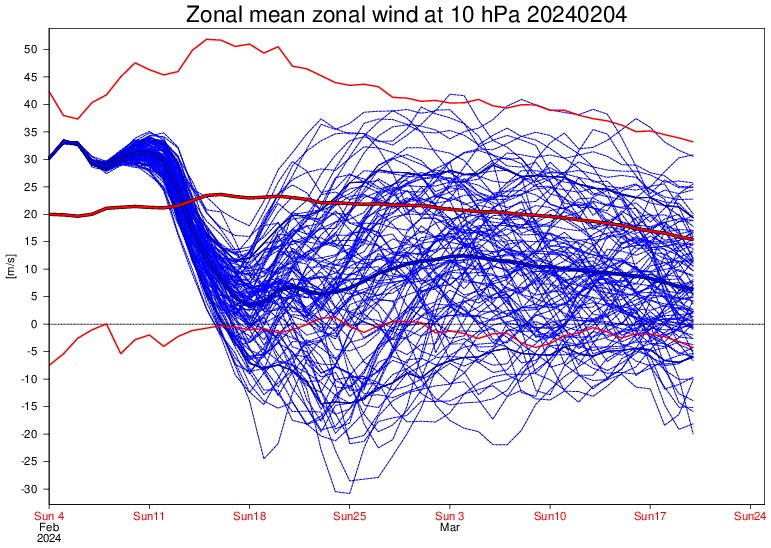
GFS, Canadian and FNMOC ensembles:
Thanks Larry! Great stuff! Best time in human history to be able to follow this stuff. It’s awesome, challenging, fun and connects us weather nuts!
Thanks, Mike!
Wow, this may end up being one for the record books if this is any indication. This Euro Weeklies run’s mean hangs around -5 for a week and then never rises back above +5 (through Mar 23)! Most of these reversal dates are within Feb 15-17 and with a good chance for a dip to sub -10.
WOW! is right, Larry!
You brought it to our attention first!
Re: Major Sudden Strat. Warming: chance increasing in early Jan
By WxFollower - Feb. 3, 2024, 2:31 p.m.
Thanks, Mike. It looks like this major SSW reversal date will likely be Feb 18, two days after last year’s Feb 16, with a dip to -1 on Feb 19. In addition, look how after a quick rebound the mean goes back down with another reversal/SSW implied to be likely in early Mar (we’ll see)!
Euro ensemble:
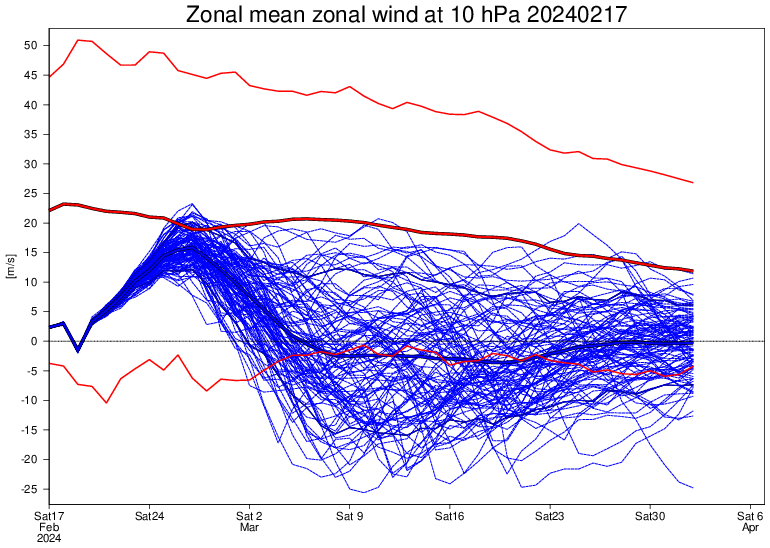
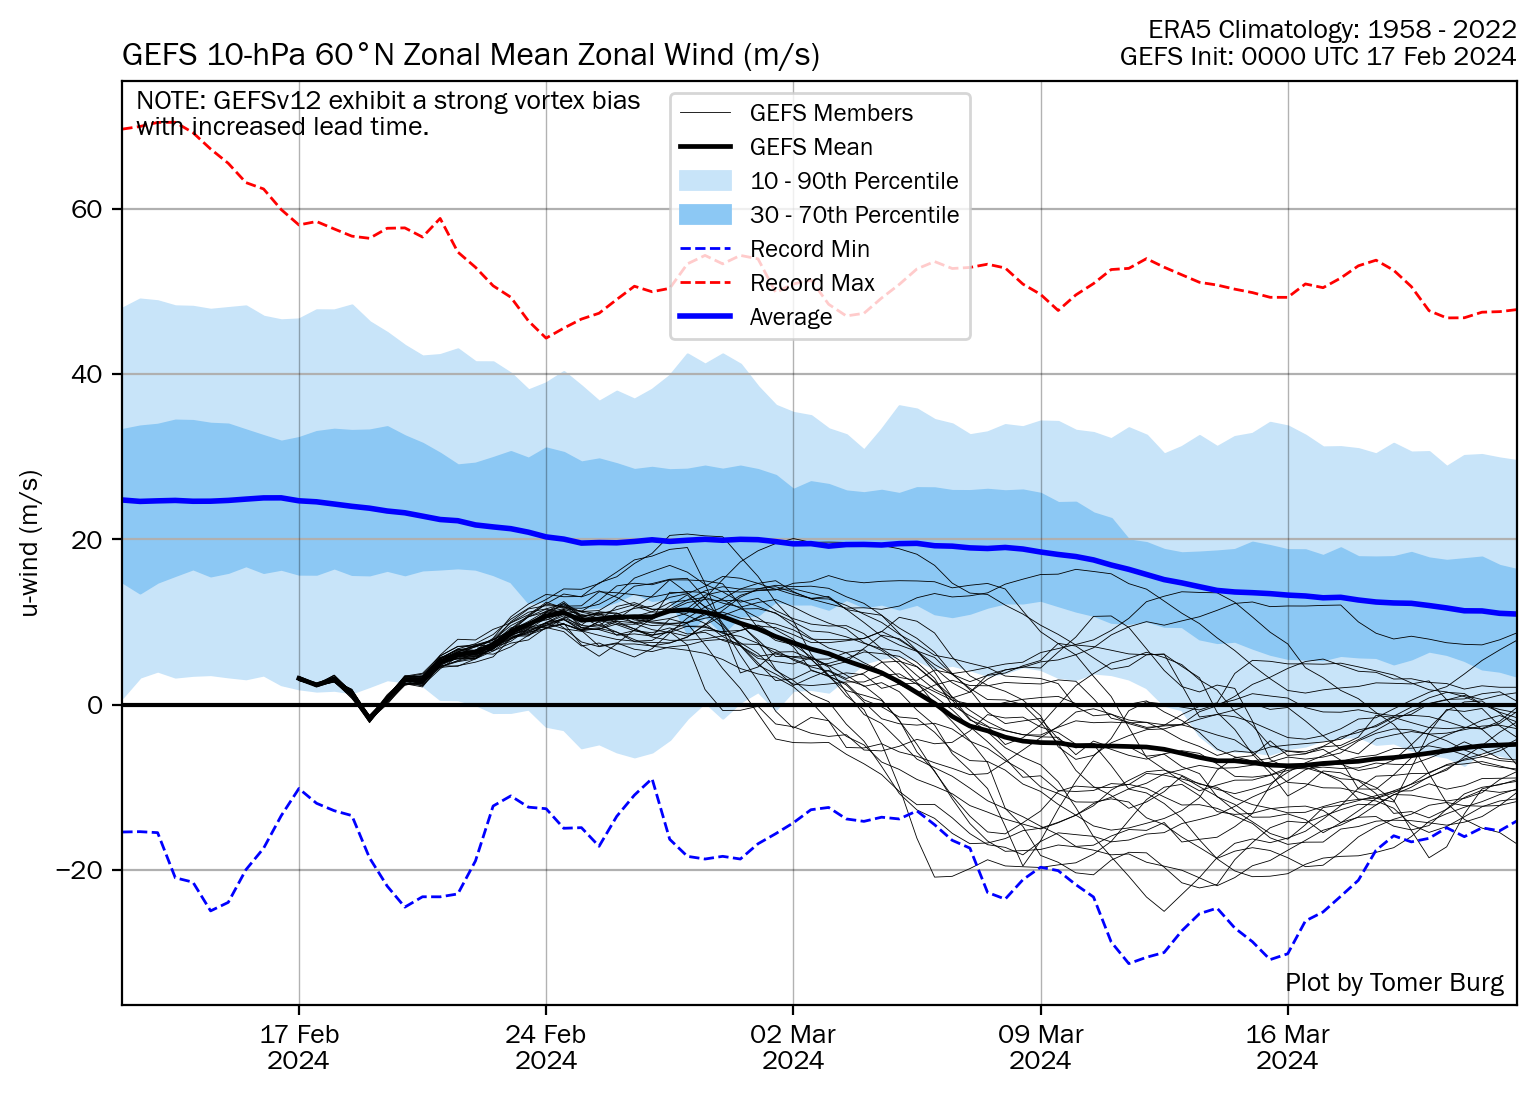
The 0Z Feb 17 GFS ensemble mean looks similar for both:
Thanks a ton for bringing this up so many times in 2024, Larry.
I had never followed the Stratospheric wind very close until this year.
So my ability to evaluate the significance and what the consequences will be to our future weather is limited but I'm trying to learn fast.
The thing that is especially obvious this year is that SSW's sometimes DO NOT result in cold outbreaks anywhere in the mid latitudes.
Sometimes yes but very often no. And more often than not, for a specific longitude, it appears to be more likely that a SSW will NOT mean a major cold outbreak.
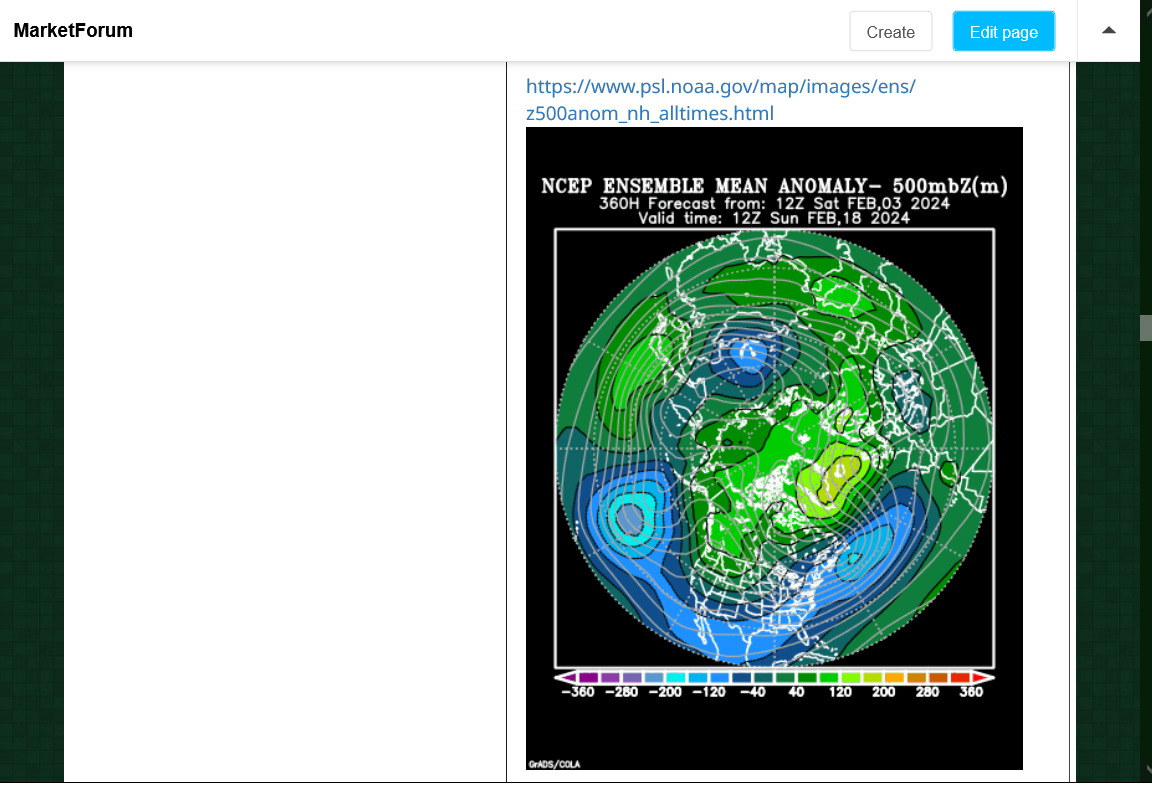
And with this latest forecast having the Stratospheric wind ensemble mean average near 0 for an entire month!!! Is that a freakish anomaly or is it just a bit unusual?
What is the seasonal for this?
I'm trying to correlate this with the weather in the troposphere the next 2 weeks but don't see anything unusual.
This is the 500 mb anomaly map in 2 weeks. Nothing to write home about. Modest positive in the Northeast that is more likely tied to El Nino than this feature.
https://www.psl.noaa.gov/map/images/ens/z500anom_nh_alltimes.html