As expected, the short duration, strong but NOT Super El Nino peaked, late November/December. Temperatures will remain elevated high enough, even while they start falling fast for the strong El Nino to impact weather the next 2 months.
ENSO: Recent Evolution,
Current Status and Predictions
Update prepared by:
Climate Prediction Center / NCEP
22 January 2024
Previous thread:
Relevant Radio 12-18-23/El Nino thread
Started by metmike - Dec. 18, 2023, 12:28 p.m.
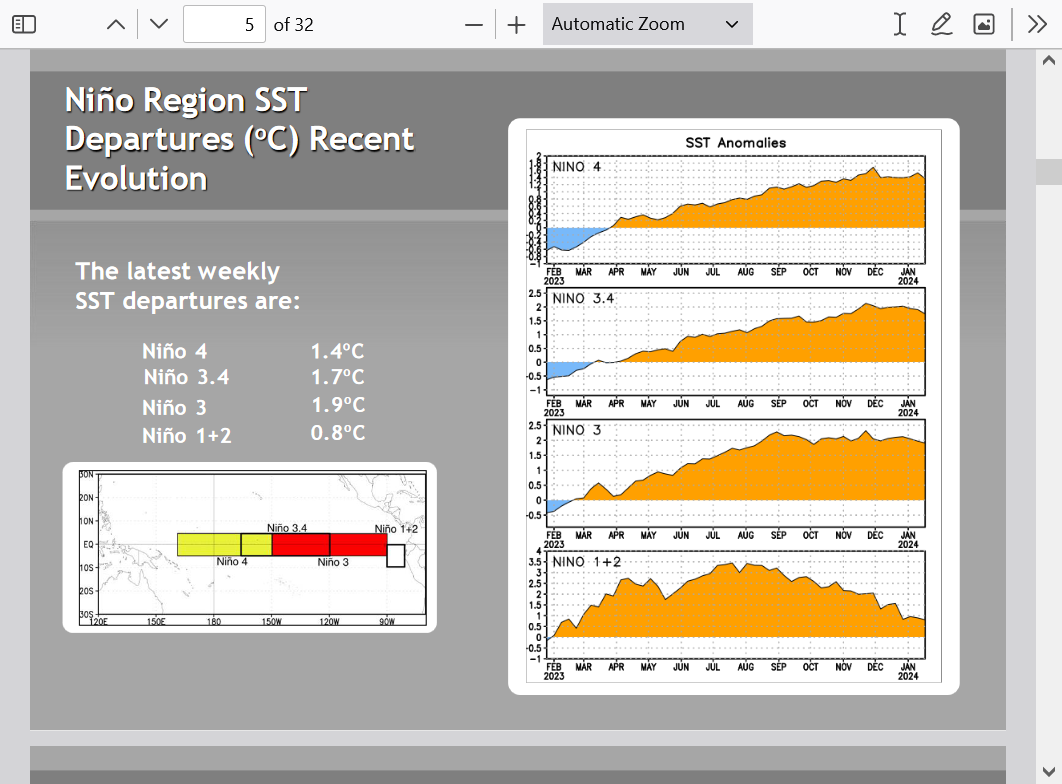
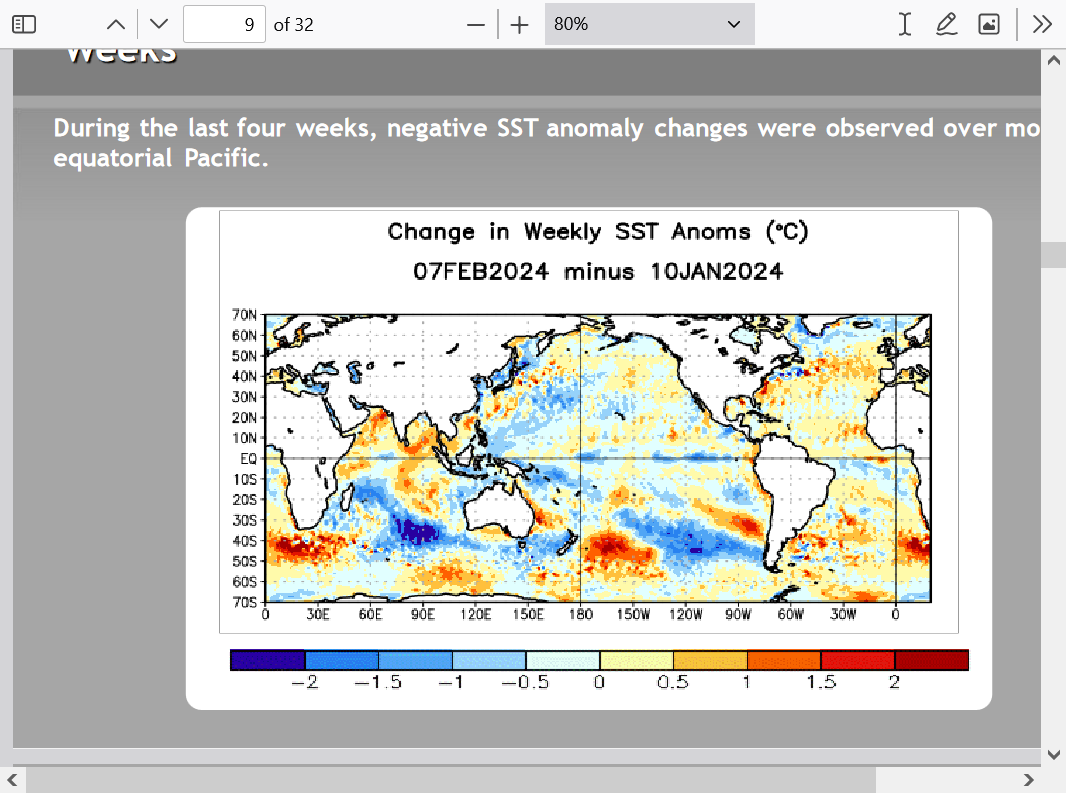
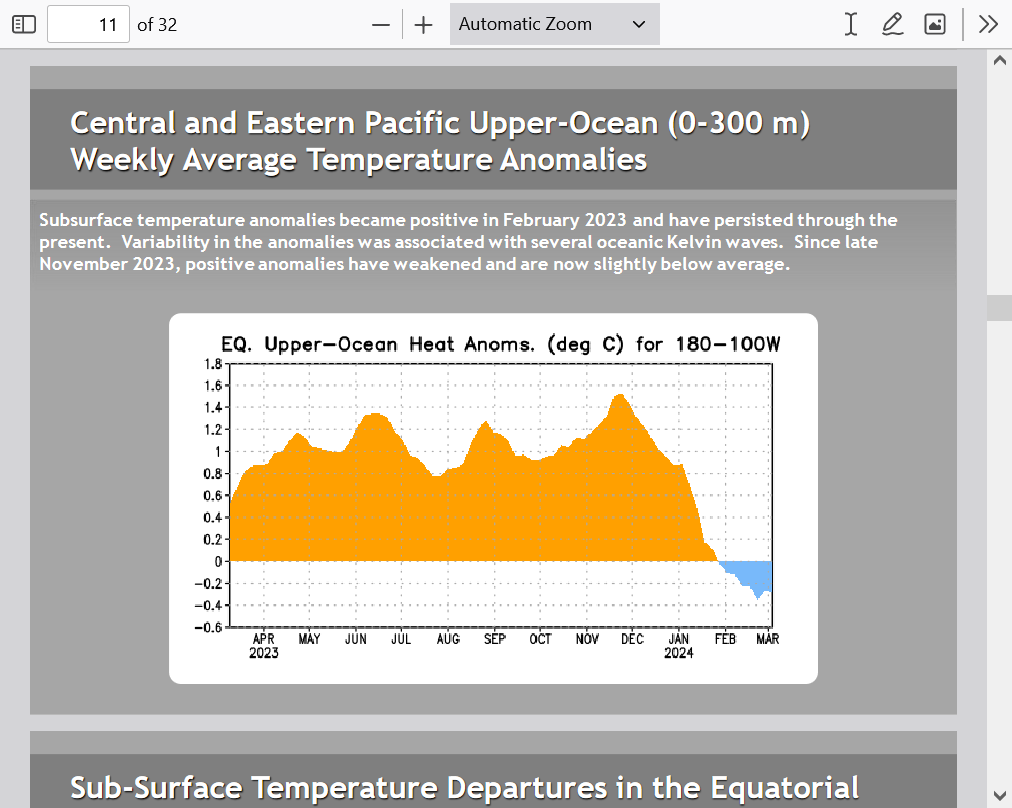
Temps in Nino 1+2 have been crashing lower for 6 months.
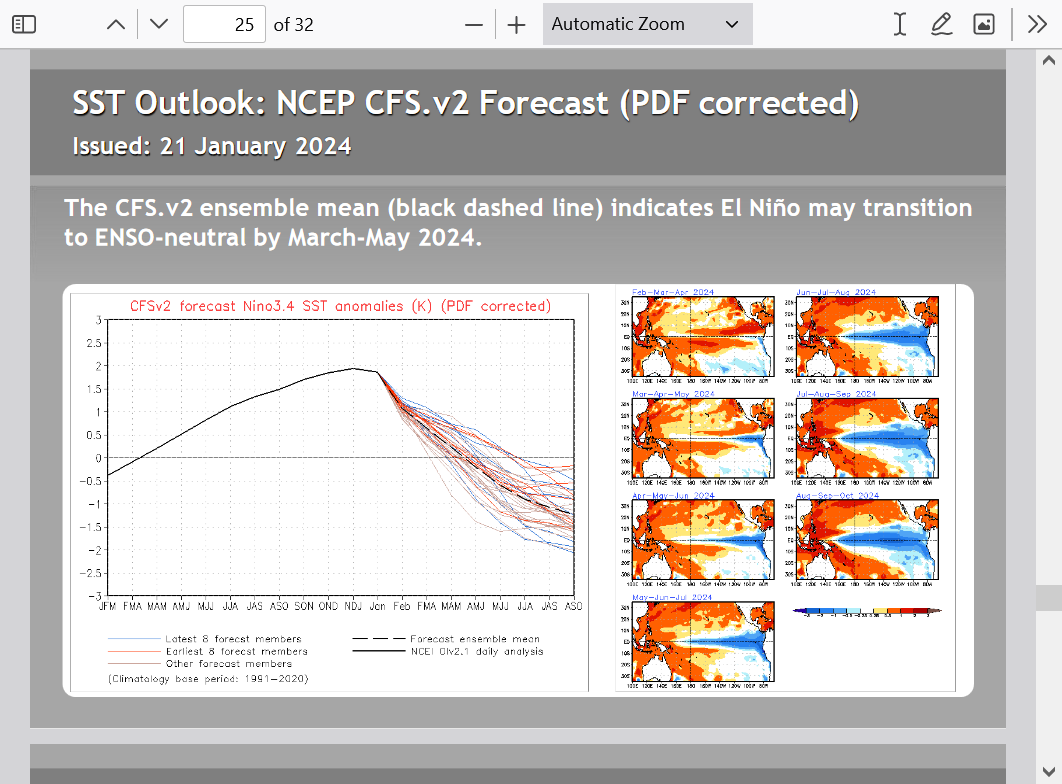
Nino 3.4 is the key El Nino region. Temps are just starting to slowly fall there.
Temps peaked at 2.0 Deg. C and are down to 1.7 Deg. C in Nino 3.4.
This is still pretty impressive below and a fairly strong El Nino will remain, even while dissipating:
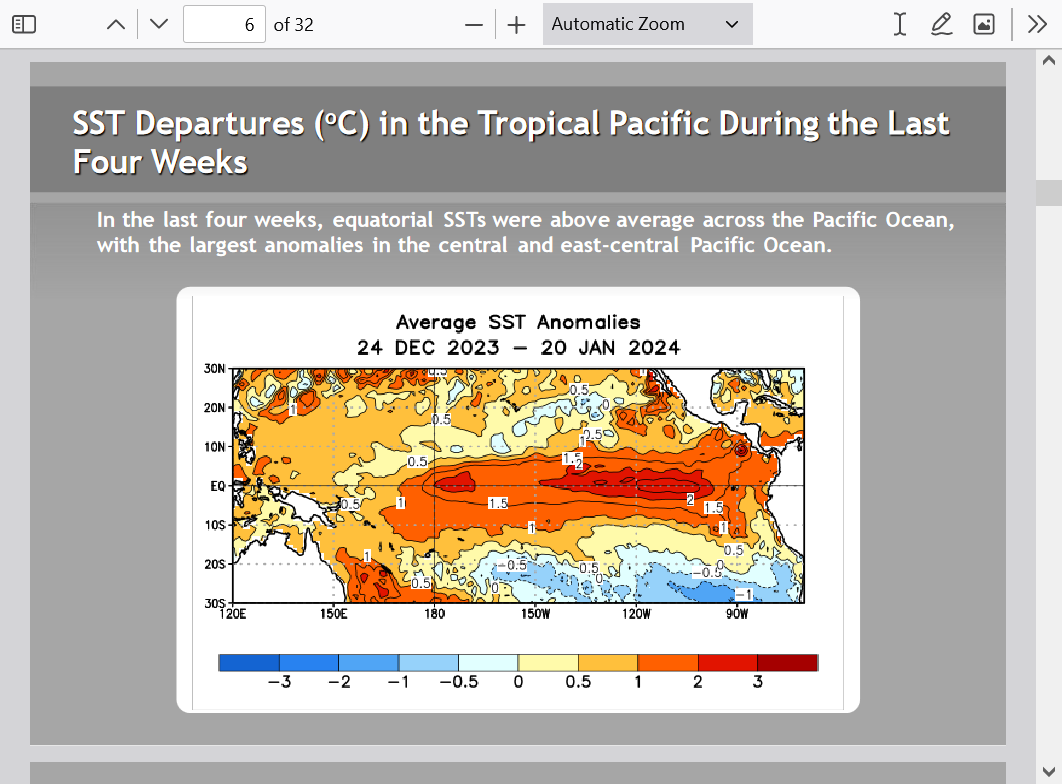
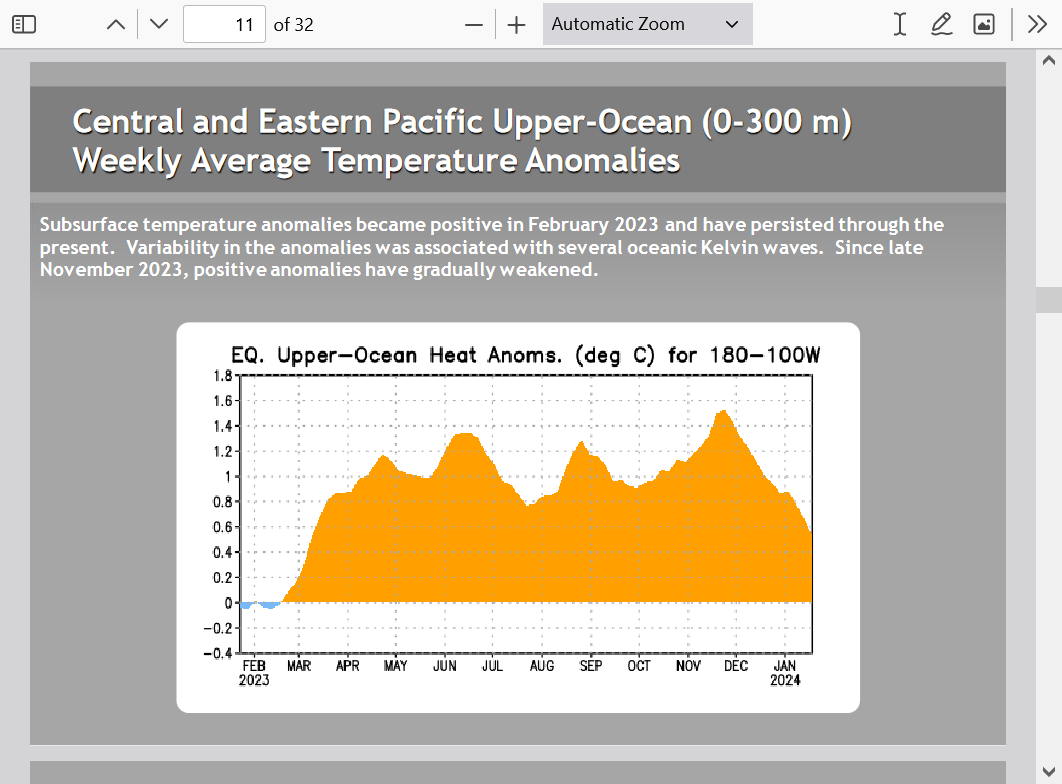
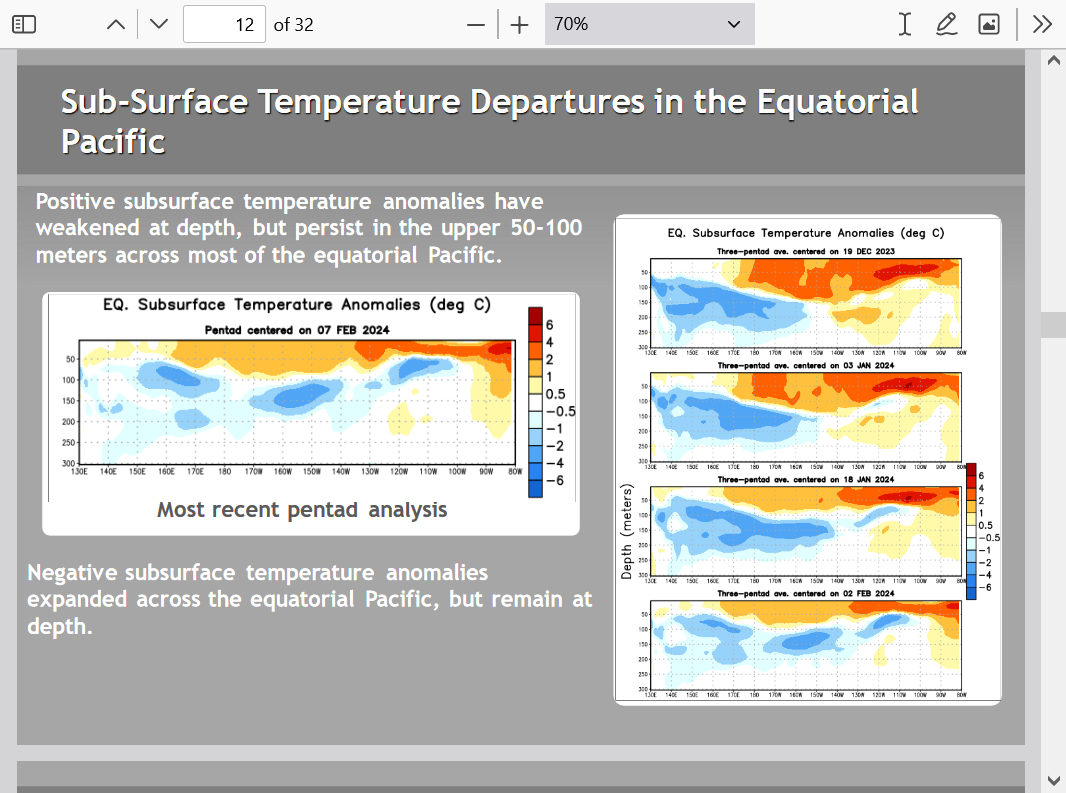
Heat content is dropping overall and at depth in some places.
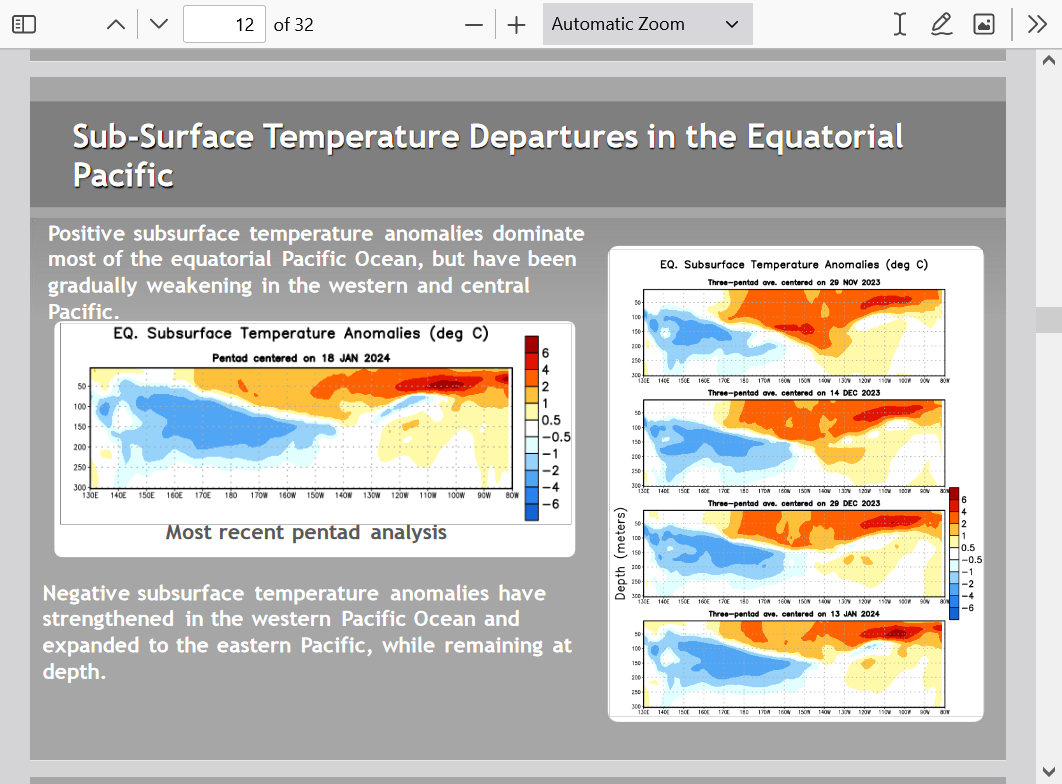
Maps below:
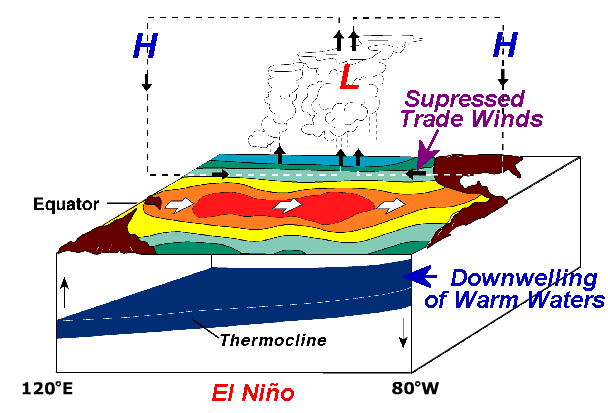
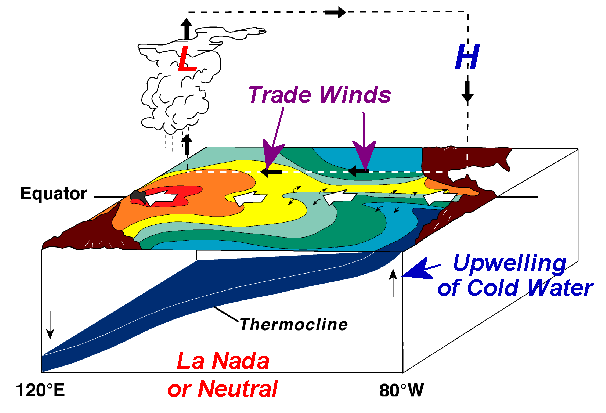
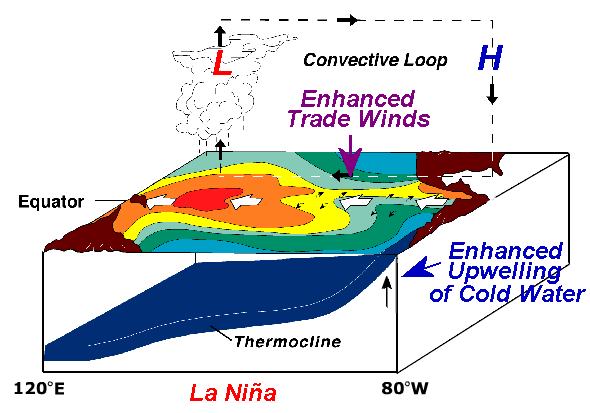
1. Recent Ocean/Atmosphere relationship with El Nino
2. Transition Ocean/Atmosphere relationship this Spring with neutral/La Nada conditions.
3. Forecast Ocean/Atmosphere relationship late Summer/Fall during La Nina.
https://www.weather.gov/arx/why_lanina
++++++++++++++++++++++++++++++++++++++++++++++++++++++++++++++++++++++++++++++++
++++++++++++++++++++++++++++++++++++++++++++++++++++++++++++++
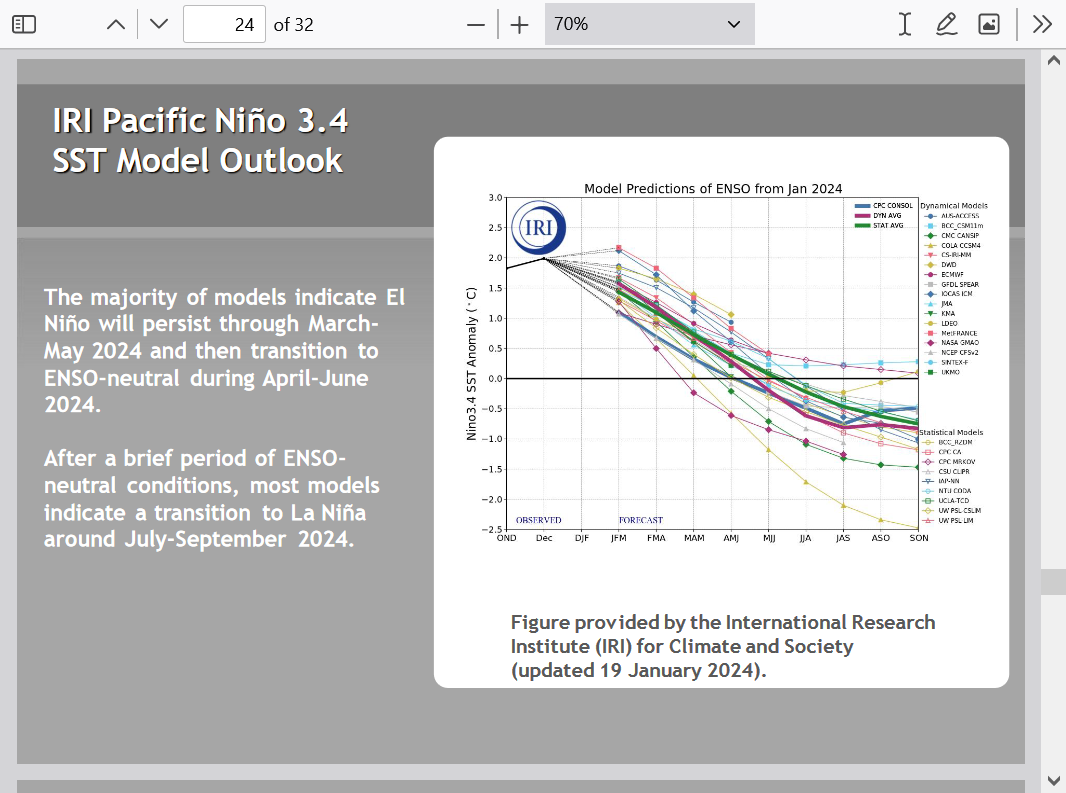
This model is the fastest taking us into La Nina conditions by late Summer. That's an incredibly fast drop so quickly. This model has also had the best skill the last couple of years, so we should give it a great deal of weighting.
Here's another model. Same idea.
The speed at which we transition to the La Nina has strong implications for the upcoming growing season.
The faster it happens, the greater the chance for a heat ridge in the eastern half of the country. Lots of other factors and lots of uncertainty. This is just an historical tendency......that often has exceptions.
https://www.dtnpf.com/agriculture/web/ag/news/article/2024/01/11/weather-outlook-summer-2024-sees-el
The stronger the La Nina, the less wind shear there tends to be in the Atlantic and this creates a more favorable environment for hurricanes there.
https://www.daculaweather.com/4_nino_graphs.php
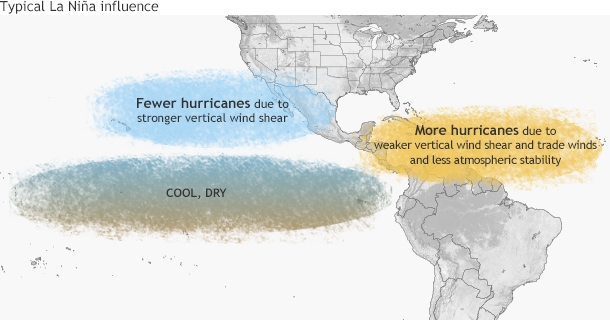
Last hurricane season, the El Nino was a hurricane suppressing force. However, very warm tropical Atlantic water temperatures caused an active hurricane season, despite that.
In 2024, with those warm tropical Atlantic temperatures expected to continue AND a potential La Nina, my initial hurricane forecast is for a very active season!
https://en.wikipedia.org/wiki/2023_Atlantic_hurricane_season
These were most of our posts last hurricane season.
Thanks for all the contributions, especially by WxFollower and Jean getting her feet wet, having fun with the hurricane forecasting!
2023 hurricane season prediction
16 responses |
Started by metmike - May 25, 2023, 7:10 p.m.
https://www.marketforum.com/forum/topic/95535/
Mktfrm 2023 Atlantic Hurricane Season Forecast Contest: deadline *6/4/23*
36 responses |
Started by WxFollower - May 31, 2023, 4:07 p.m.
https://www.marketforum.com/forum/topic/95746/
Here Comes STS Don out in middle of nowhere
15 responses |
Started by WxFollower - July 14, 2023, 1:45 a.m.
https://www.marketforum.com/forum/topic/97220/
2023 Hurricane season status
21 responses |
Started by metmike - Aug. 7, 2023, 11:26 a.m.
https://www.marketforum.com/forum/topic/97993/
TD10/Future Idalia threat to W Florida
28 responses |
Started by WxFollower - Aug. 27, 2023, 3:18 a.m.
https://www.marketforum.com/forum/topic/98571/
TW African coast 9/1: all models develop/could be long tracker; now is Lee
63 responses |
Started by WxFollower - Sept. 1, 2023, 6:16 p.m.
https://www.marketforum.com/forum/topic/98675/
Lee significantly cooled SSTs well ahead of center
6 responses |
Started by WxFollower - Sept. 18, 2023, 8:21 p.m.
https://www.marketforum.com/forum/topic/99073/
Hurricane Tammy +more
23 responses |
Started by metmike - Oct. 22, 2023, 1:09 p.m.
https://www.marketforum.com/forum/topic/99881/
++++++++++++++++++++++++++++++++++++++++
After looking everywhere, I found the best page/link for seasonal analogs for ENSO conditions!
Keep in mind that the Summer ENSO months have much less predictability than Winter months.
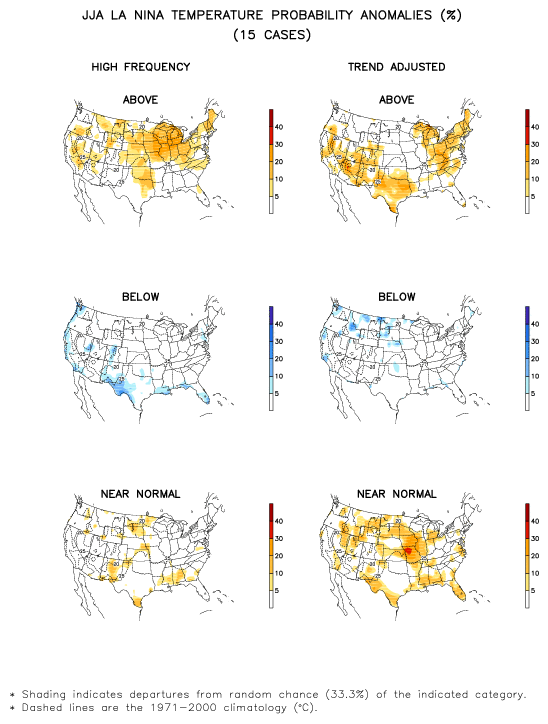
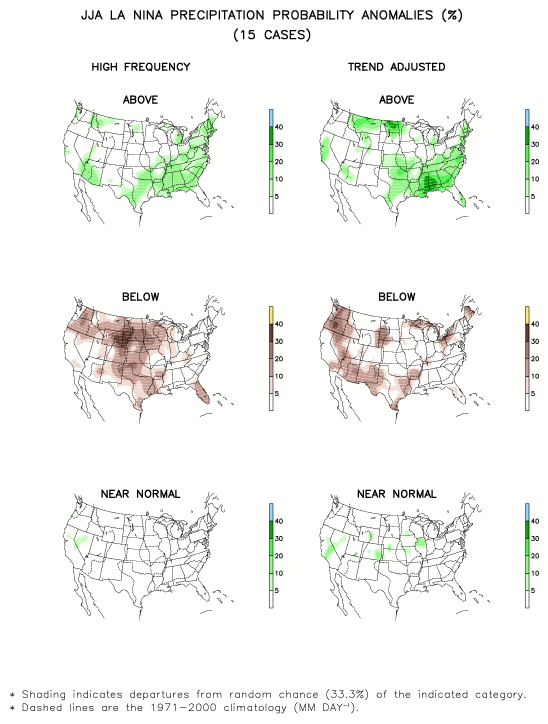
However, the 3 decades that were used for this analysis, clearly show an elevated chance for HOT and DRY weather in the Midwest/Plains.
Wet weather La Nina years, are more likely in the Southeast US than anywhere else.
El Nino's carry with them the exact opposite analogs, so El Nino's are a producers best friend. Hopefully, this La Nina will NOT kick in fast and if it does, hopefully forcing from ocean/atmosphere connections elsewhere overcome this tendency for hot/dry.
One saving grace will be the continuing, massive benefits to ALL plants/crops from the increase in CO2.
Not only is it fertilizer, boosting crop yields by 24% just from the CO2 fertilization (5 ppm =+1% in plant growth and we've increased 120 ppm) but the higher CO2 levels mean that plants don't need to open their stomata as wide to get CO2. This greatly reduces transpiration/water loss and causes ALL plants/crops to be more drought/heat tolerant....conserve plant moisture.
and sell it not; also wisdom, and instruction, and understanding
https://buythetruth.wordpress.com/2009/08/15/co2-enrichment-and-plant-nutrition/
https://www.youtube.com/watch?v=WDWEjSDYfxc
The biggest gift that humans have ever bestowed on our planet has been to rescue it from dangerously LOW CO2 levels (below 300 ppm-with plants partially shutting down) by taking the sequestered form of it OUT OF THE GROUND and putting it back into the air (where it came from) and where its being used as a beneficial gas for life.
Only crony capitalists, corrupt politicians, dishonest scientists/media and misinformed but sincere environmentalists think otherwise with their junk science, fake climate crisis.
Death by GREENING!
35 responses |
Started by metmike - May 11, 2021, 2:31 p.m.
https://www.marketforum.com/forum/topic/69258/

https://www.cpc.ncep.noaa.gov/products/precip/CWlink/ENSO/enso.anal.shtml
Adrian Linares@AdrianLinares28
This is about as favorable look as you can get for hurricanes on the new February CanSIPS for the peak of the 2024 Atlantic hurricane season.
I just posted this at AnericanWx in the SE US regional forum:
The potential isn’t going away folks. Rather, it is persisting and as we get closer it is increasing. The potential on the 6Z GEFS for widespread significant wintry precip during a portion of Feb 15-20 in NC and more specifically from a classic Miller A GOM originating low throughout a large portion of the SE during a portion of Feb 17-20 is about as high as I can remember on any GEFS in recent years when looking out 11-16 days. When I consider not only the actual panels of the run but also similar model runs of the last few days along with the progged solid +PNA/-EPO/-AO, neutral to -NAO, a persistent 50/50 low, a strong El Niño related subtropical jet/split flow, and moderate+ Nino mid to late Feb climo, it is hard to hold in my enthusiasm for what MAY occur. And it is always a matter of what MAY and never nowhere near what WILL when looking out 11-16 days. The MAY is why we have these forecast discussion threads as opposed to nonexistent crystal ball threads.
Classic split flow:
Many members with Miller A GOM/off SE coast lows:
Thanks much, Larry.
You're exactly right. Speculating out in week 2 about potential high end events when there is the highest potential for being extreme is one of the most exciting parts of meteorology.
I picked this 850 mb temp map from the just out 12z Euro Ensembles which is when the cold air is most entrenched/farthest southeast on February 16th.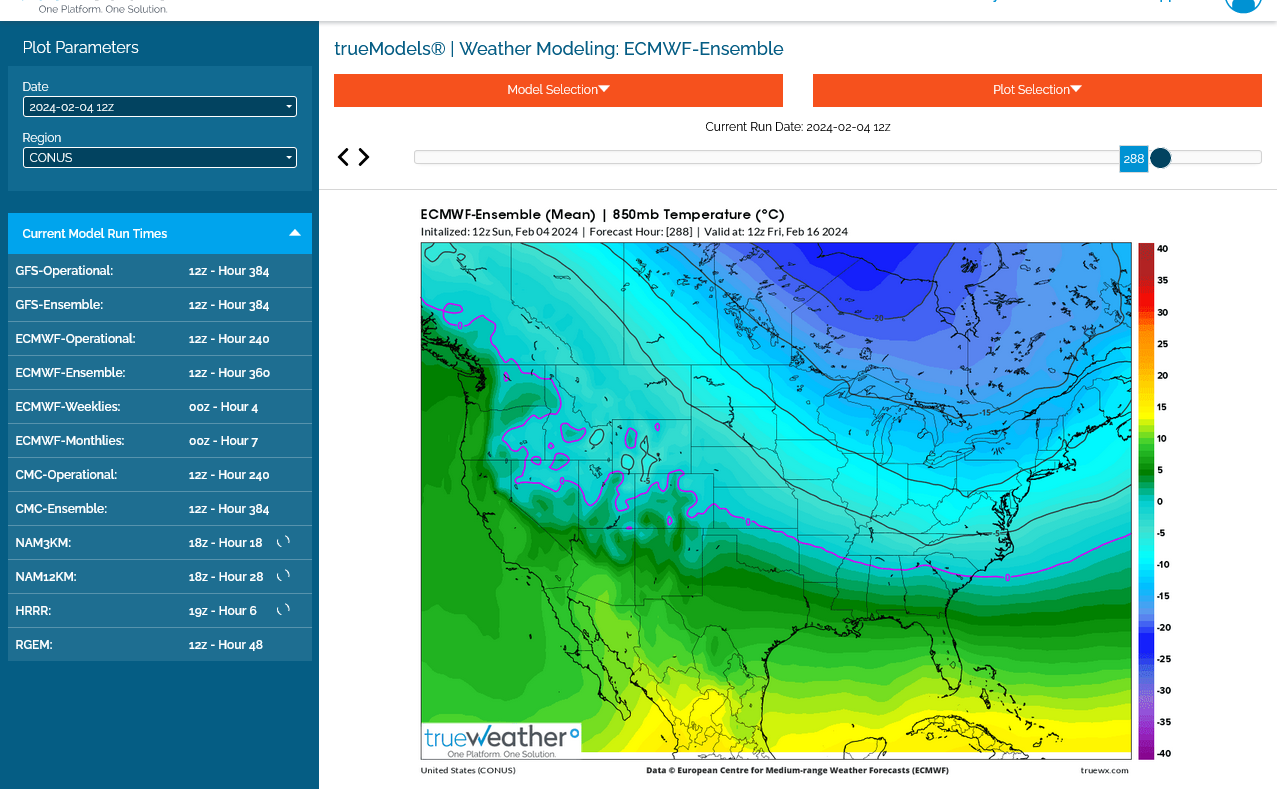
By metmike - Feb. 5, 2024, 2:25 p.m.
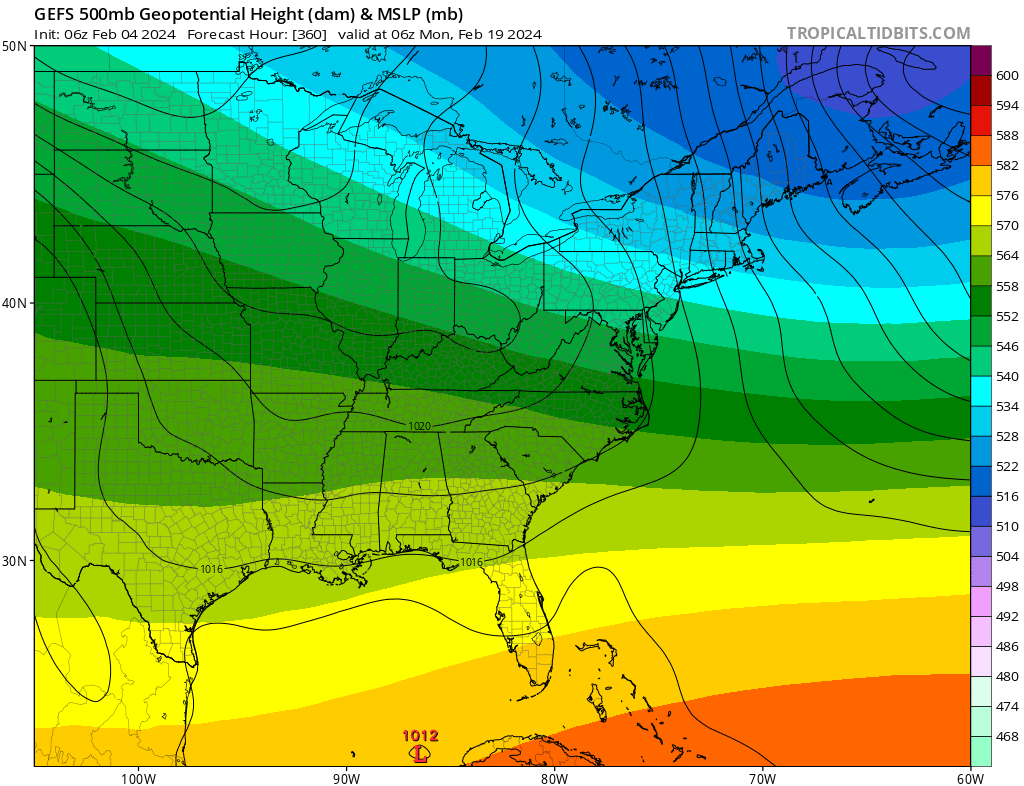
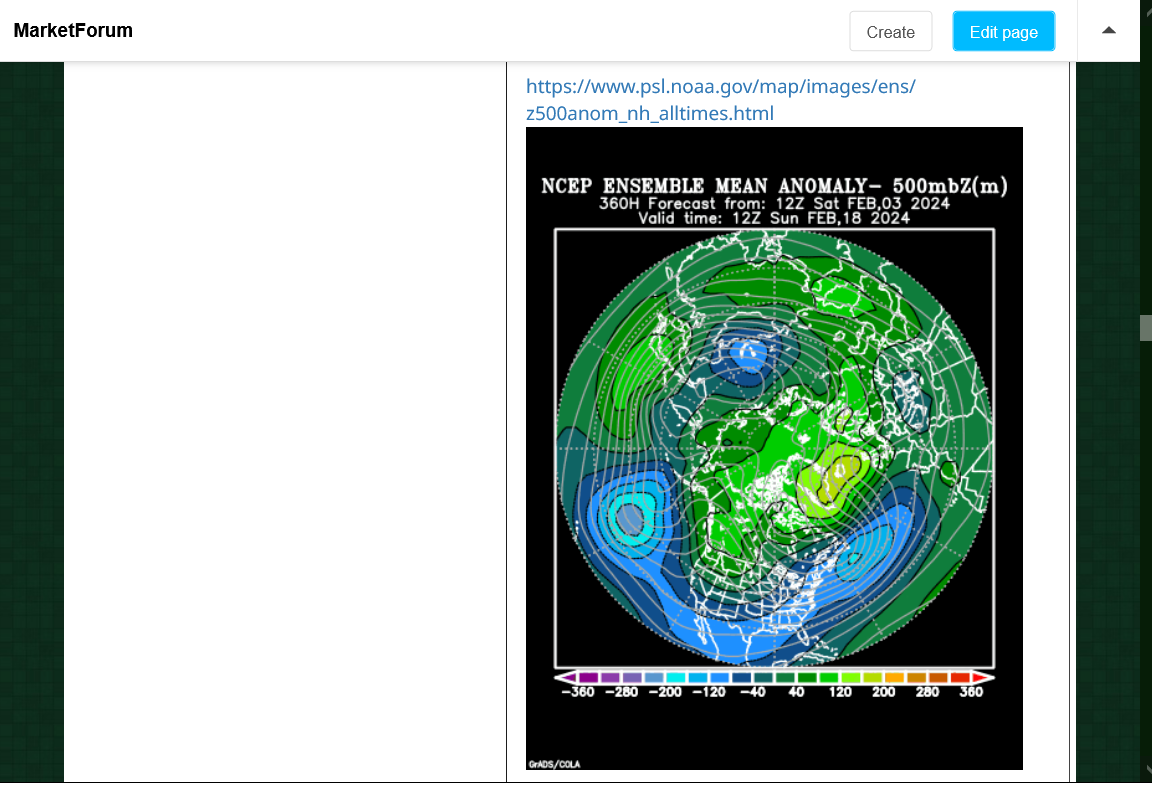
This was the last 500 mb anomaly map for the latest 12 GEFS at 384 hours(Feb 21) Shown to illustrate that the negative anomalies in the south are completely a result of the El Nino, Pacific origin Southern Stream teleconnection.
The displaced Polar Vortex is just above the top of the map, so this will NOT feature a favorable steering current for the delivery of cold air from the Northern Stream.
However the SURFACE/LOW LEVEL, dense, very cold air associated with it will get some pushes south into the United States, thanks in part to some modest ridging in Western Canada to the Rockies in the U.S.
Some of that cold will be captured by the circulations associated with the negative upper level southern stream anomalies.
This COULD result in snow/ice at a latitude unusually far south for the month of February!
However, this is NOT the type of pattern that will feature anything but modest cold.

ENSO: Recent Evolution,
Current Status and Predictions
Update prepared by:
Climate Prediction Center / NCEP
12 February 2024
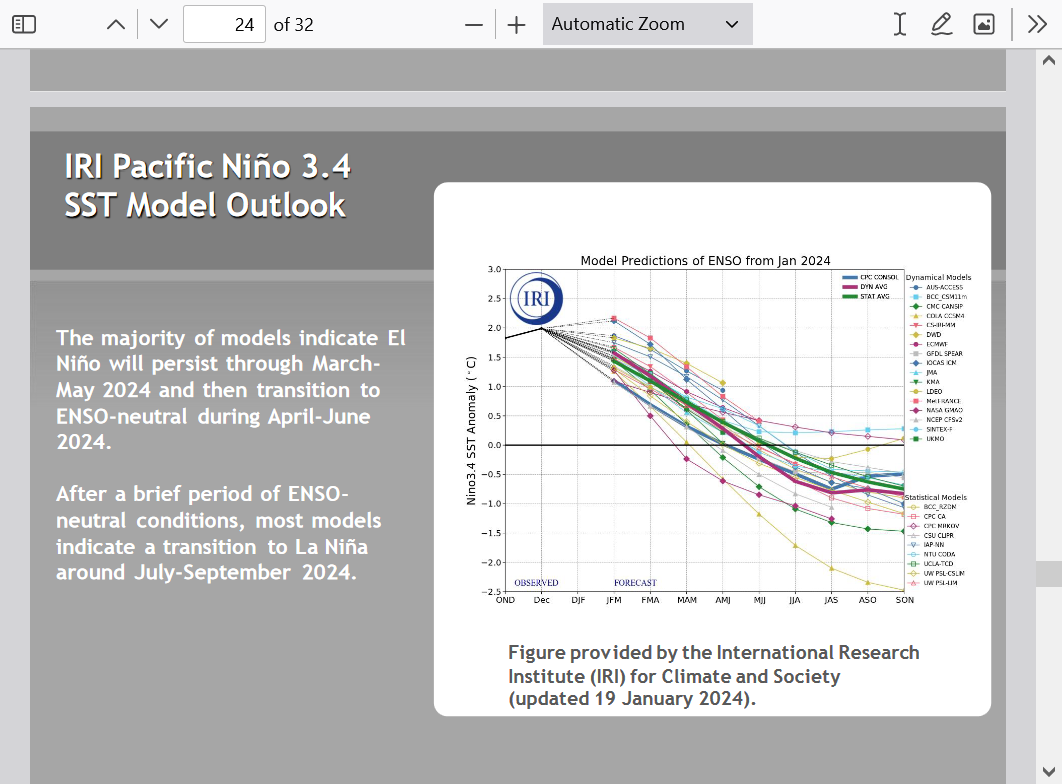
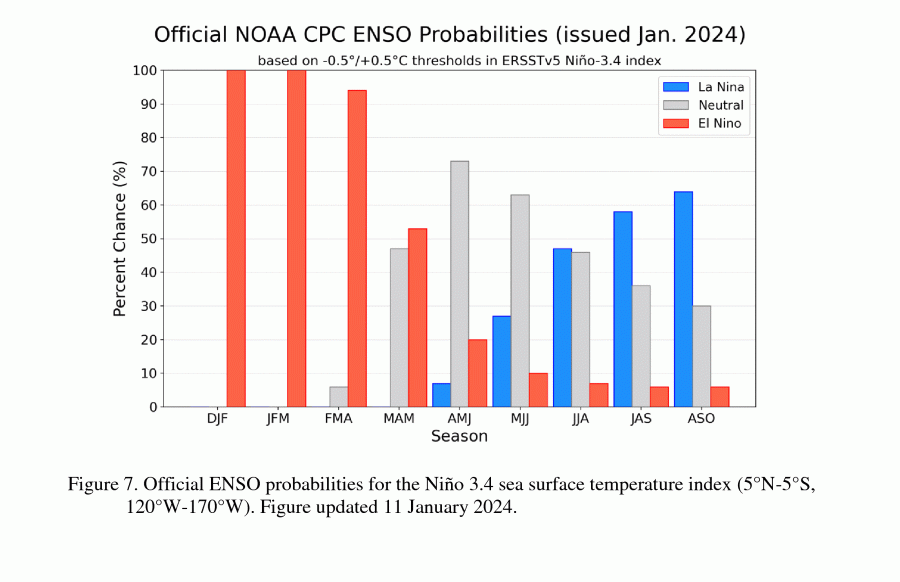
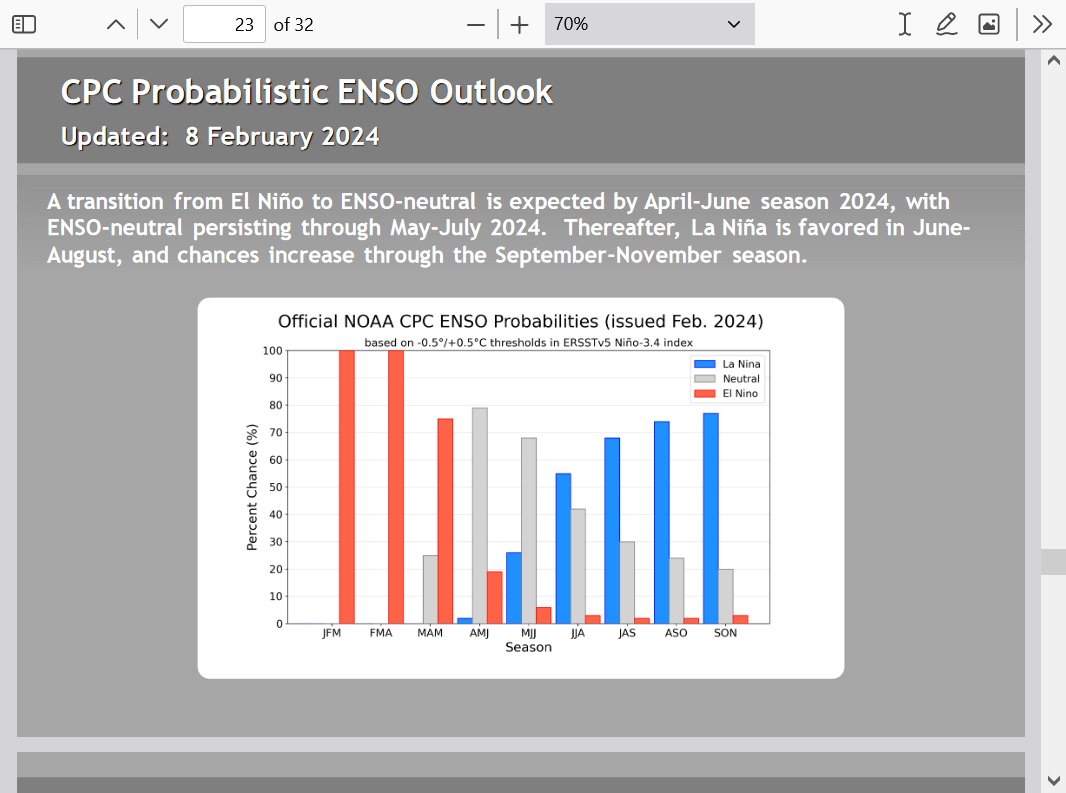
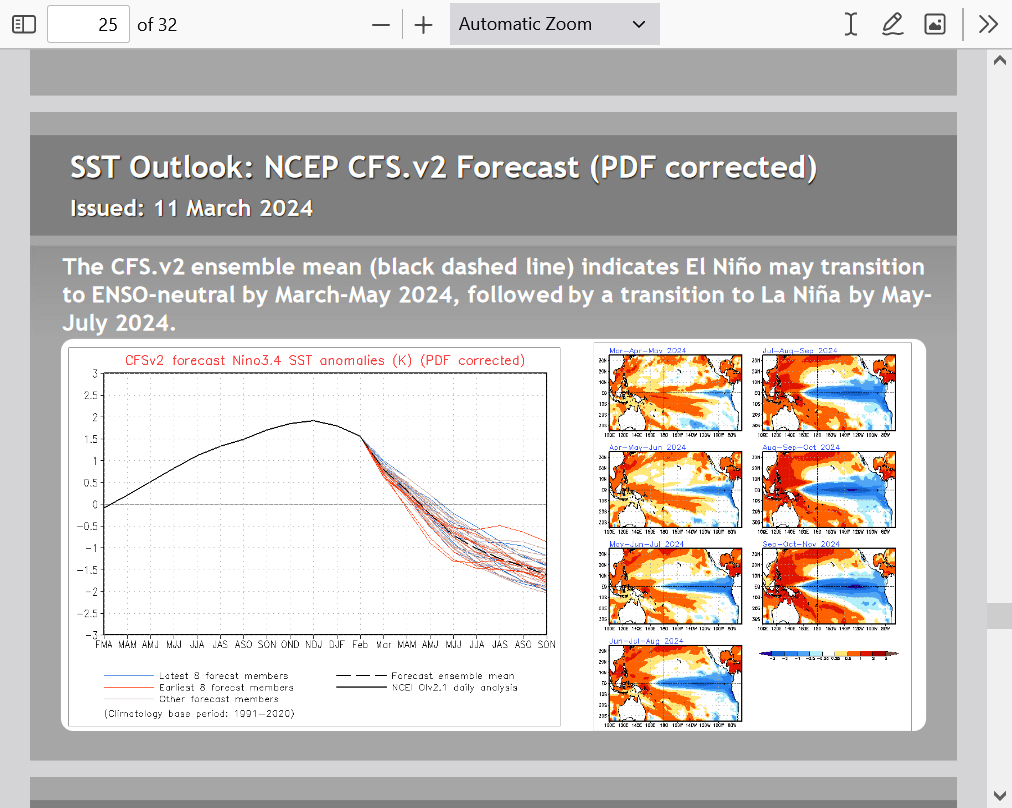
The tropical Pacific atmospheric anomalies are consistent with El Niño.
A transition from El Niño to ENSO-neutral is likely by April-June 2024 (79%
chance), with increasing odds of La Niña developing in June-August 2024 (55% chance)
Temperatures in the Pacific are starting to crash hard! The strong El Nino will end quickly and La Nina be here already by late Summer. Wow, That's fast!
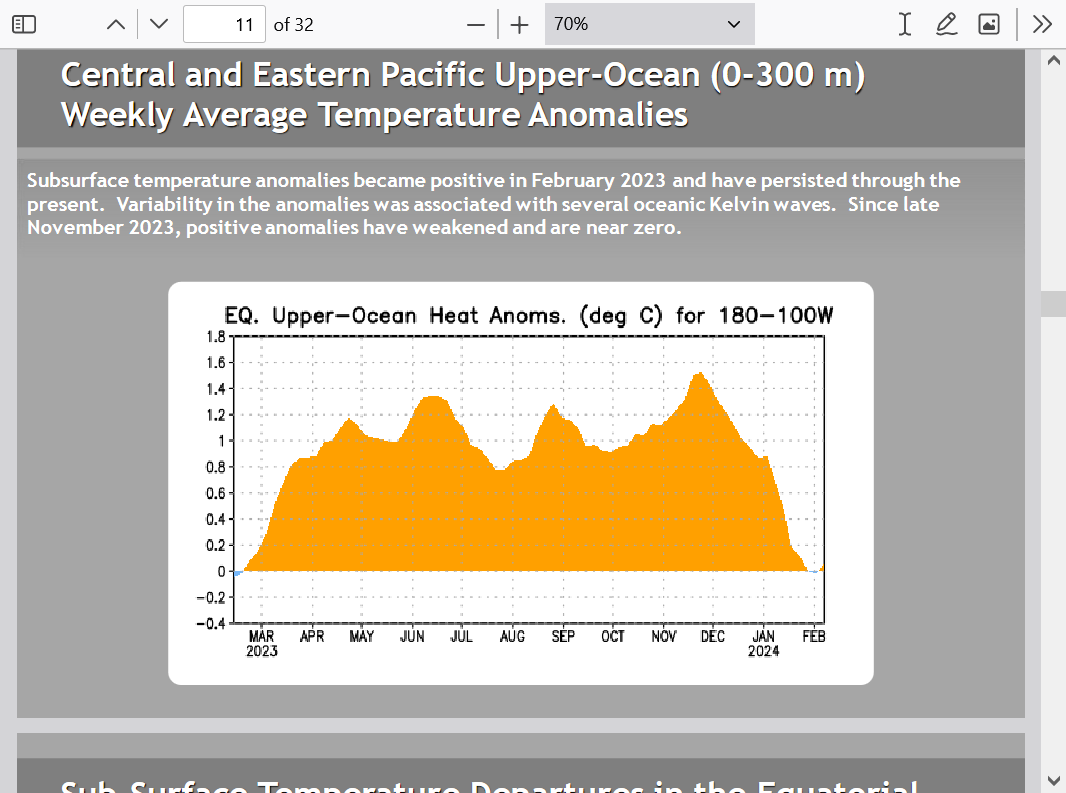
The models agree on the upcoming La Nina developing within 6 months from the current strong El Nino.

We discussed what that might mean to the upcoming Summer/Fall seasons last month:
https://www.marketforum.com/forum/topic/101854/#101858
It means an ELEVATED risk for a very active hurricane season because tropical Atlantic temps are also warm.
The earlier and stronger the La Nina, the greater the risk for Hot/dry in parts of the Cornbelt this Summer.
From the Cliff Mass Weather Blog
https://wattsupwiththat.com/2024/02/13/why-does-el-nino-influence-west-coast-weather/
I just posted this at AmericanWx:
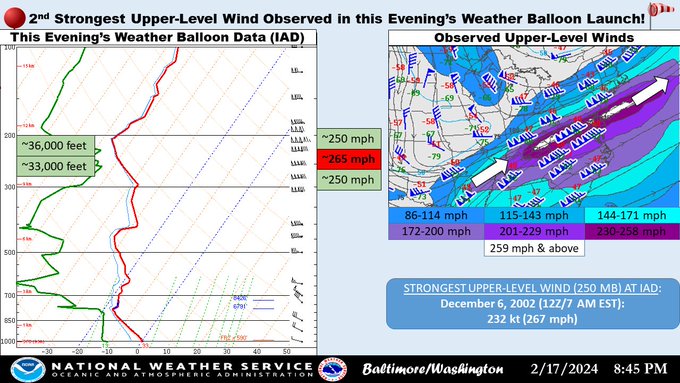
Here’s an interesting tweet stating that the DC area’s Dulles airport (IAD) this evening (0Z of 2/18/24) had its 2nd strongest recorded upper level wind going back to mid 20th century (230 knots from WSW at ~34-35K ft associated with the split flow squeeze). It missed the strongest (12/6/2002, another Nino) by only 2 knots!
 NWS Baltimore-Washington@NWS_BaltWash
This evening's weather balloon launch detected the 2nd strongest upper-level wind recorded in local history going back to the mid 20th century! Around 34,000-35,000 ft, winds peaked around 230 kt (265 mph!). For those flying eastbound in this jet, there will be quite a tail wind.
Great stuff, Larry!
There it was several hours ago on this last 0z run of the GFS at 250 mb.
The top, yellow color is 200+ KNOTS, which is around 230+ mph!
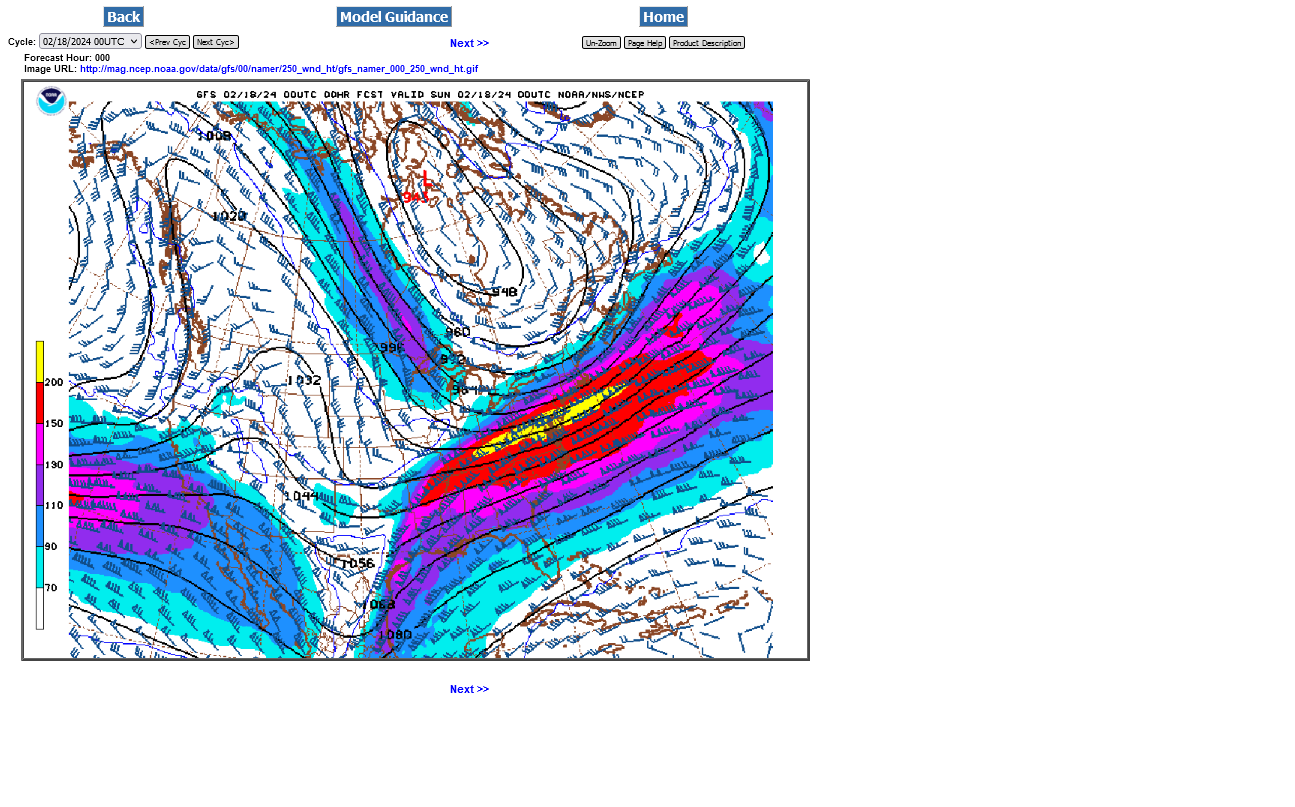
How high up is 250 mb??? Around 34,000 feet, which is around 6.5 miles above the ground.
https://www.boqueteweather.com/millibars_altitude.htm
| Level | Standard Height | |
| 1000 MB | 364 ft | 111 m |
| 925 MB | 2498 ft | 762 m |
| 850 MB | 4781 ft | 1458 m |
| 700 MB | 9882 ft | 3013 m |
| 500 MB | 18289 ft | 5576 m |
| 400 MB | 23574 ft | 7187 m |
| 300 MB | 30065 ft | 9166 m |
| 250 MB | 33999 ft | 10366 m |
| 200 MB | 38662 ft | 11787 m |
| [Boqueteweather.com] | ||
| Copyright © 2007 Boqueteweather.com | ||
++++++++++++++++++
https://oceanservice.noaa.gov/facts/nautical-mile-knot.html
Nautical miles are used to measure the distance traveled through the water. A nautical mile is slightly longer than a mile on land, equaling 1.1508 land-measured (or statute) miles. The nautical mile is based on the Earth’s longitude and latitude coordinates, with one nautical mile equaling one minute of latitude.
+++++++++++++
https://www.maximum-inc.com/learning-center/what-is-knot-speed/
++++++++++++++++++
https://www.thoughtco.com/measuring-wind-speed-in-knots-3444011
| Unit of Measure | |
|---|---|
| Surface winds | mph |
| Tornadoes | mph |
| Hurricanes | kts (mph in public forecasts) |
| Station Plots (on weather maps) | kts |
| Marine forecasts | kts |
+++++++++++++++++++
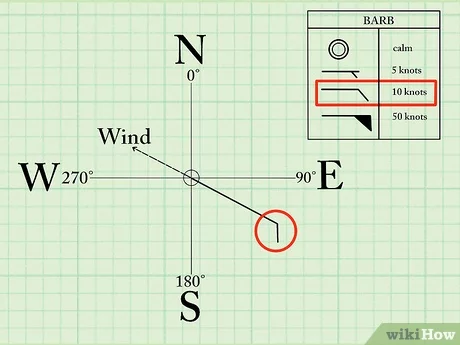
https://www.wikihow.com/Read-Wind-Barbs

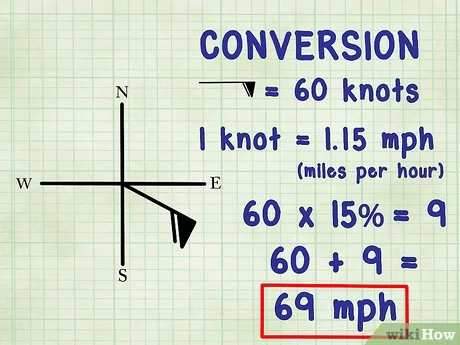
Thank you, Mike!
I just posted this at AmericanWx:
Look at how badly the GEFS (other models were similar) busted with the very strong -AO predictions made 2/6-8 for 2/13-20:
2/6 predicted -3.5
2/7 predicted -3.0
2/8 predicted -3.2
2/6 prediction: -3.5 for 2/13-20 (all days sub -3.0!)

Actual: -0.6 for 2/13-20 (2/16-20 all ended up above all 30 2/6 prediction’s members!)

https://ftp.cpc.ncep.noaa.gov/cwlinks/norm.daily.ao.gefs.z1000.120days.csv
Exactly, Larry!
https://www.marketforum.com/forum/topic/101402/#102120
We should note that the AO is a function of the weather model solutions.
If the weather maps end up being wrong, the AO values that were derived from those weather maps will be wrong.
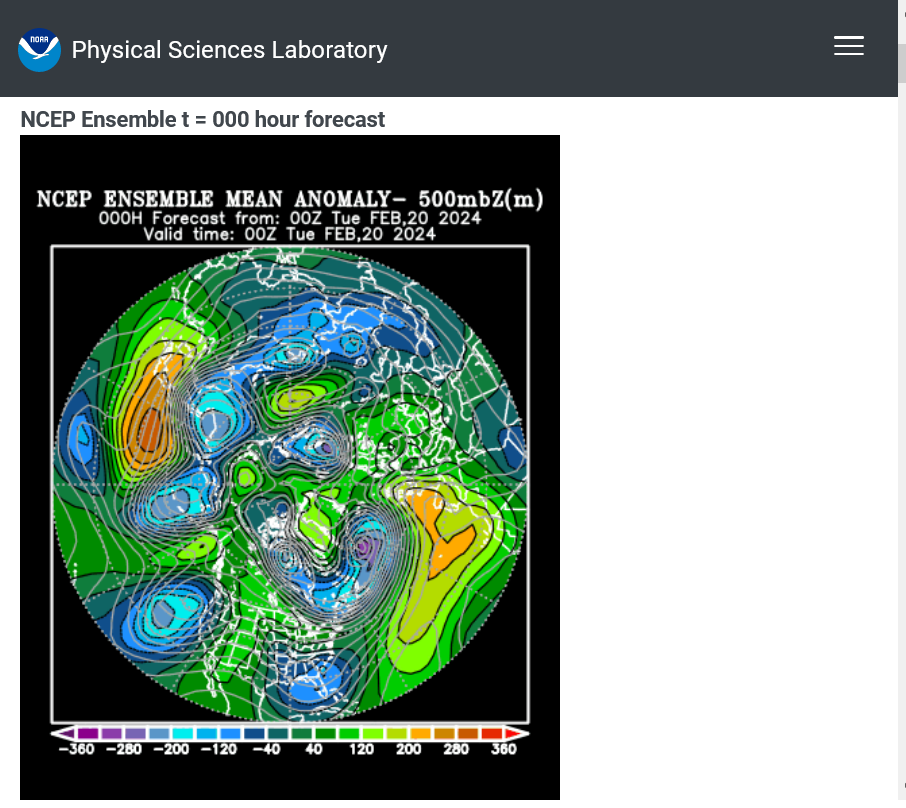
1. This was the forecast with 500mb anomalies for 2 weeks out in early February:
Note the HUGE area of high latitude positive anomalies(from the northern stream), centered over Greenland and extending westward across most of Canada with a wide swath of negative, mid latitude anomalies from the W.Atlantic, westward to the East Coast, then the southern US and west to the Pacific from the El Nino/southern stream.
A high magnitude ---AO index, ALWAYS features strong positive anomalies in the high latitudes and negative anomalies in the mid latitudes.
2. This was the same map from the last OBSERVATION last night.
The powerful ---AO couplet between the high and mid latitudes from the map above is NON existent. The models got the pattern completely wrong.
Instead, we have zonal, Pacific flow across the country. Canada and Greenland DO NOT have a blocking high latitude ridge.
There are 2 strong positive anomalies.
1 is on the other side of the Atlantic Ocean. The other one looks like its in the northwest Pacific. Neither impacting us directly and neither in a place that impacts the AO much.
+++++++++++++
This was the last ENSO update, El Nino dying very fast: La Nina on the way!
The sooner and stronger, the higher the risk for hot/dry in the Cornbelt this Summer!
Eastern tropical Pacific water temps plunging!
Much cooler sub-surface temps emerging.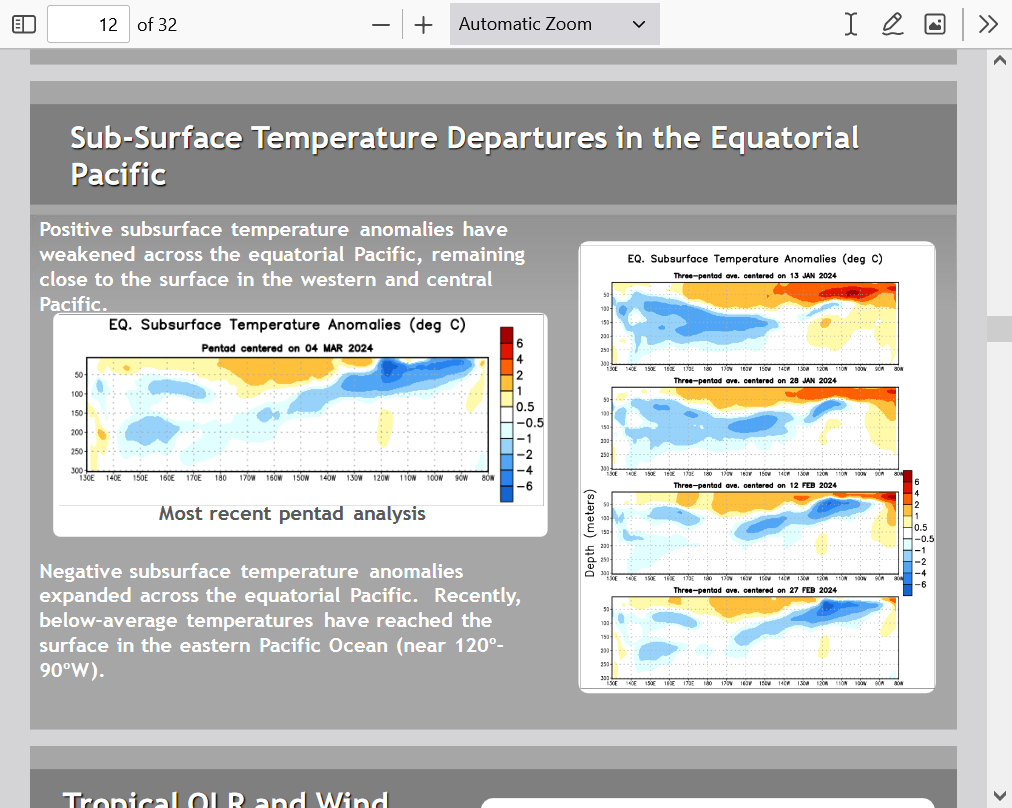
Model forecasts bring La Nina in fast.
The discussion related to La Nina coming on strong this Summer was here and has not changed:
https://www.marketforum.com/forum/topic/101854/#101858
https://www.marketforum.com/forum/topic/101854/#101859
https://www.marketforum.com/forum/topic/101854/#101860
There are other things besides the La Nina that can dominate our growing season weather.
One of them is the trend the last 3 decades of cooler daytime reading and more rainfall thanks to the micro climate caused by the nearly 100 million acres of tightly packed rows of corn with the resulting big increase in evapotranspiration.
Summer Climate Change in the Midwest and Great Plains due to Agricultural Development during the Twentieth Century