https://www.cbsnews.com/video/millions-in-california-face-historic-rain/
Evacuation orders have been issued in parts of Los Angeles County as a powerful storm brings heavy rain and dangerously high winds to the area. California Gov. Gavin Newsom declared a state of emergency for eight counties over the weekend. CBS News' Elise Preston reports.
Look at what the reporter is showing in the background..........a foot and a half of water in a spot that residents said typically floods all the time
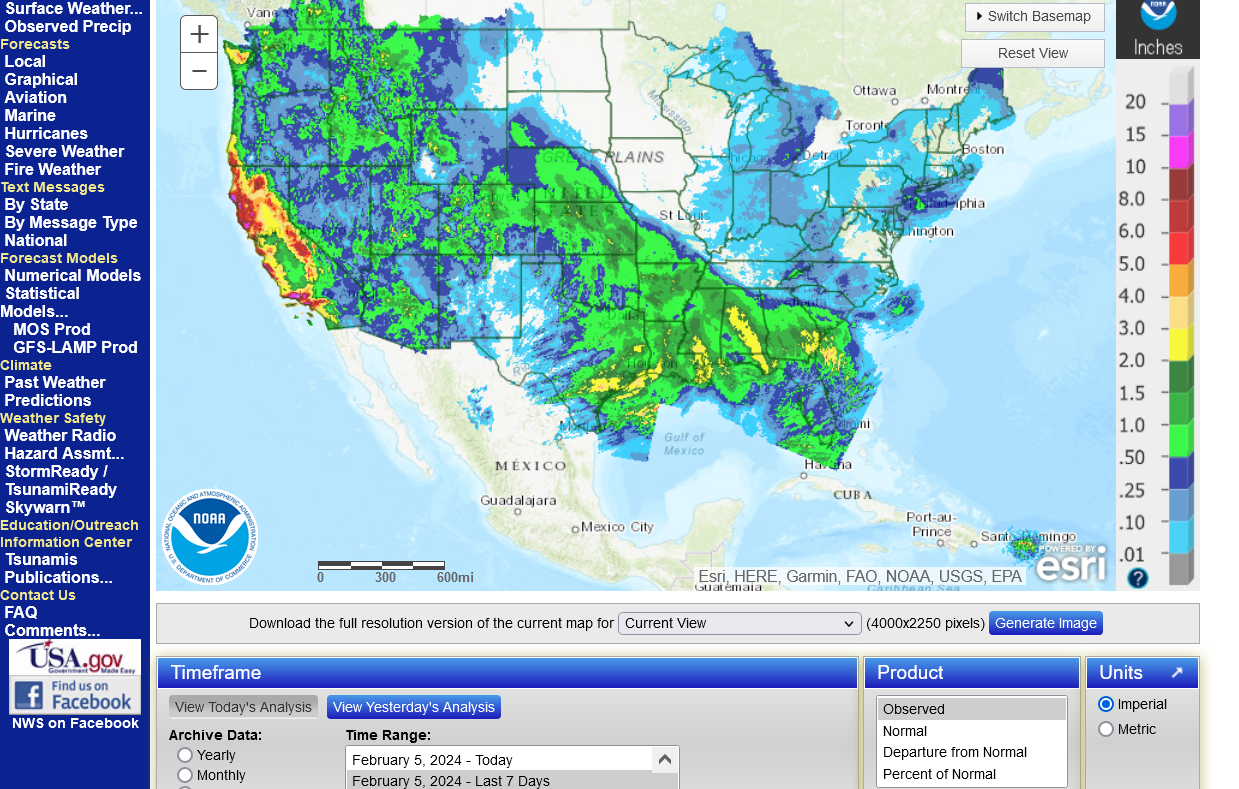
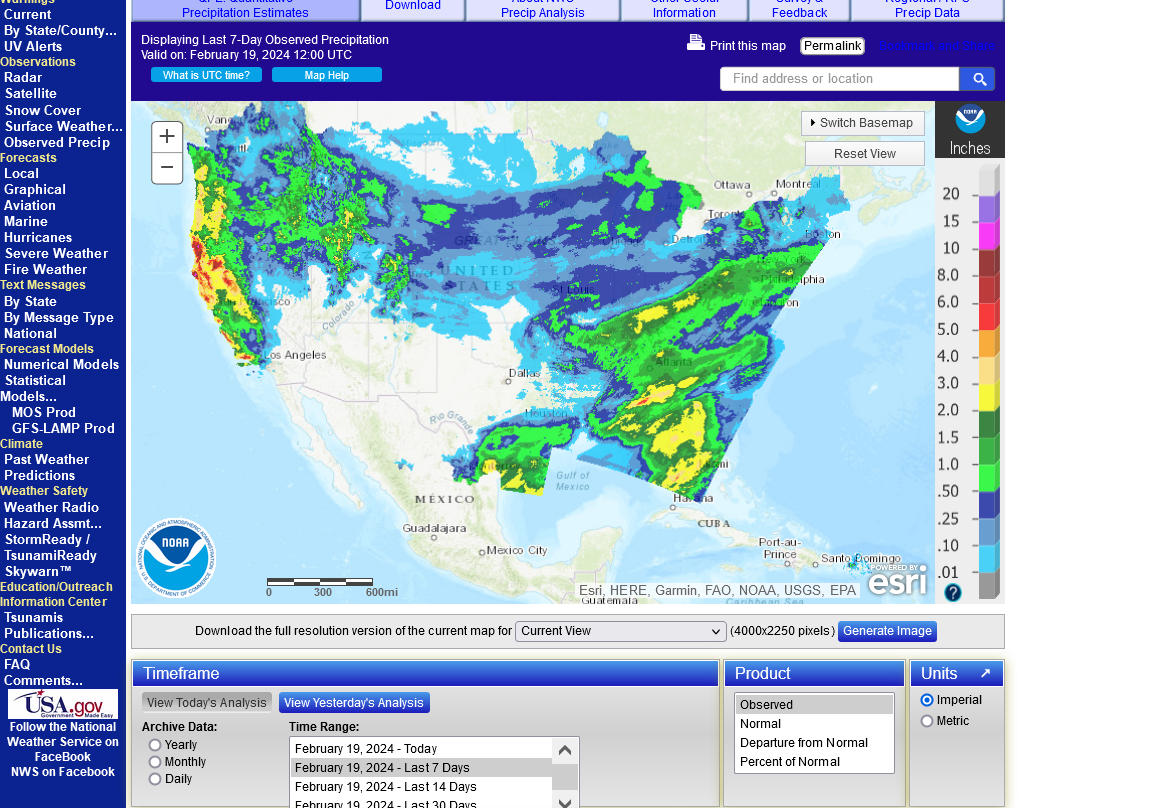
This was the total precip for the last WEEK!
https://water.weather.gov/precip/
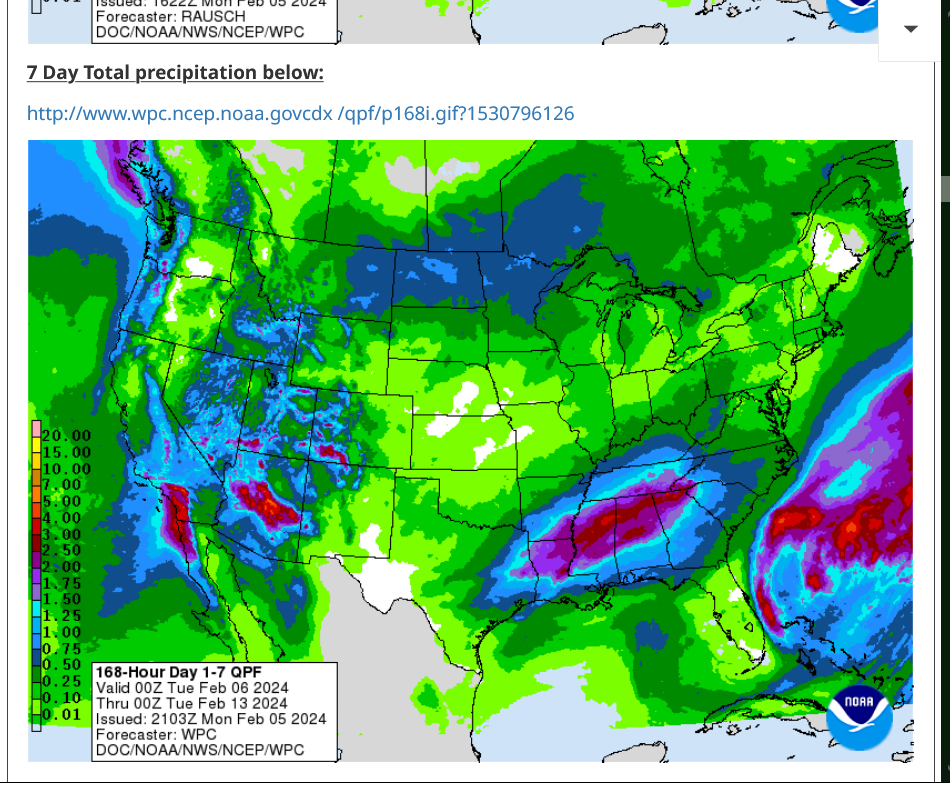
We hear that they're bracing for another storm to come: Here's the NWS forecast for precip the next WEEK!
I get that Los Angeles typically only gets 15 inches of rain in a year and San Diego only 12 inches but most of that rain comes from events just like this one at this time of year. This is a very NORMAL and an EXPECTED part of completely natural variation That at times becomes extreme.
Late last night on CNN, they had a meteorologist on that told us why this was from climate change.
The reason that he gave was "we can forecast the CLIMATE for the next 50 years with confidence because we know what the average conditions will be like but because of the chaos of the atmosphere, we can't forecast weather events like this accurately even a week in advance"
The guy has it completely backwards. These people will make their own twisted interpretations to generate sensationalism, alarmism and fear!!!
+++++++++++++++
https://cliffmass.blogspot.com/2016/03/the-golden-rule-of-climate-extremes.html
The GoldenRule
Considering the substantial confusion in the media about this critical issue, let me provide the GOLDENRULE OF CLIMATE EXTREMES. Here it is:
The more extreme a climate or weather record is, the greater the contribution of natural variability.
Or to put it a different way, the larger or more unusual an extreme, the higher proportion of the extreme is due to natural variability.
I'll take back my downplaying how extreme this event was. However, extreme weather events are a totally expected part of natural variation in weather that's been taking place for over a million years.
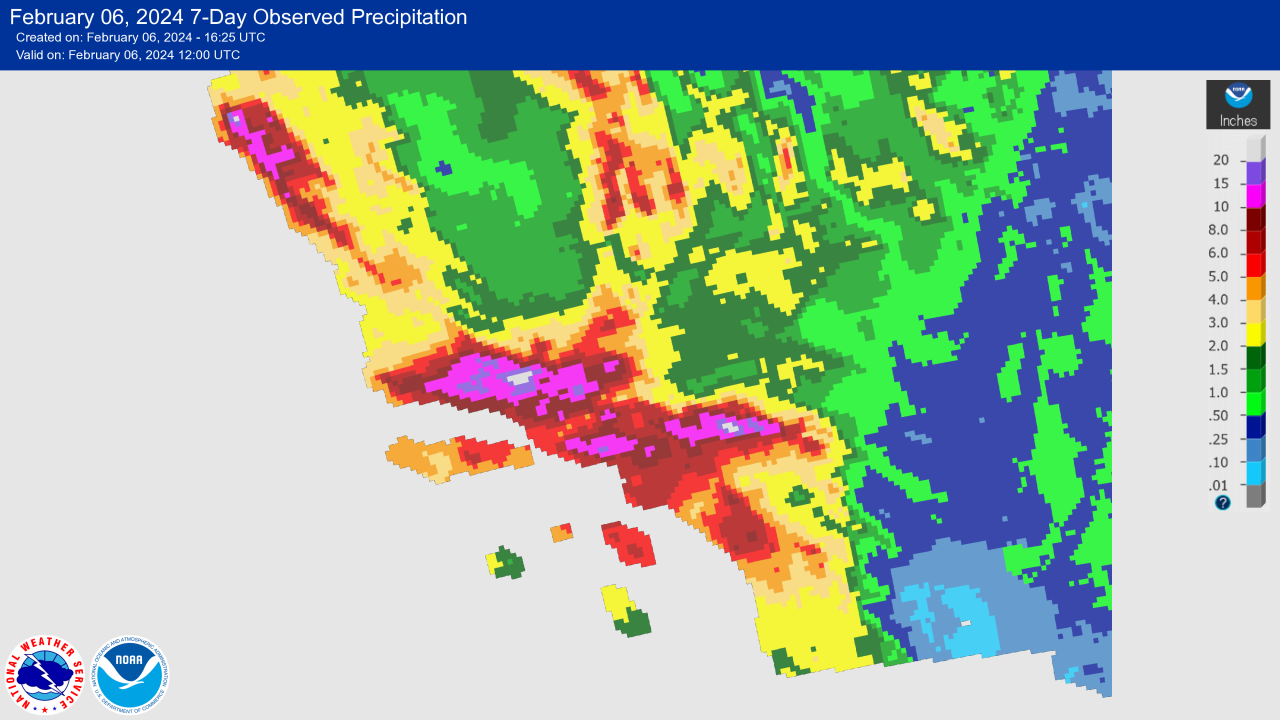
Keep in mind, too that these extremely high numbers below impacted a small region that was localized in the historic values.
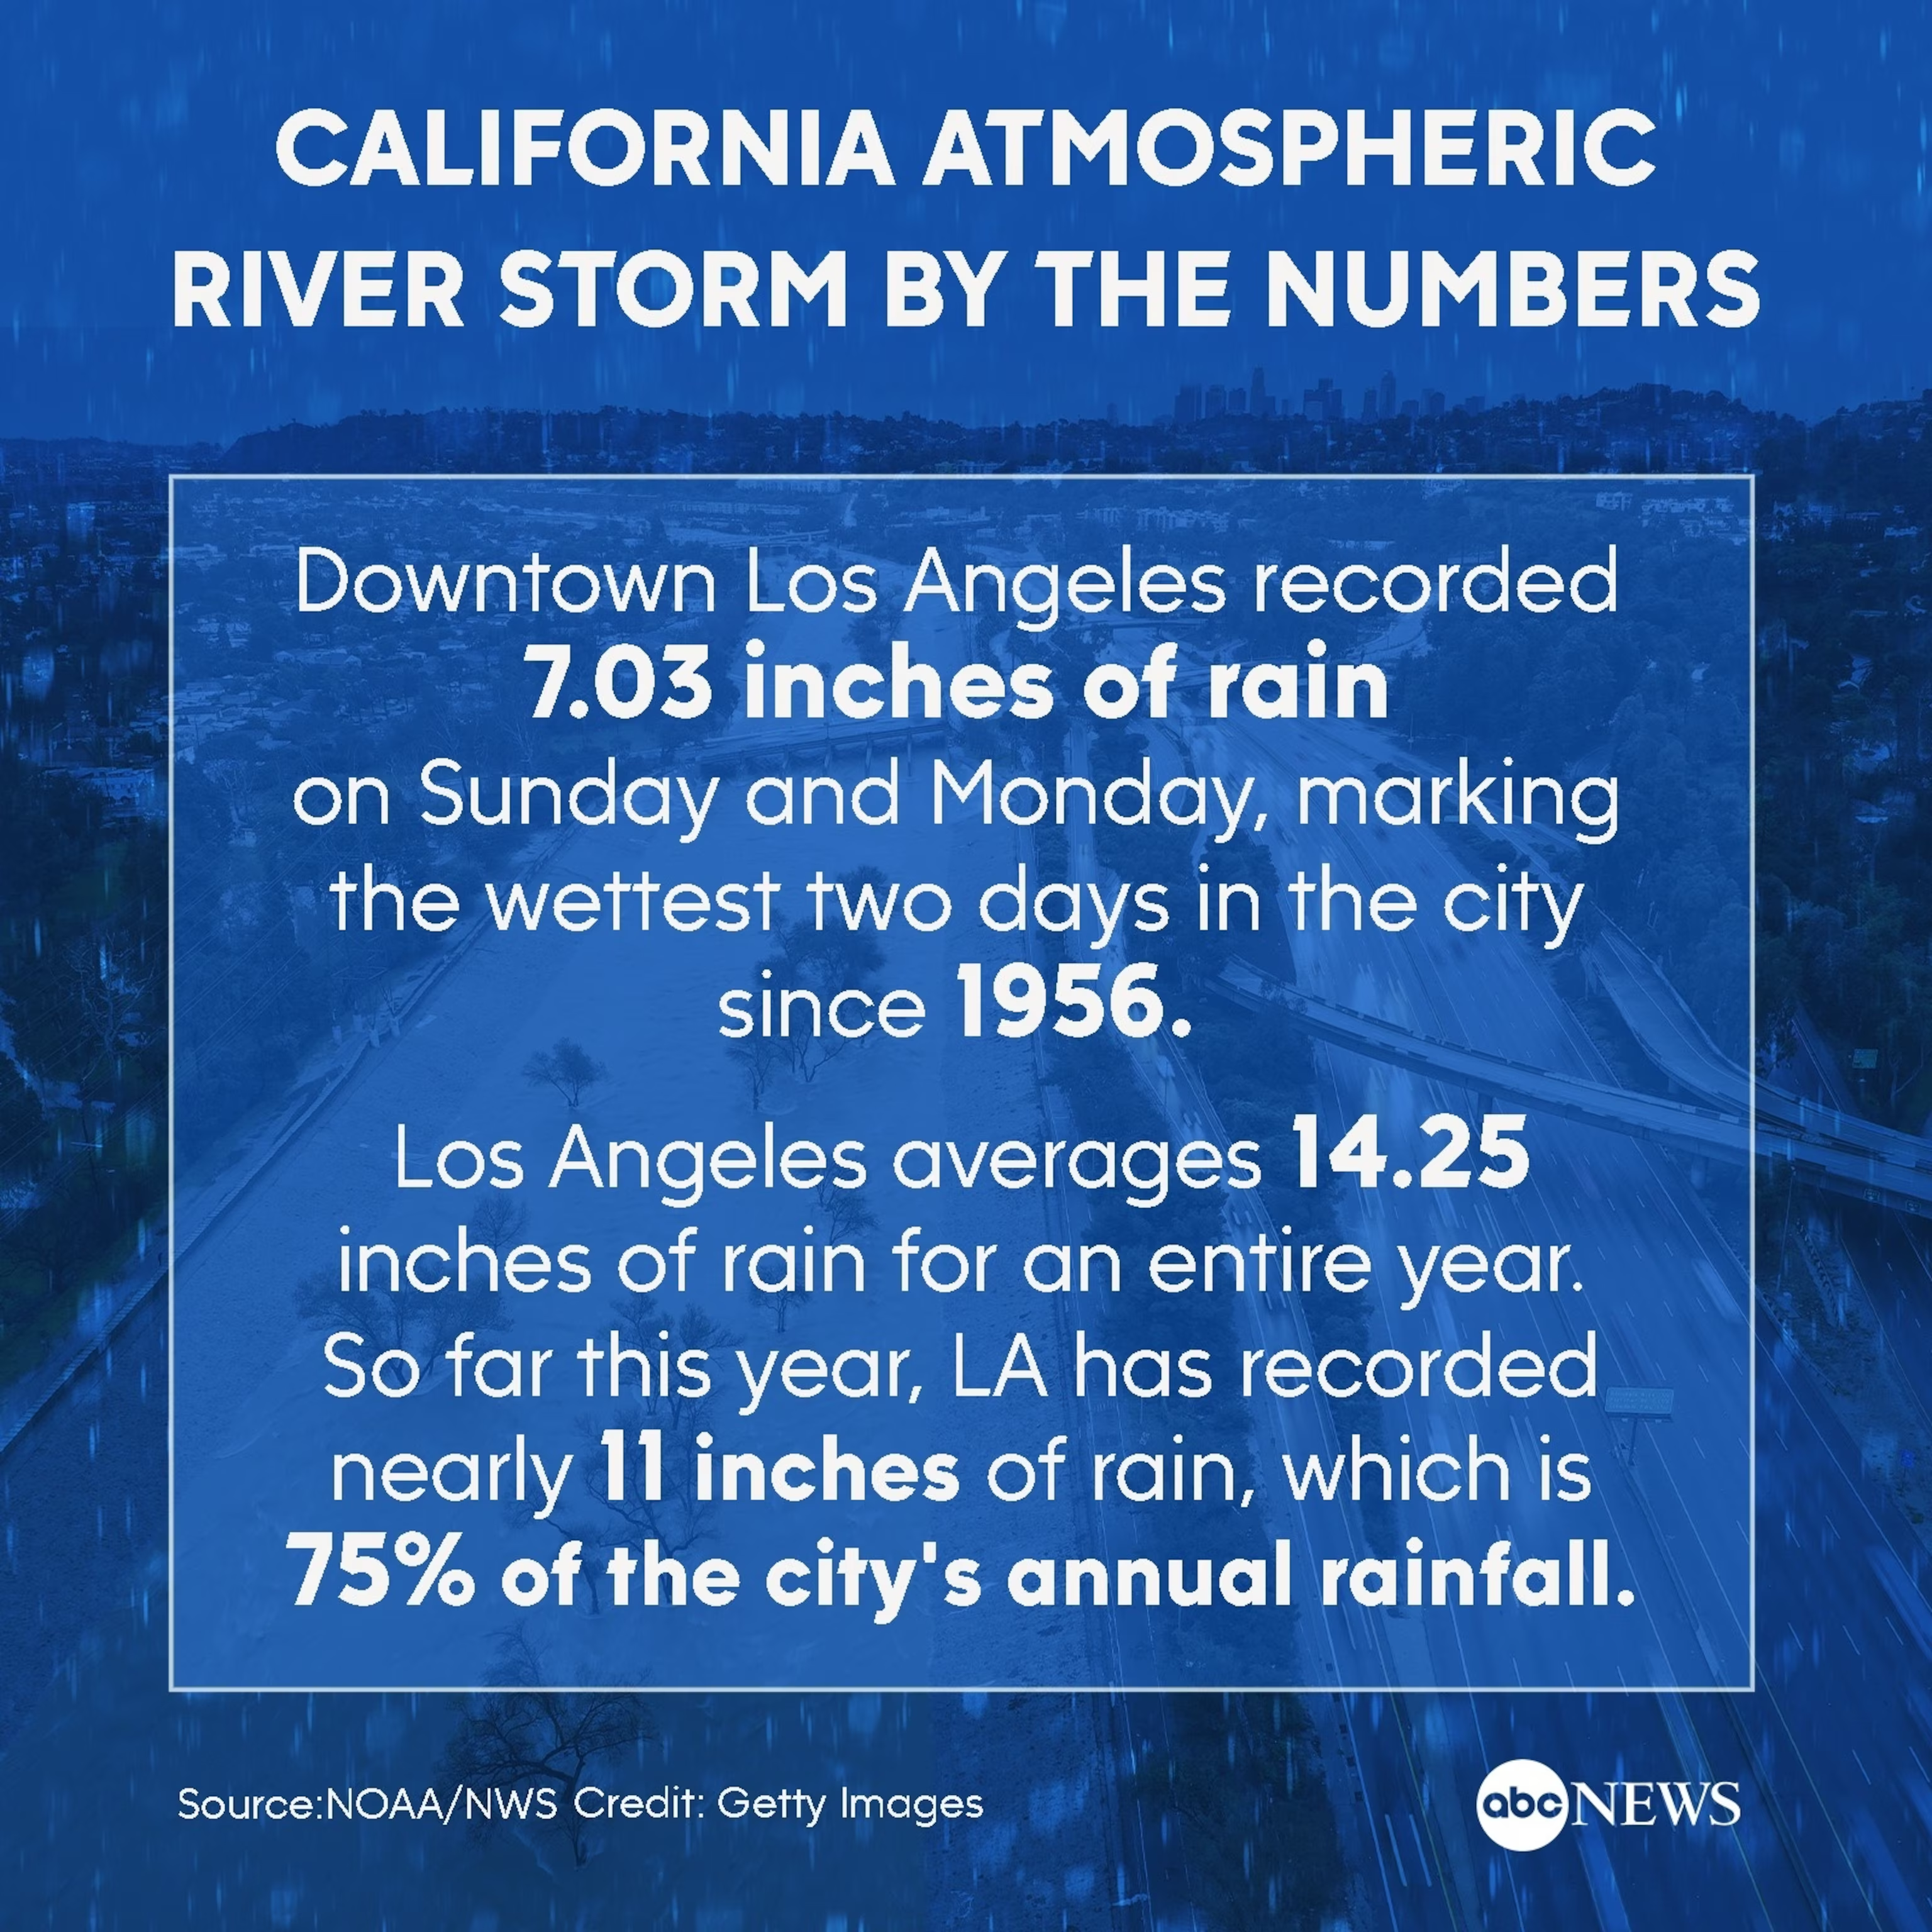
https://abcnews.go.com/US/californias-historic-storm-numbers/story?id=106989350
https://ktla.com/news/california/how-much-rain-has-fallen-in-california-so-far-heres-a-map/
According to the National Weather Service, some areas of Los Angeles have received over 11 inches of rain since the storm began, including Woodland Hills, Bel Air, and the Sepulveda Canyon area. Downtown L.A. has seen more than 7.5 inches, marking the third-highest two-day rainfall total in history.
Again, this applies and can't be repeated enough because the media and government keep repeating the opposite to mislead people:
https://cliffmass.blogspot.com/2016/03/the-golden-rule-of-climate-extremes.html
The GoldenRule
Considering the substantial confusion in the media about this critical issue, let me provide the GOLDENRULE OF CLIMATE EXTREMES. Here it is:
The more extreme a climate or weather record is, the greater the contribution of natural variability.
Or to put it a different way, the larger or more unusual an extreme, the higher proportion of the extreme is due to natural variability.
+++++++++++++
How much rain would have fallen in this area without an ocean/atmosphere that's 1 deg. C warmer from greenhouse gas physics?
All things being equal, the same systems in 1924 would likely have caused around 7 inches of rain instead of 7.5 inches.
It didn't cause the system but it added, potentially another 7% moisture because of the atmosphere being able to hold more water vapor with increasing temperature.
Outside of this pretty localized extreme precipitation event, the VAST MAJORITY of the West is embracing this as a huge, wonderful blessing of needed moisture during the wet/snow season.
We are around halfway thru the wet season for these locations and many places are showing fairly robust #s again for the 2nd year in a row.
Thanks almost exclusively to the NATURAL EL NINO and these wonderful, robust numbers would be 7% less if the atmosphere was 1 Deg. C cooler.
Isolated, extreme events are the only ones we hear/read about, while the rest of the planet benefits from the best weather/climate in the past 1,000 years(the last time it was this warm, during the Medieval Warm Period/Climate Optimum).
https://treering.voices.wooster.edu/the-medieval-optimum/
++++++++++++++++++++
Previous thread
Re: Poisoning the minds of young people
By metmike - Aug. 14, 2023, 9:34 p.m.
An authentic climate optimum for life on this planet.
https://www.marketforum.com/forum/topic/92155/
https://www.marketforum.com/forum/topic/90279/#90286
Was the Medieval WARM Period real?
See for yourself below.
For the Medieval Warm Period compared to today below:
Red balloons showed it was warmer.
Blue was colder than today(in that study)
Green was wetter/more precip
Yellow was drier
https://wattsupwiththat.com/2017/01/03/documenting-the-global-extent-of-the-medieval-warm-period/

If you go to the link below, you can hit those individual balloons and get each individual study:
+++++++++++++
Over 100 studies from the Medieval Warm Period, most of which show the planet was this warm or warmer 1,000 years ago. It was also this warm 2,000 years ago during the Roman Warm Period and also just over 3,000 years ago, during the Minoan Warm period. Medieval Warm Period Project: http://www.co2science.org/data/mwp/mwpp.php
 Where did the data from the bar graphs above come from so that we know that this is the authentic science vs the one that the MSM and dems describe with the fake climate crisis(where they can't show the data to prove)? List of Scientists Whose Work We Cite: http://www.co2science.org/data/mwp/scientists.php List of Research Institutions Associated With the Work We Cite http://www.co2science.org/data/mwp/institutions.php | ||
They've been wrong every year about the absurd, dire predictions and it's extremely annoying to authentic atmospheric scientists, like metmike to witness our field corrupted so badly.
https://www.cnn.com/2020/04/15/world/viking-mountain-pass-norway-scn/index.html
In recent years, climate change has caused mountain glaciers to melt away, revealing well-preserved markers from different periods in history beneath. This is what happened in Lendbreen, Norway.
They also found evidence of a permanent shelter on the pass. The pass was used for 700 years.“The start around AD 300 was a time when local settlement activity was picking up,” said James H. Barrett, study co-author and program partner, in a statement. “When the use of the pass intensified around AD 1000, during the Viking Age, it was a time of increased mobility, political centralisation and growing trade and urbanisation in Northern Europe.”
++++++++++++++
It's doesn't take a rocket scientist to understand that evidence of people living for hundreds of years underneath recently melting ice proves that it had to BE WARMER.
Actually, it doesn't take a mainstream climate scientist to apply common sense in order to understand this because mainstream climate science hijacked climate science and REWROTE climate history to wipe out the inconvenient Medieval Warm Period, so guys like Jeff Beradelli can state junk science, like "this is the warmest in 100,000 years.
Here's what they(the IPCC) actually did:
https://friendsofscience.org/assets/documents/IPCC%20TEMPERATURE%20FIDDLING.pdf

The IPCC writes the fake climate crisis bible with its regular reports and the followers of the climate crisis religion believe every bit of the junk science.
+++++++++++++++++
The Medieval Warm Period WAS global not the absurd defense/claim that it was just one region of northern Europe and somehow lasted for hundreds of years and didn't impact the rest of the planet.
Ask yourself how the Vikings were living in Greenland and growing some cold season crops for several hundred years in regions under ice right now if it wasn't warmer than this during the Medieval Warm Period?
For about 400 years centered around 1200 AD, Viking farmers lived in two colonies in Greenland, growing a few crops and raising herds of cattle and sheep. As many as 2500 Vikings may have inhabited the two colonies before they disappeared.
Conventional wisdom says that they died out as the climate got colder after the end of the Medieval Warm Period, capped by a huge eruption in Indonesia on Lombok Island in 1257 AD that is ranked the most powerful in the last 7000 years by geologists, according to a recent article in Smithsonian magazine. Large volcanic eruptions are known to cause significant cooling of climate over several years due to reflection of sunlight back to space from small sulfuric acid drops lofted high into the atmosphere during the eruption. You can read more about this fascinating history at
https://www.smithsonianmag.com/history/why-greenland-vikings-vanished-180962119/.
They discovered Greenland during a time known as the Medieval Warm Period, which lasted from about 900 to 1300. Sea ice decreased during those centuries, so sailing from Scandinavia to Greenland became less hazardous. Longer growing seasons made it feasible to graze cattle, sheep and goats in the meadows along sheltered fjords on Greenland’s southwest coast.
++++++++++++++++++
https://www.sciencedaily.com/releases/2018/06/180604151150.htm
Published June 4 in the Proceedings of the National Academy of Sciences, the study included contributions from collaborators at Dartmouth College.
People might be surprised to see how today's frigid Greenland looked during the last two interglacial periods. Today, northwest Greenland hovers in the 30s and low 40s Fahrenheit and weathers snowstorms in summer. But average summer temperatures in the early Holocene (8,000 to 11,000 years ago) and Last Interglacial (116,000 to 130,000 years ago) climbed well into the 50s.
During the Last Interglacial, global sea levels increased by 15 to 30 feet, largely due to thinning of Greenland and Antarctica's ice sheets. But now Northwestern's team believes northern Greenland's ice sheet experienced stronger warming than previously thought, which could mean that Greenland is more responsible for that sea-level rise.
+++++++++++++++++++++++++
They use climate models that have equations that give CO2 42% more forcing than it's really causing.
RADIATIVE FORCING BY CO2 OBSERVED AT TOP OF
ATMOSPHERE FROM 2002-2019
https://arxiv.org/pdf/1911.10605.pdf
"The IPCC Fifth Assessment Report predicted 0.508±0.102 Wm−2RF resulting from this CO2 increase, 42% more forcing than actually observed. The lack of quantitative long-term global OLR studies may be permitting inaccu-racies to persist in general circulation model forecasts of the effects of rising CO2 or other greenhouse gasses."
Claiming that these heat waves that suddenly emerged explain all the missing heat for 30 year is just confirmation bias/wanting to be right because the missing heat has already been found..........the absolute proof above shows that the wrong mathematical equations have been exaggerating the amount of heat from CO2 by 42%.
IT WAS MEASURED!
The complete lack of acknowledging this profound measurement, then using it to adjust the models to reality(which is what the scientific method demands) shows that the models are truly political tools.
https://www.marketforum.com/forum/topic/57636/
+++++++++++++++++
Sadly, this is not much different than the political divide in the US and belief that Trump won the election by the majority of Rs. People that are convinced in something that isn't so who interpret all information so that it tells them what they want to believe. The ANTI scientific method.
Instead of recognizing the true amount of contribution from climate change based on authentic science, they cherry pick every extreme and use it to amplify the real amount from climate change.
https://cliffmass.blogspot.com/2016/03/the-golden-rule-of-climate-extremes.html
The GoldenRule
Considering the substantial confusion in the media about this critical issue, let me provide the GOLDENRULE OF CLIMATE EXTREMES. Here it is:
The more extreme a climate or weather record is, the greater the contribution of natural variability.
Or to put it a different way, the larger or more unusual an extreme, the higher proportion of the extreme is due to natural variability.
++++++++++++++++++++
https://www.marketforum.com/forum/topic/97607/#97939
https://www.spectator.com.au/2023/02/climate-change-short-on-proof-drowning-in-nonsense/
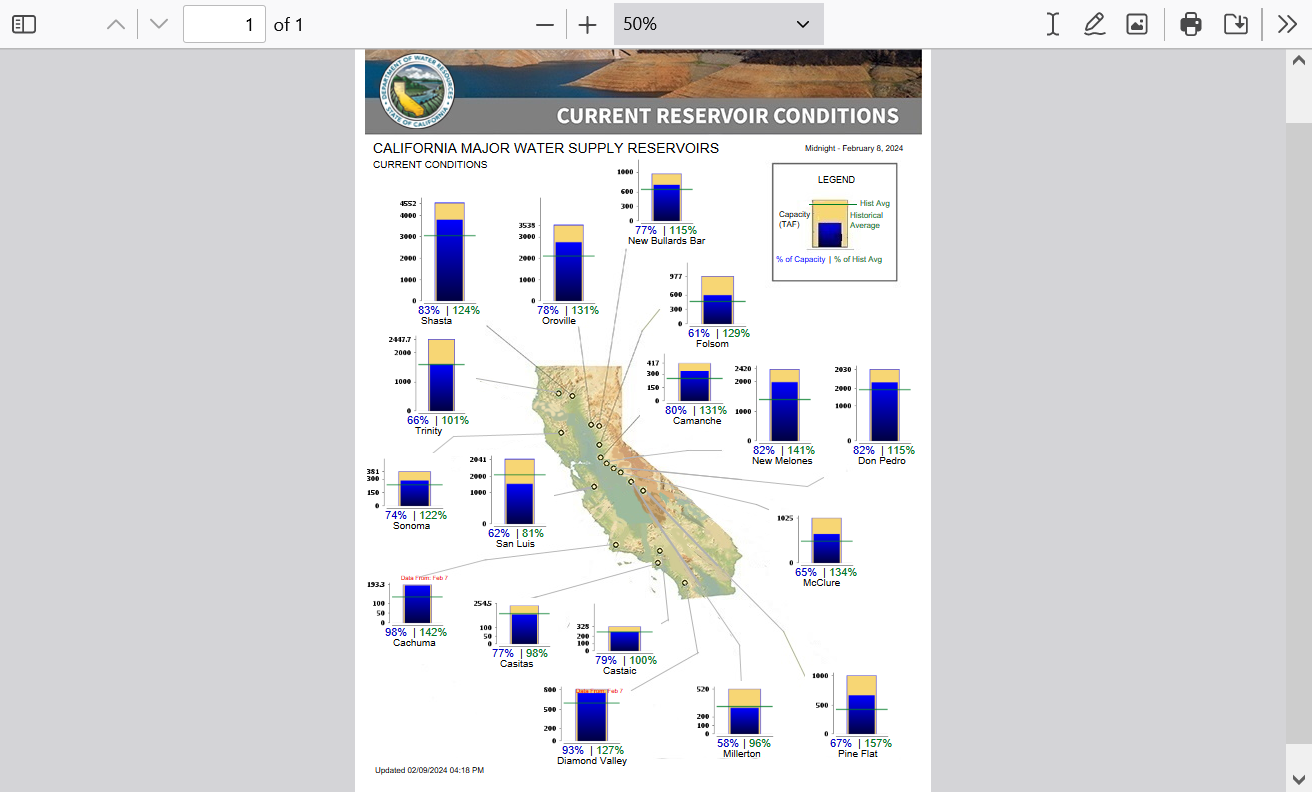
Outside of the fairly localized extreme event in the high population, Los Angeles area almost a week ago, these atmospheric river events from the Natural El Nino have blessed California with wonderful beneficial rains.
Most places will gladly take a bit more of the exact same events(absent the tiny % of area with the extreme rains) with only a very tiny reservoir close to capacity.
https://cdec.water.ca.gov/resapp/RescondMain
+++++++++++++
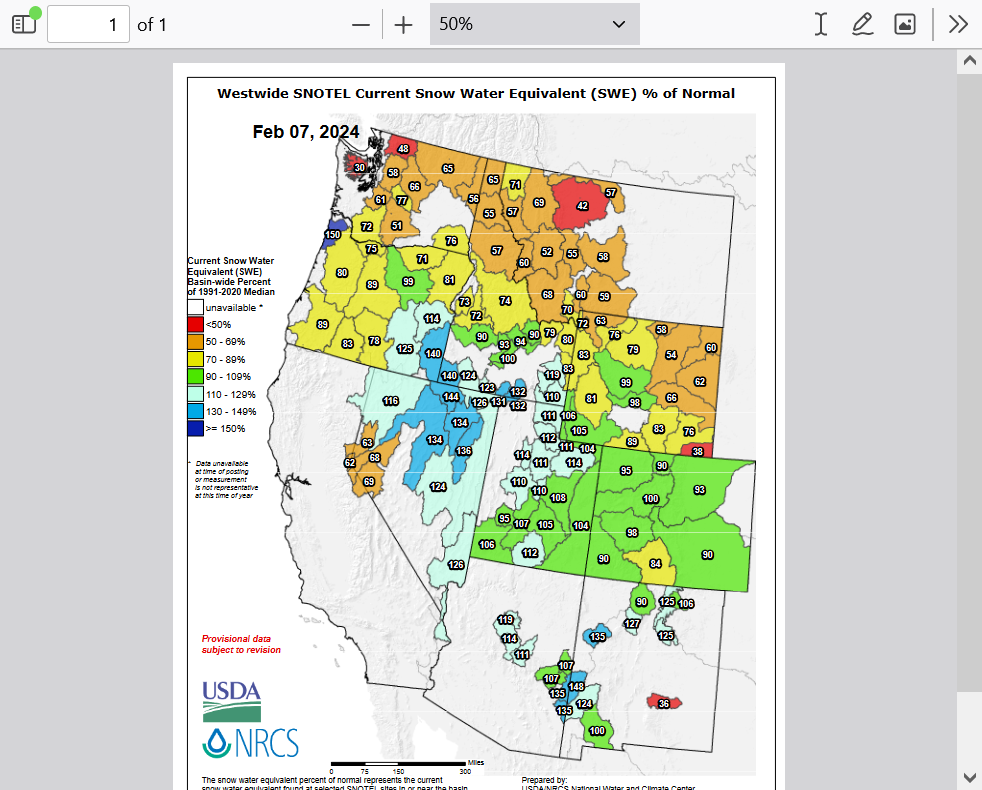
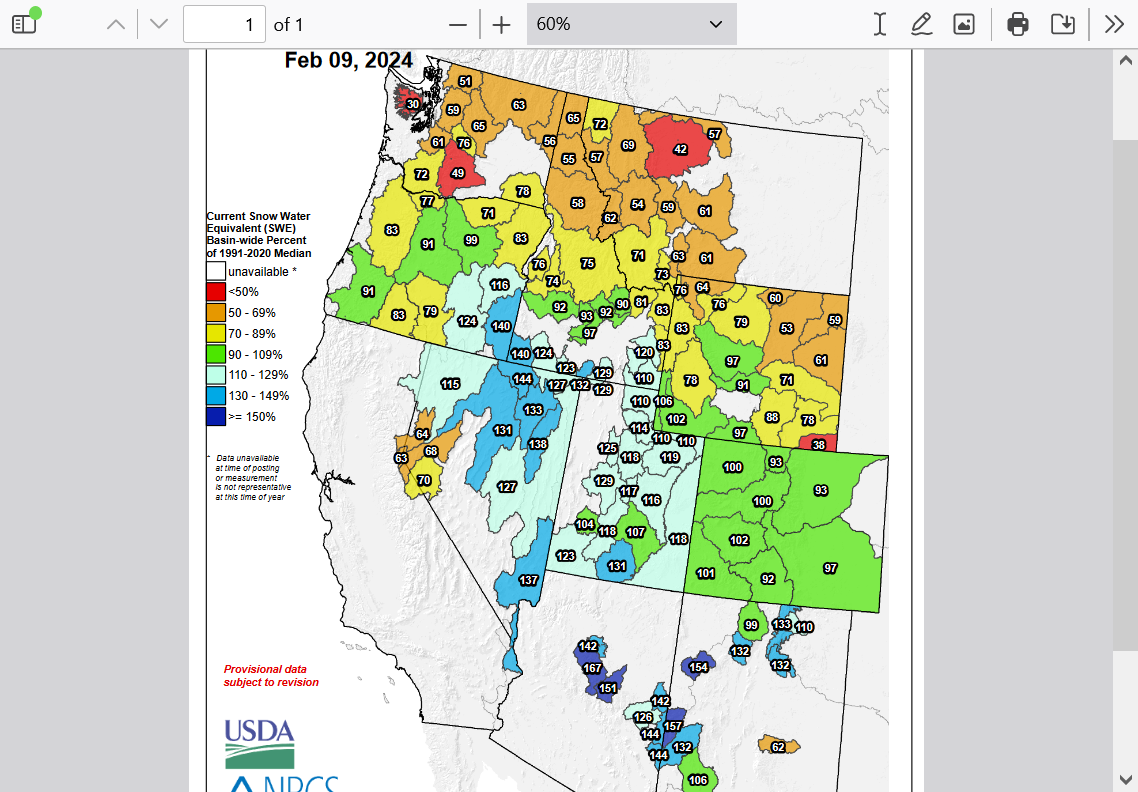
Snowpack in the southwest half of the area below is also in wonderful shape thanks to this greatly beneficial weather.
These areas use the melting snow later in the year for their water needs!
https://www.wcc.nrcs.usda.gov/ftpref/data/water/wcs/gis/maps/west_swepctnormal_update.pdf
https://www.axios.com/2024/02/06/california-flooding-rainfall-climate-change
The rainfall totals are astonishing, in some cases qualifying as a 1-in-1,000-year event, which has just a 0.1% chance of occurring in any particular year.
+++++++++
Up to their usual eye rolling exaggerating and misleading. This was pretty localized and its completely natural to have many hundreds of events like this around the world every single year. This one happened in a very highly populated area, so its getting extra attention. What would be the most unexpected would be the absence of them. It's a part of natural variation. Since this was the 3rd highest rainfall total for 2 days in Downtown L.A., one of the hardest hit with records going back just under 100 years, that would equate to a 1 in 33 year event(3 times in 99 years).
In 1,000 years an event like this would likely happen around 30 times. So they're only off by a factor of 30 for their intentionally distorted/misleading time scale!!
https://ktla.com/news/california/how-much-rain-has-fallen-in-california-so-far-heres-a-map/
According to the National Weather Service, some areas of Los Angeles have received over 11 inches of rain since the storm began, including Woodland Hills, Bel Air, and the Sepulveda Canyon area. Downtown L.A. has seen more than 7.5 inches, marking the third-highest two-day rainfall total in history.
+++++++++++++++
The previous 2 times this occurred in the last 100 years were BEFORE climate change!
+++++++++++++++++++++++++
They downplay the 99.99% reason for this actual event..........the NATURAL El Nino and natural variation.
I'll repeat this again because this authentic science needs repetition to battle junk science.
https://cliffmass.blogspot.com/2016/03/the-golden-rule-of-climate-extremes.html
The GoldenRule
Considering the substantial confusion in the media about this critical issue, let me provide the GOLDENRULE OF CLIMATE EXTREMES. Here it is:
The more extreme a climate or weather record is, the greater the contribution of natural variability.
Or to put it a different way, the larger or more unusual an extreme, the higher proportion of the extreme is due to natural variability.
++++++++++++++++
Climate change did have an impact that we can calculate pretty easily if we kept all things equal and superimposed 1 deg. C of warming on the ocean/atmosphere. We know accurately from the physics/meteorology that a +1 deg. C warmer atmosphere can hold 7% more moisture. There are numerous dynamics at play but we're simplifying it and not speculating by just keeping them the same.
Using that indisputable law, we can say that 100 years ago, this same event, with an atmosphere at 1 Deg. C cooler would likely have dumped 7 inches of rain instead of 7.5 inches. Despite that, it rained MORE THAN THIS on 2 occasions in the past 100 years before global warming kicked in.
So global warming absolutely increases the top amounts in extreme rain events by around 7%. It also increases amounts in the VAST, VAST weaker events TO MAKE THEM MORE EFFICIENT at yielding beneficial rains!
Fact is, outside of these fairly localized extreme rains in the densely populated Los Angeles area, 98% of the West by area has been celebrating the beneficial rains and snows that have been coming from the atmospheric rivers this Winter!
But we only read/heard about events that represented 2% of the area. That's what the climate crisis is all about.
Cherry picking every weather extreme and pretending like its 30 times worse than it was on an historical time frame and could only have happened from climate change(which they have as the main reason causing it) and is increasing at a catastrophic rate. Even with 2 events with MORE rain in the last 100 years BEFORE global warming.
They mention part of the 99.99% reason for the event as an after thought and actually without 1 mention of natural variation.
NOT ONE!
This is not authentic science. It's a pathetic manipulation of science to use as politics.
How many people reading the article know what I do and can apply that to throw out the massive chaff and keep a few grains of wheat?
That's the problem. They absolutely know that nobody knows. There is no science authority that holds the media accountable when they print articles like this. In fact, much of the climate science gatekeepers have been corrupted by politics and personal enrichment.
So they can publish junk science with impunity. Their perspective on this event in the article above was astronomically distorted/biased to the point that its actually stealing away peoples intelligence when they read it.
Helping to enforce the fake climate crisis brainwash on society. It's the world we live in. Which in reality is featuring the best weather/climate for most life on this greening planet in the last 1,000 years........the last time it was this warm.
Here's some HONEST perspective on historical rainfall extremes/records using all the comprehensive evidence for such events. The data DOES NOT LIE. Its the media and scientists doing that.
Another 1 in 1,000 year rain
Started by metmike - July 11, 2023, 12:10 a.m.
https://www.marketforum.com/forum/topic/97060/
https://www.marketforum.com/forum/topic/97060/#97062
https://www.marketforum.com/forum/topic/97060/#97064
So what % of people that read alarmist articles like this at the top, also check comprehensive historical data like this in the thread above?
1 in a million?
That's why its been so easy to hijack climate science and even rewrite climate history. No speculation. They did that with 100% backed evidence.
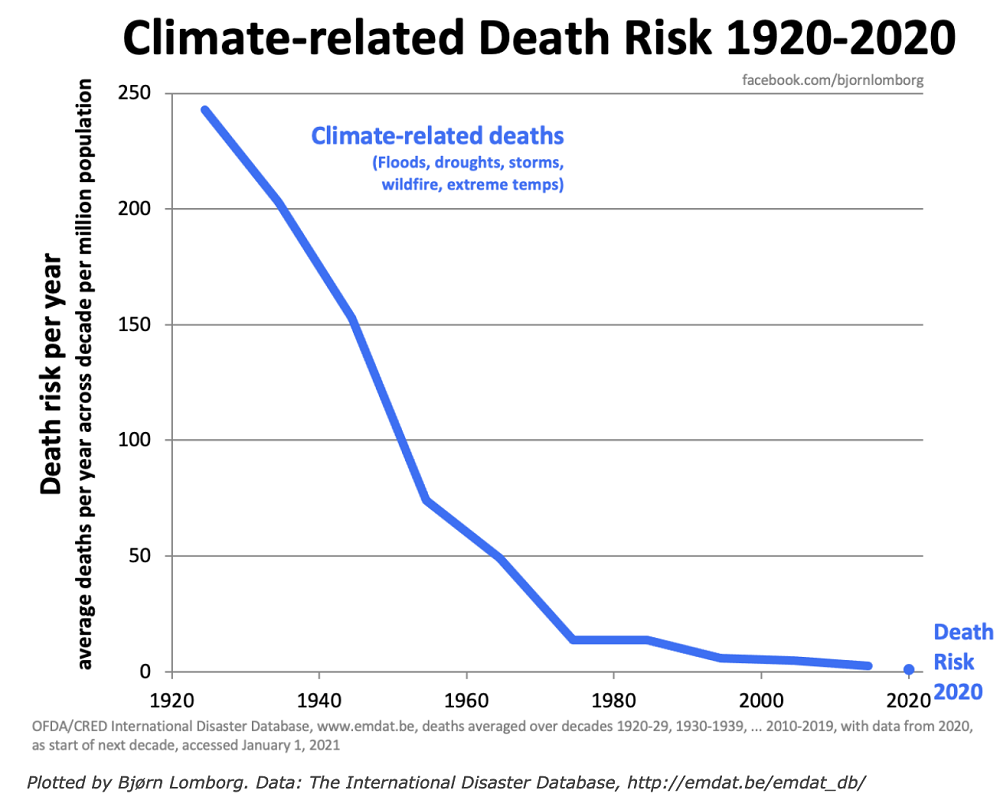
4th time this Summer for a 1 in 1,000year rain event........but the same thing happened in 2018, 1932 and 1922 at this location, so it was actually a 1 in 25 year event. What a 7% increase in H2O means. Golden Rule of Climate extremes. Weather/Climate related deaths have been reduced by 95% over the last 100 years. Why they do this. August 2022
https://www.marketforum.com/forum/topic/88256/
Latest 1 in 1,000year(rain) event Sept/Oct 2022
More, almost all BENEFICIAL, very typical El Nino caused precip along the West Coast being blown up into a very bad thing by the sensationalizing media........again.
https://water.weather.gov/precip/
Total 1 week precip
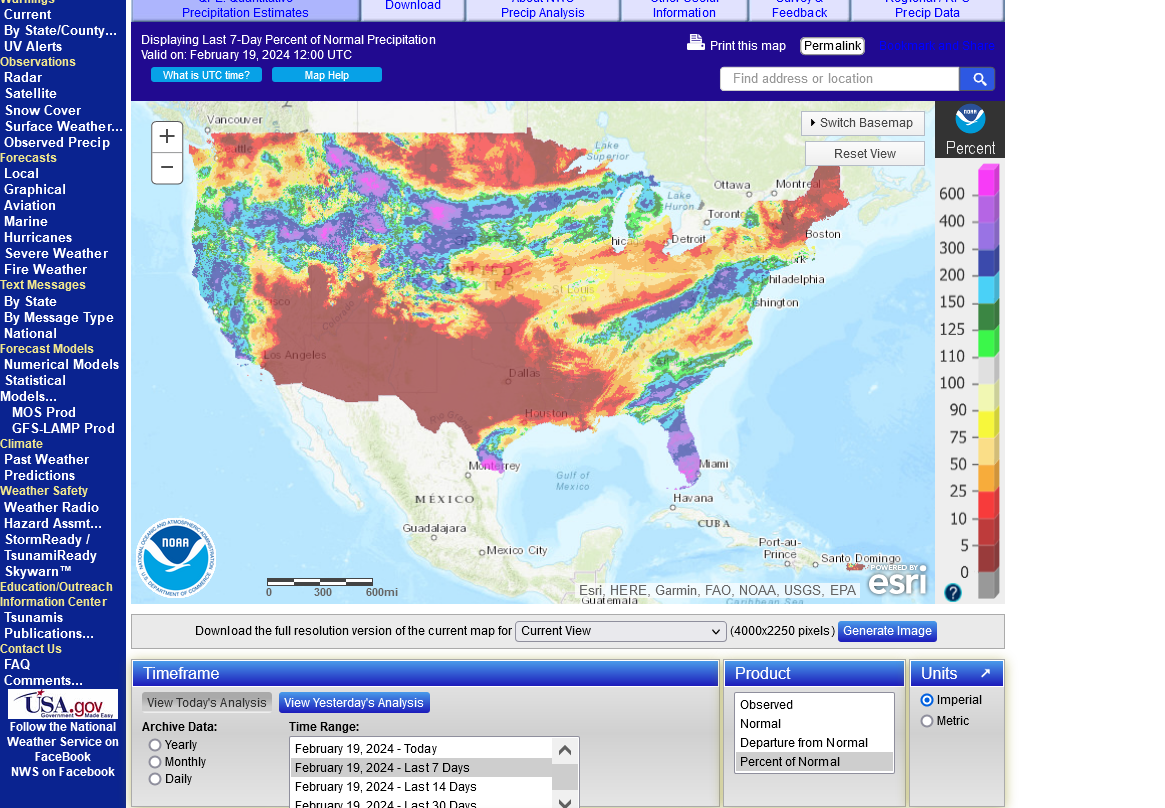
% of average for the last week
+++++++++++++++++++++++++++++
The latest 7 day precip forecasts are below.
Day 1 below:
http://www.wpc.ncep.noaa.gov/qpf/fill_94qwbg.gif?1526306199054

Day 2 below:
http://www.wpc.ncep.noaa.gov/qpf/fill_98qwbg.gif?1528293750112

Day 3 below:
http://www.wpc.ncep.noaa.gov/qpf/fill_99qwbg.gif?1528293842764

Days 4-5 below:
http://www.wpc.ncep.noaa.gov/qpf/95ep48iwbg_fill.gif?1526306162

Days 6-7 below:
http://www.wpc.ncep.noaa.gov/qpf/97ep48iwbg_fill.gif?1526306162

7 Day Total precipitation below:
http://www.wpc.ncep.noaa.govcdx /qpf/p168i.gif?1530796126

Excessive rain threat.
https://www.wpc.ncep.noaa.gov/qpf/excess_rain.shtml
Current Day 1 Forecast
Day 1 Threat Area in Text Format
Current Day 2 Forecast |
Day 3 outlook

Another storm brought flooding to Massachusetts and New Hampshire on Tuesday. In the Northeast, the problem of climate change is especially acute because of forecasted sea level rise here, said Hannah Baranes, a coastal scientist with the Gulf of Maine Research Institute’s Climate Center in Portland, Maine. The state has already experienced 7.5 inches (19 centimeters) of rise since 1910 and is projected to have to manage 4 feet (1.2 meters) of sea level rise by 2100, she said.
++++++++++++
Let's review their math on sea level rise since 1910.
1910 to 2024 =114 years = 7 inches(observed/measured) = 1 inch every 16 years
They want us to believe this forecast:
1910 to 2100 =190 years =48 inches
2024 to 2100 =76 years = 41 inches =1 inch every 1.9 years.
They are claiming that the rate of sea level increase will accelerate by over 8 times faster than what its been measured to increase the last century.
++++++++++++
Statements like that are complete nonsense and only come from political climate activists.....that dominate dishonest media stories but NOT honest science stories.
Sure, I'll consider the distinct possibility of the rate of sea level increase doubling or worst case scenario even tripling the next 7 decades. But 8+ times the rate of the last century?
That's clear alarmist to scare and mislead people with junk science, which sadly........dominates what most people think they know about this topic because the gate keeper sources feed them junk science.
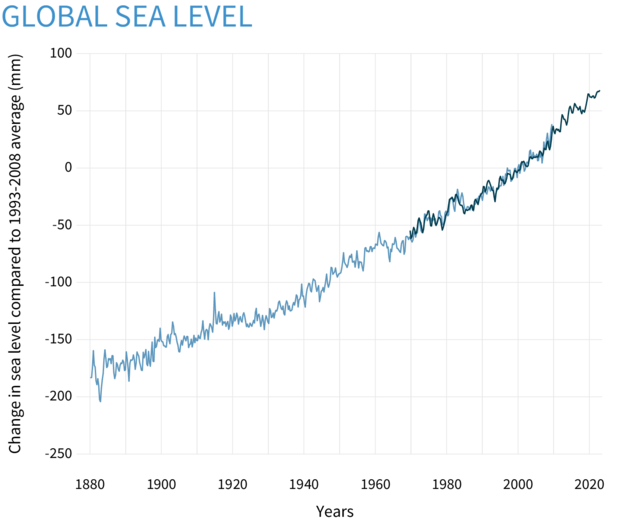
This is reasonable, authentic science below:
https://www.climate.gov/news-features/understanding-climate/climate-change-global-sea-level
The global mean water level in the ocean rose by 0.14 inches (3.6 millimeters) per year from 2006–2015, which was 2.5 times the average rate of 0.06 inches (1.4 millimeters) per year throughout most of the twentieth century. By the end of the century, global mean sea level is likely to rise at least one foot (0.3 meters) above 2000 levels, even if greenhouse gas emissions follow a relatively low pathway in coming decades.
++++++++++++
For sure the slope of the line below(sea level increase during the past 140 years) is slightly steeper than it was a century ago and is accelerating upwards.
But its not likely to be 8 times this rate in our life time.
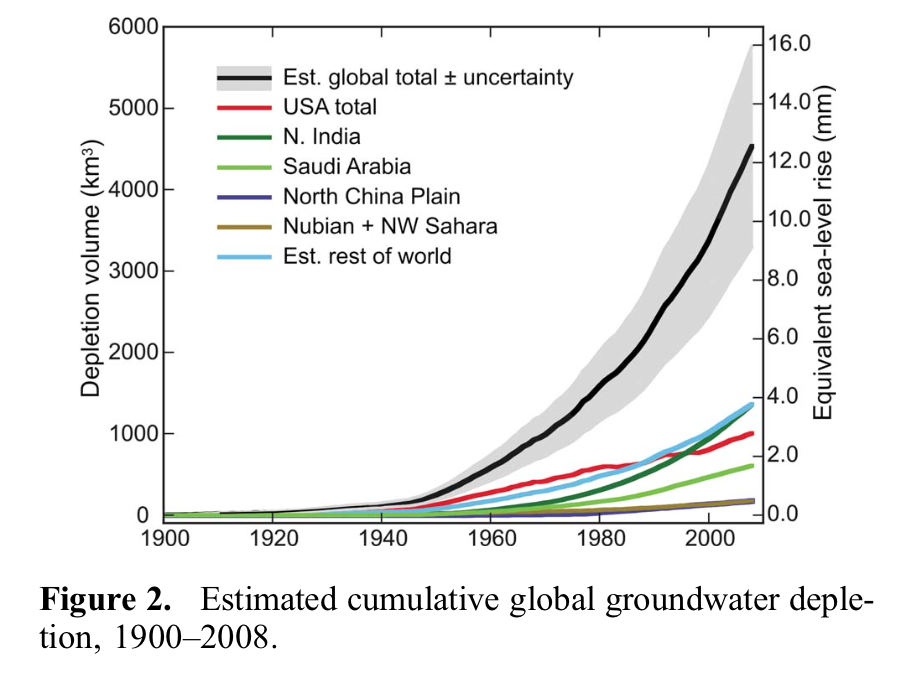
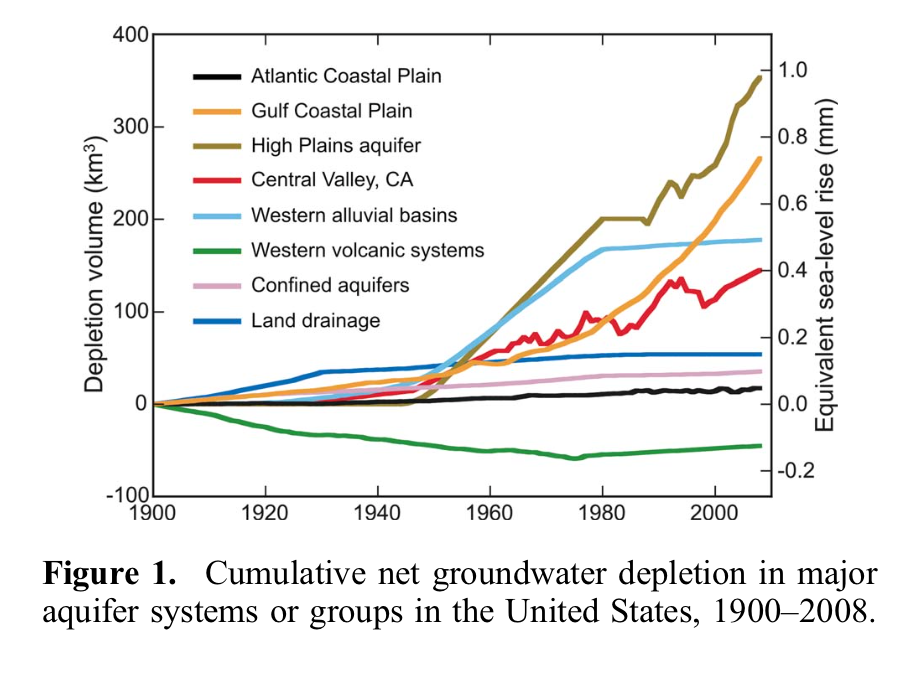
 And we should remember that part of the acceleration is from runoff of trillions of gallons of underground aquifers that humans have been pulling out of the ground, that get used and added to river systems that drain into the oceans.
https://revealnews.org/article/overpumping-of-groundwater-is-contributing-to-global-sea-level-rise/
They continue to focus all the attention and want all the resources to go towards fighting a non serious problem with 10 times more benefits than bad things as the so called "carbon pollution" greens up the planet and creates a climate optimum for most life..........for crony capitalism, corrupted science, political agenda and media ratings.
While wasting all that money which could be spent on the REAL problems:
The real environmental crisis's/insects dying-dead zones-aquifers drying up-plastics in the ocean-landfills/trash-over consumption of natural resources-REAL pollution in the air/soil/water-WIND TURBINES (metmike is a PRACTICING environmentalist): April 2019
https://www.ktvu.com/news/extreme-weather-flooding-us-where-to-live-research
https://www.spectator.com.au/2023/02/climate-change-short-on-proof-drowning-in-nonsense/
Fact is, fossil fuels are the biggest reason for life expediencies to have exploded higher by double digits in the last 150 years.
Another secret about fossil fuels: Haber Bosch process-fertilizers feeding the planet using natural gas-doubling food production/crop yields. September 2019
https://www.marketforum.com/forum/topic/39215/
Life without petroleum based products: 6,000 products made with petroleum. Killing Coal. Fossil fuels and fertilizer. Biden praises high gasoline prices.
https://www.marketforum.com/forum/topic/84689/ 2022
Death by Greening: CO2 is greening the planet and greatly boosting crop yields. Photosynthesis has not been repealed.
https://www.marketforum.com/forum/topic/69258/
Optimal CO2 for life more than double current level: See the proof with thousands of studies. Showing Scientific American.....and mainstream science sold to us........ to be wrong about plants and the affects from Climate Change. December 2020
https://www.marketforum.com/forum/topic/62784/
+Sea Level Rise: What the fake climate crisis is really about. Exposing the bogus Climate Accord. Educating with real science. December 2020 https://www.marketforum.com/forum/topic/62460/