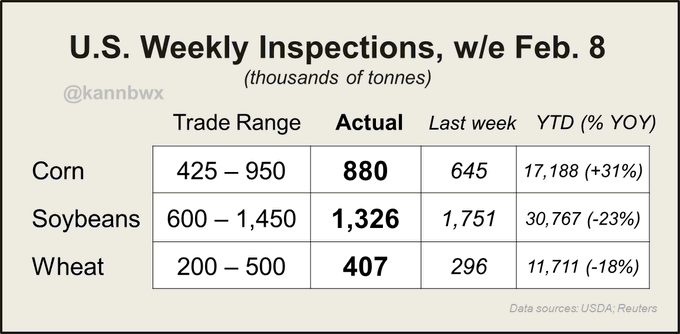
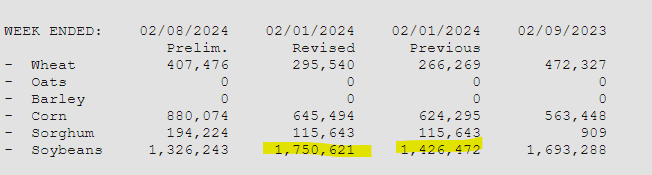
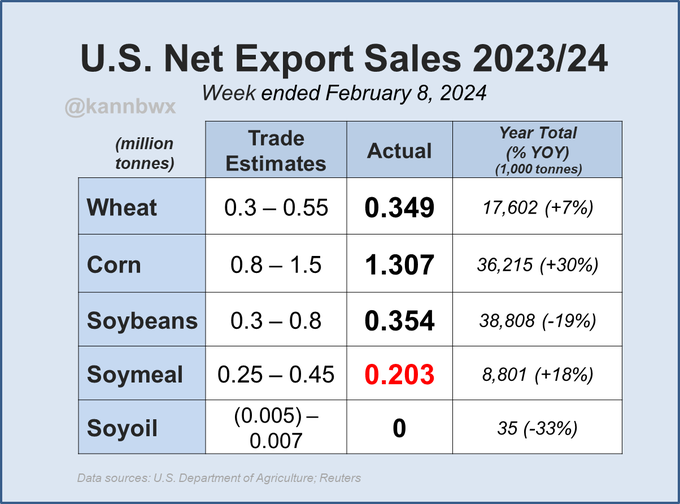
Last week's U.S. export inspections for #corn, #soybeans & #wheat all come in near the higher end of expectations. 61% of the weekly soybean volume went to #China as did one cargo of wheat from the Gulf. Big revision to prior week's soybean number.
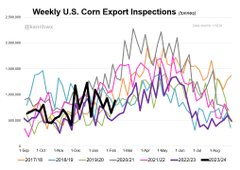
The past two weeks have been good (dare I say excellent?) for soybean inspections. Corn... yeah, getting to that time where we really need to see bigger volumes. Soybeans perhaps stealing the spotlight. See the revisions to last week - roughly 5 more bean cargoes added.
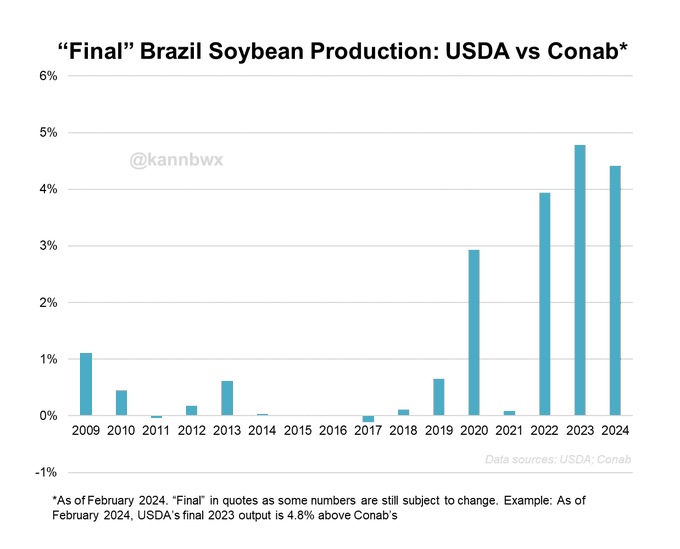
Here's how USDA's "final" Brazil soy estimates vary from Conab's. USDA has been keeping higher production numbers than Conab for the last few years. Would need to dig into the balance sheets to see exactly where the differences are, but again. Focus on each agency's year-on-year.
++++++++++++++
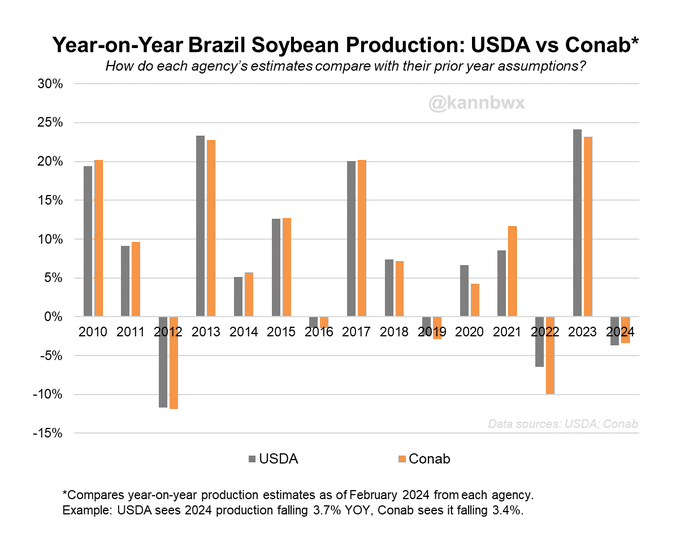
USDA has 2023/24 output for #Brazil's #soybeans some 6.6 million tonnes (243 mln bushels) above Conab. Which number to believe? Who will be right? Depends on what you're using for prior years. Look at it this way instead: year-on-year, the 2023/24 assumptions are very similar.
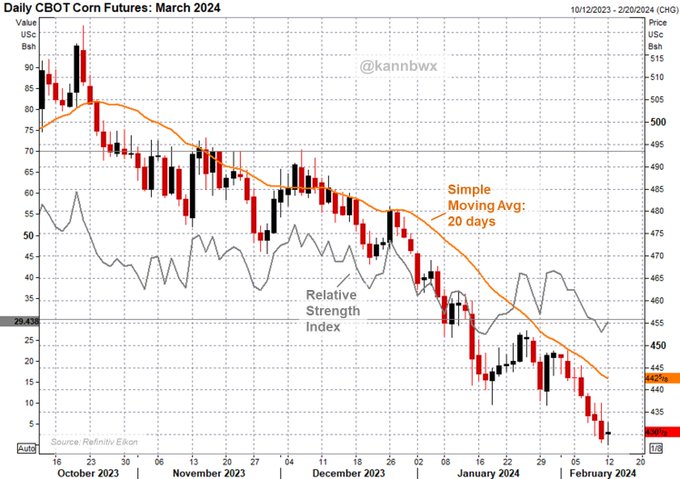
Feb. 12: CBOT March #corn futures hit new contract lows again on Monday but notched their first daily gains of the month, settling up fractionally at $4.30-1/2 per bushel. Relative strength index has suggested oversold conditions since mid-last week.
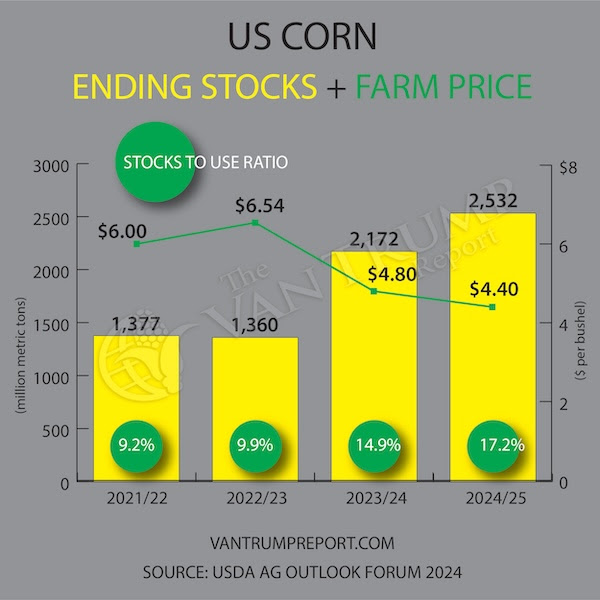
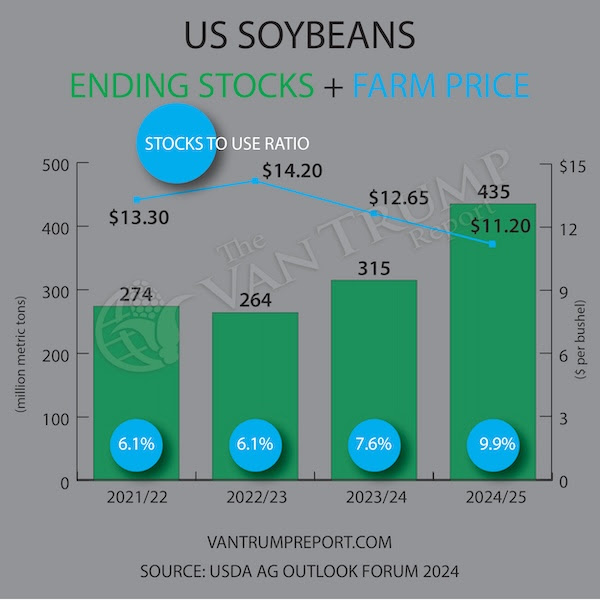
IF these estimates are right or even close, where does that put #corn & #soybeans prices come this fall? The US needs a lot more demand, period.
Quote

Dave Brock
@drbrock37
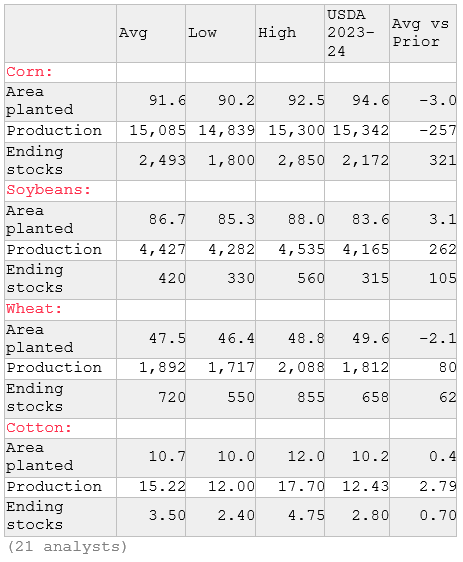
Bloomberg analyst estimates FWIW we just did our 24 balance sheets and are pretty close to these averages. main takeaway was corn needs a miracle
Operations at the port of Antwerp, one of Europe’s biggest container ports, were seriously impacted earlier today as hundreds of Belgian farmers on tractors blocked the roads around the port demanding looser environmental rules and better protection against cheap imports.

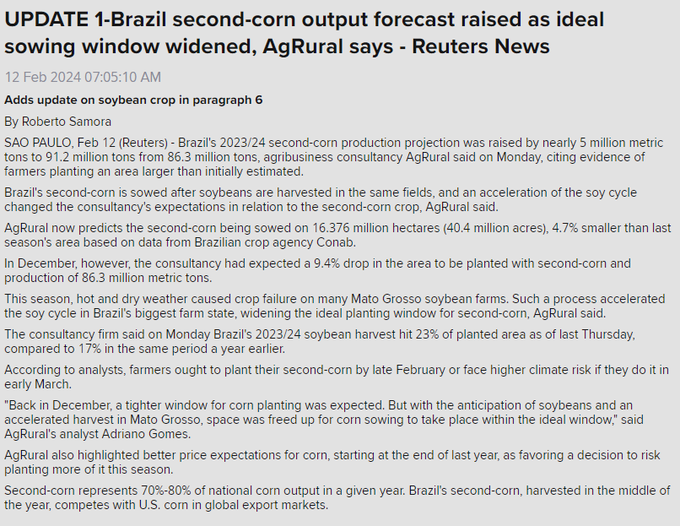
South American crop consultant Dr. Michael Cordonnier cut his Brazilian soybean crop estimate 2 MMT to 147 MMT, noting continued disappointing yields as harvest progresses.
Last week:
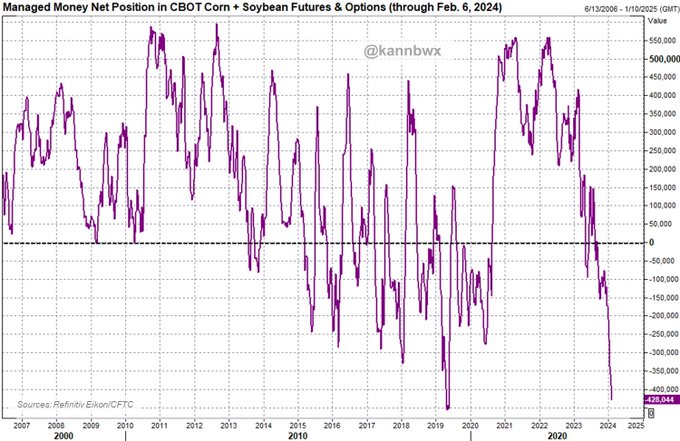
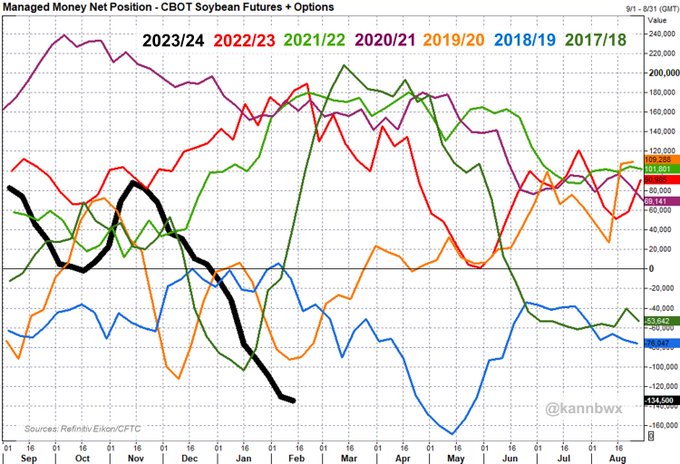
Money managers as of Feb. 6 were net short a combined 428k CBOT #corn & #soybean futures and options contracts. Starting to come close to the Apr/May 2019 record. Selling has been particularly sharp in the last six weeks.
++++++++
Combined or separate, the story is still the same. Funds are unusually bearish CBOT corn & soybeans. In corn, managed money gross shorts occupy 23% of all open interest (historical max is 25%). Same stat for soybeans is 18%, pretty high but well off the max (24%).
++++++++++++
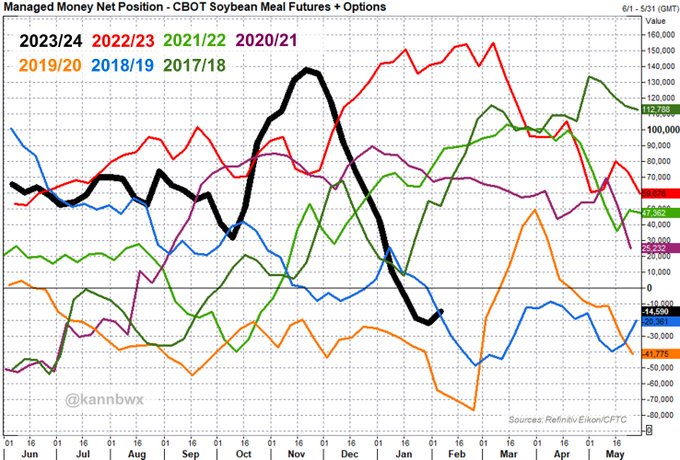
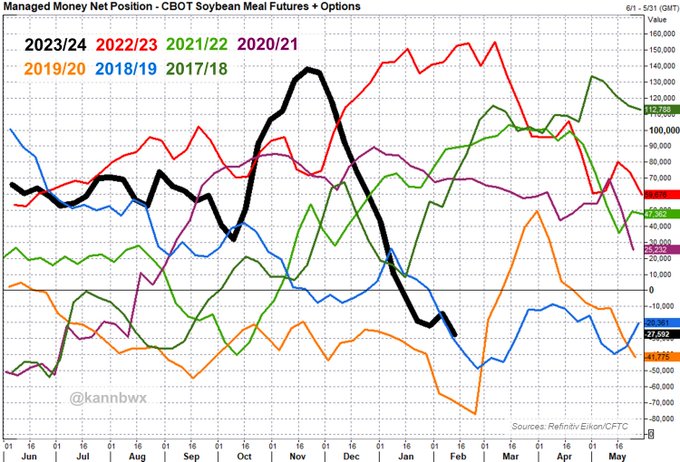
And in the 11th week, they finally relented... Money managers in the week ended Feb. 6 ended their historical selloff in CBOT #soymeal, becoming net buyers of 7.5k fut & opt contracts. However, futures hit fresh multi-year lows on Friday.
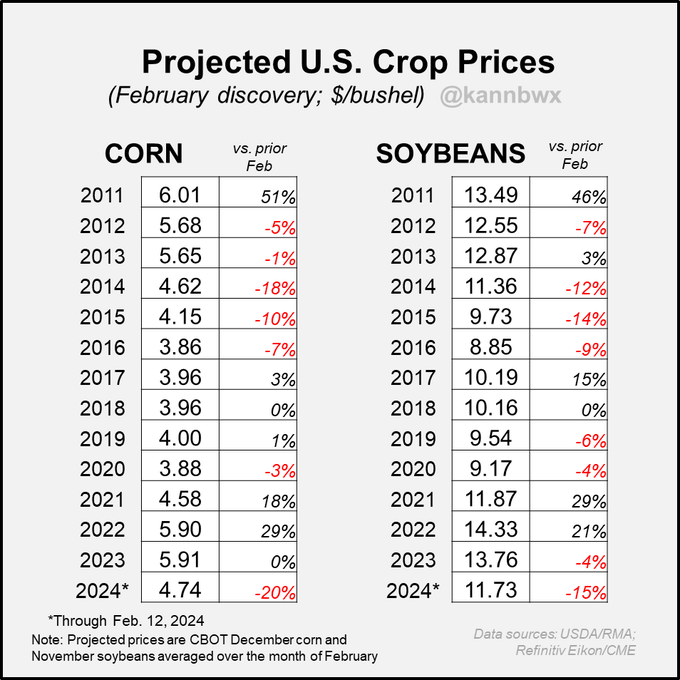
After 8 of 20 February trading days, new-crop CBOT #corn & #soybeans are averaging 20% and 15% lower than last Feb - the largest year-on-year % declines in 15 years.The average prices of CBOT Dec corn and Nov soy each February set insurance guarantees to U.S. farmers.
·
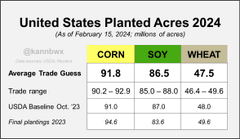
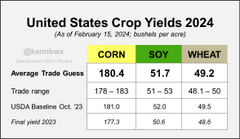
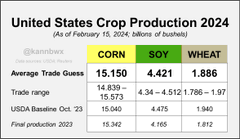
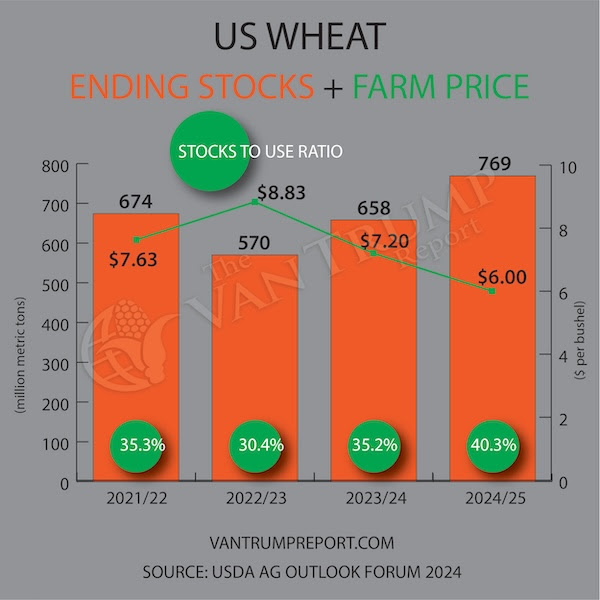
All trade estimates ahead of USDA's Grains & Oilseeds Outlook release on Thursday, looking at 2024/25 balance sheets for U.S. #corn, #soybeans & #wheat. Four tables are below: planted area, yield, production, ending stocks. "Baseline" was USDA's first stab at 24/25 back in Oct.
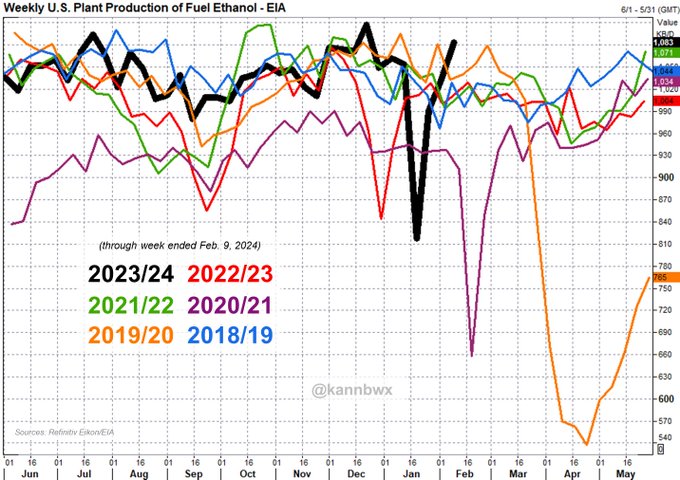
Jan NOPA crush coming in below expectations is not surprising given the harsh weather. Look at weekly US #ethanol output - drops in Feb 2021 & Dec 2022 were caused by frigid temps/wintry conditions. NOPA crush in those months were either at the low end of or below guesses, too.
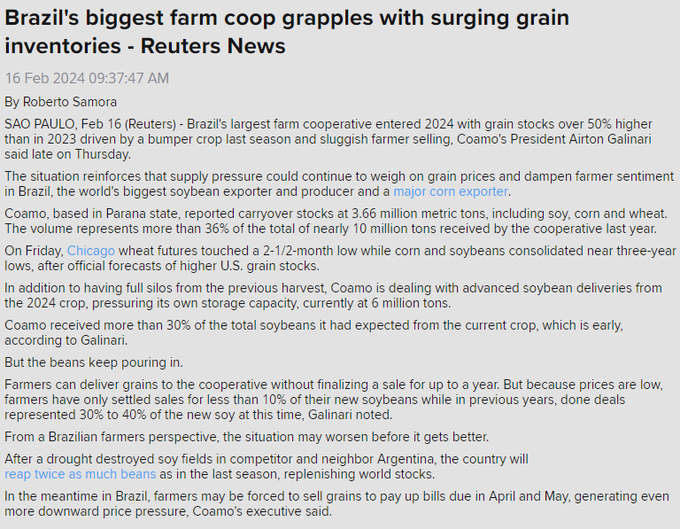
#Brazil's largest farm coop is reporting significantly larger grain stocks vs a year ago because of the big harvests & slow farmer selling. This comes at a time when farmer bankruptcy filings are rising in the country, potentially compromising the execution of grain contracts.
·
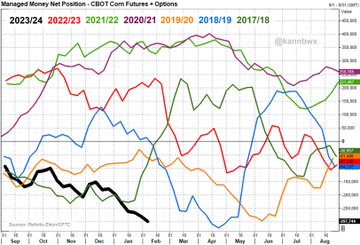
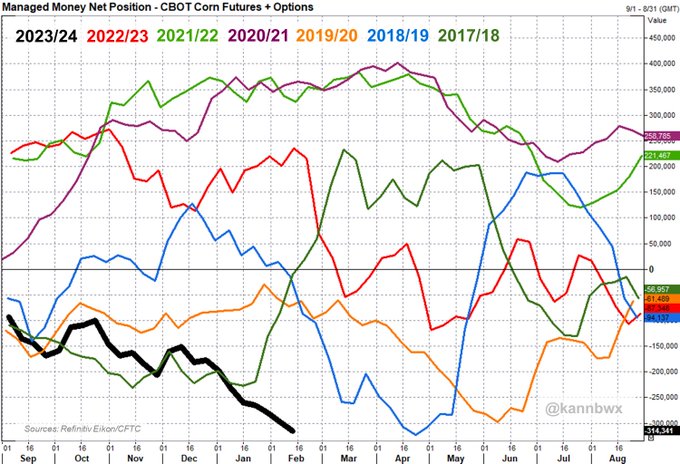
As of Feb. 13, money managers held their 2nd largest ever net short in CBOT #corn fut&opt at 314,341 contracts, close to the record 322,215 set in April 2019. The week ended Feb. 13 was funds' seventh consecutive week as net sellers of corn.
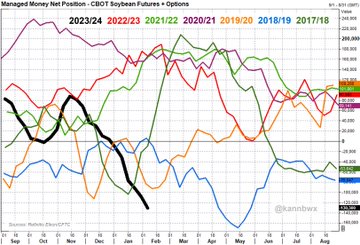
Money managers were net sellers of CBOT #soybeans for a record 13th consecutive weeks through Feb. 13. Their net short of 134,500 f&o contracts is the fifth largest net short of all time (behind April/May 2019).
Funds resumed heavier selling of CBOT #soymeal last week after a brief break in the prior week, which came after 10 straight selling weeks. The managed money net short as of Feb. 13 was 27,592 fut&opt contracts (most since Oct 2021) vs 14,590 a week earlier.
#Brazil's largest farm coop is reporting significantly larger grain stocks vs a year ago because of the big harvests & slow farmer selling. This comes at a time when farmer bankruptcy filings are rising in the country, potentially compromising the execution of grain contracts.
·
·
The 90 million planted number is simply a step back from the USDA's 91 million and probably closer to where we actually end up As you can see when you start to walk both acres and yield back at the same time the balance sheet can start to see some sizable cuts: 91M planted @…
·
As you can see, if planted acres are lower than the 87.5 million the USDA is forecasting and the average yield is right around 50 bushels per acre, the balance sheet can start to change in a real hurry 86.5M planted @ 51 bpa = 4.365B total prod = 296M ending stocks 86.5M planted…
·
·
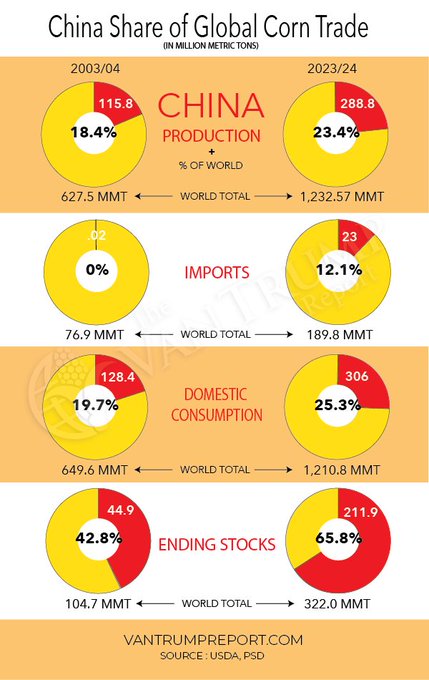
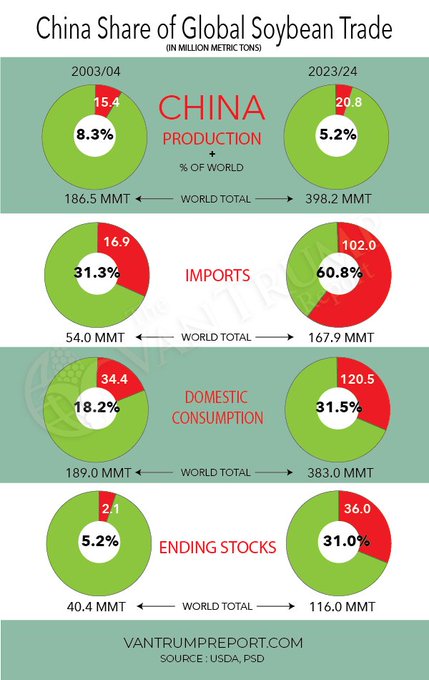
China today imports more soybeans, corn, wheat, and rice than any other country in the world. What you may not realize, however, is that China has been a net importer of ag products only since 2004
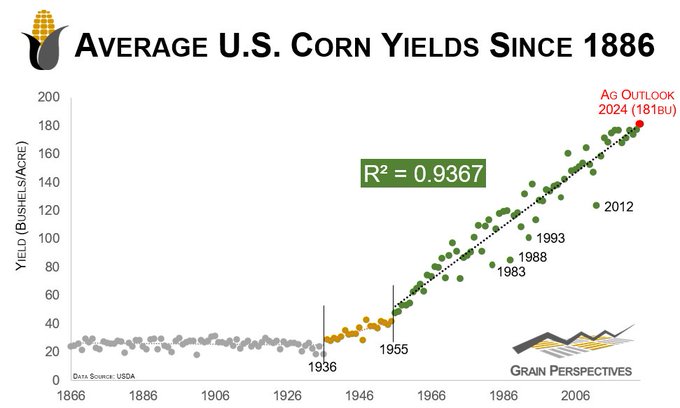
A historical look at U.S. corn yields and the 2024 estimate from the Ag Outlook Forum’s balance sheets (red). Agree or disagree with the USDA, this is likely the yield on the balance sheets until August without a significant weather event.
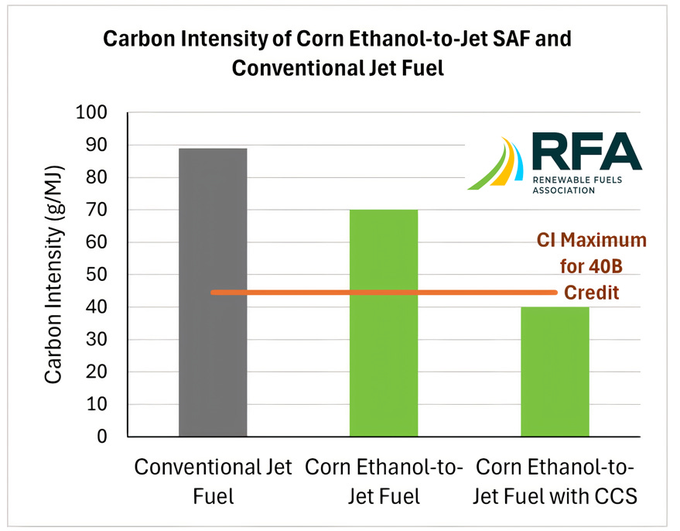
From Jan 28 Weekender: The bad news is - U.S. corn farmers and ethanol producers face a big hurdle ahead. Due to the carbon intensity levels of corn-based ethanol (as defined by the government’s preferred models), America’s favorite corn-based renewable fuel does NOT qualify for the tax credits that make SAF production economically feasible for companies such as LanzaJet. Unless regulations are revised or advancements are made in reducing the carbon footprint of U.S. corn-based ethanol as defined by EPA and DOE (i.e. tracible sustainability increased at the farm level, carbon sequestration at the plant level, etc.), LanzaJet will continue to rely on imported Brazilian sugarcane ethanol for the production of SAF. (CCS = carbon capture & storage aka the pipeline) In other words, we could be going from bad to worse
+++++++++++++++
Just a reminder, electric vehicles consume ZERO ethanol!