Some model solutions have several inches of snow, as far south as the Ohio River Friday PM/early Saturday.
More on that later today.
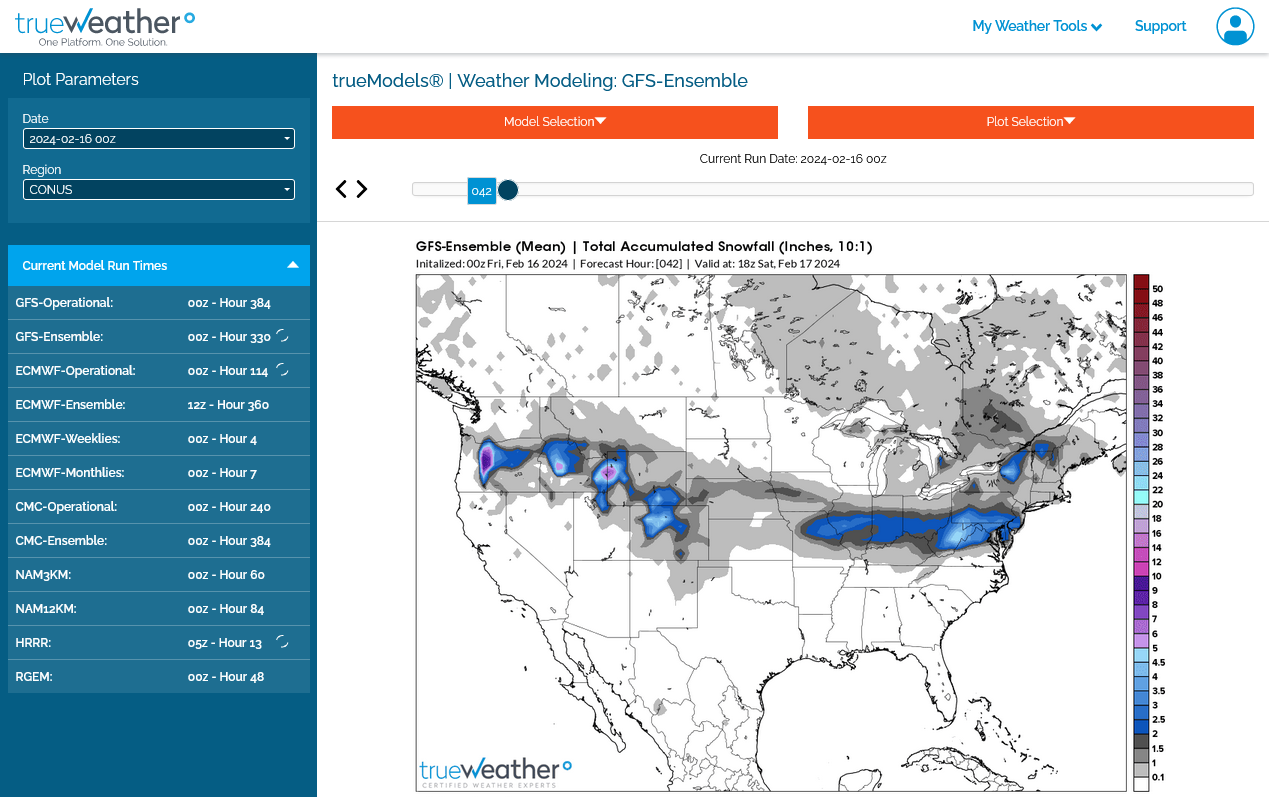
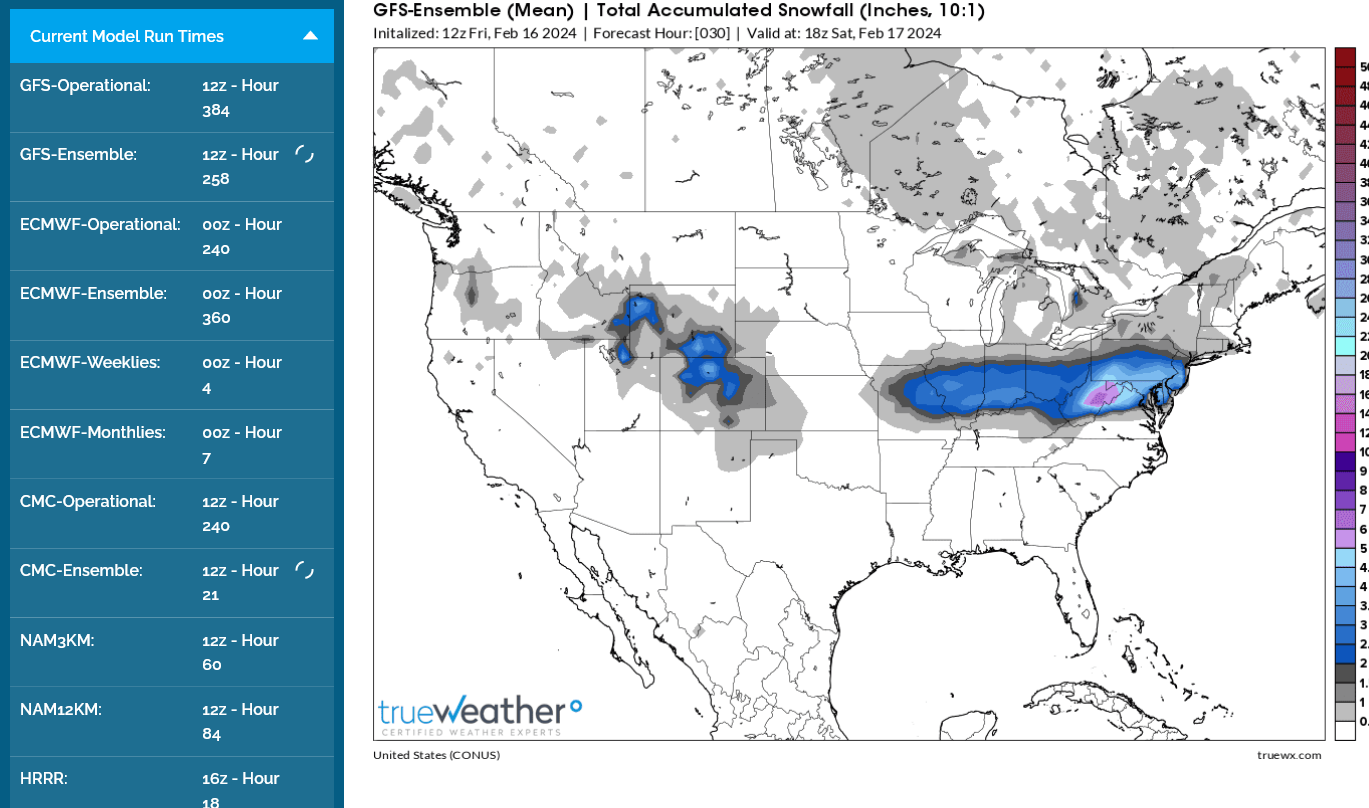
The American model (GEFS) has consistently predicted an inch or less of snow for this upcoming event in Indiana.
However, this last 12z run has 1.5-2 inches of snow that would be wet and slushy on warm roads but accumulate on the bare ground.
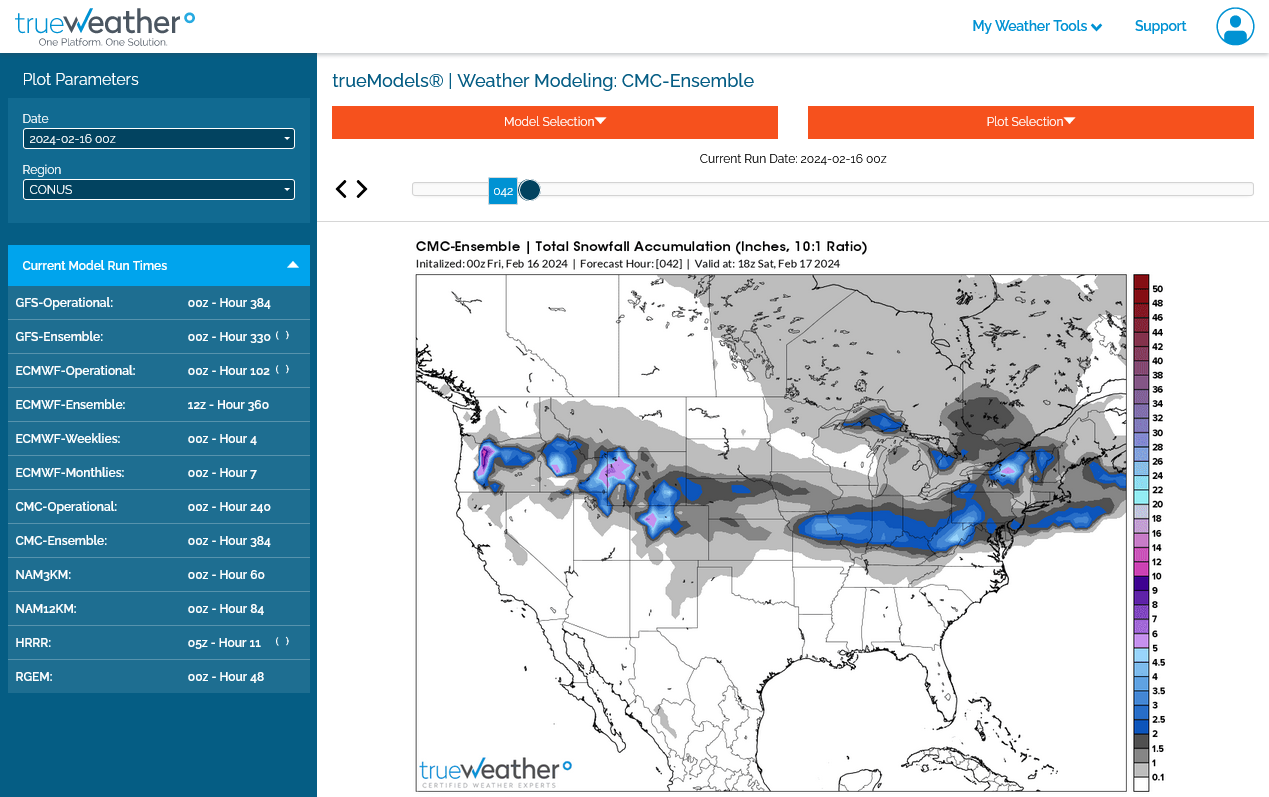
The 12Z Canadian model has continued to be a bit more bullish with the snow, having a very narrow band of 2-4 inches in Southwest IN.
The NWS will update these products a couple of times/day numerous hours AFTER the updated models are out.
The chance for 4+ inches is extremely slim. This system is not going to be well organized.
http://www.wpc.ncep.noaa.gov/wwd/winter_wx.shtml
Snowfall Probability Forecasts
The following charts depict the probability of snowfall reaching or exceeding the specified amount.
|
| Specific accumulation thresholds for Days 1-3: | All accumulation thresholds for: | |
| ≥ 1 inch | ≥ 8 inches | Day 1 |
| ≥ 2 inches | ≥ 12 inches | Day 2 |
| ≥ 4 inches | ≥ 18 inches | Day 3 |
| ≥ 6 inches | ||
| Day 1 | Day 2 | Day 3 |
≥ 4 inches | ≥ 4 inches | ≥ 4 inches |
≥ 8 inches | ≥ 8 inches | ≥ 8 inches |
≥ 12 inches | ≥ 12 inches | ≥ 12 inches |
24-, 48-, and 72-Hour Snowfall Percentile Accumulation Forecasts for Days 1-3
Day 4-7 Outlook
|
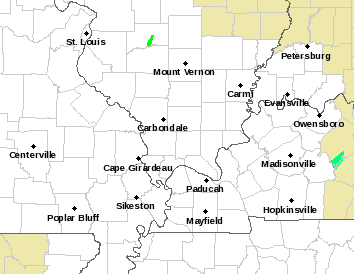
Here's the local NWS that has that area of responsibility, located in Paducah, KY.
I would not be surprised to see a weather advisory issued when they realize the guidance has increased snow amounts and we are closer.
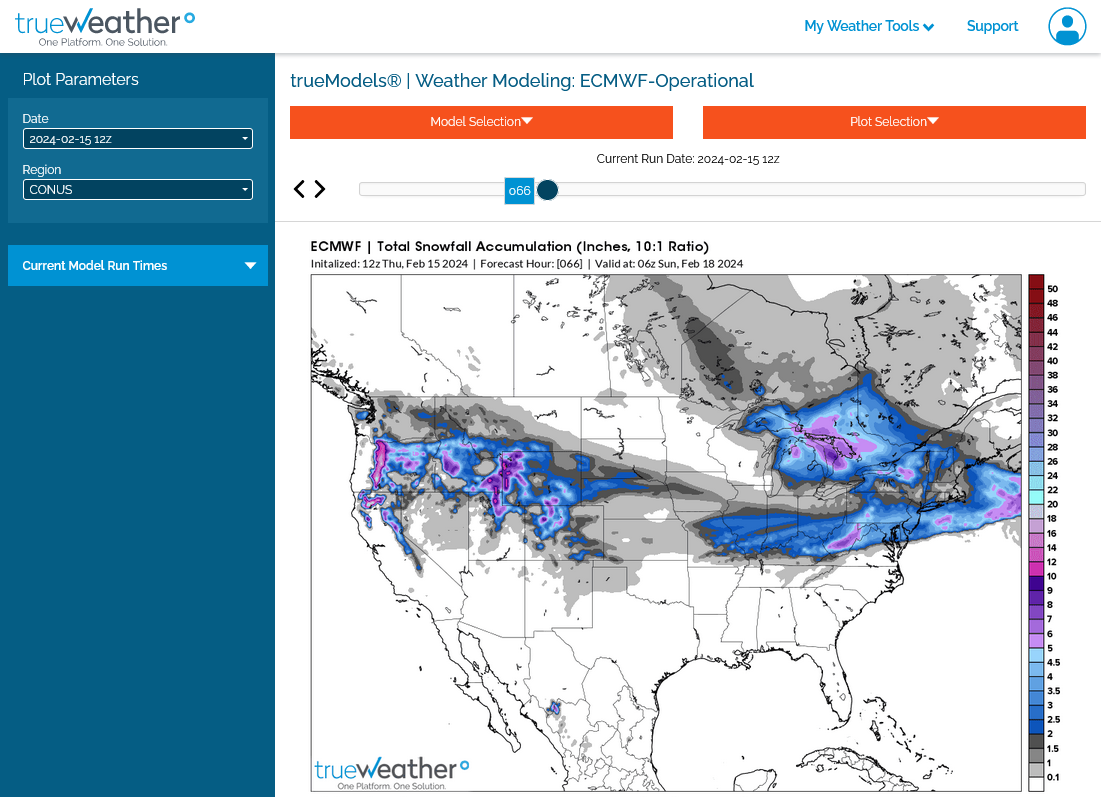
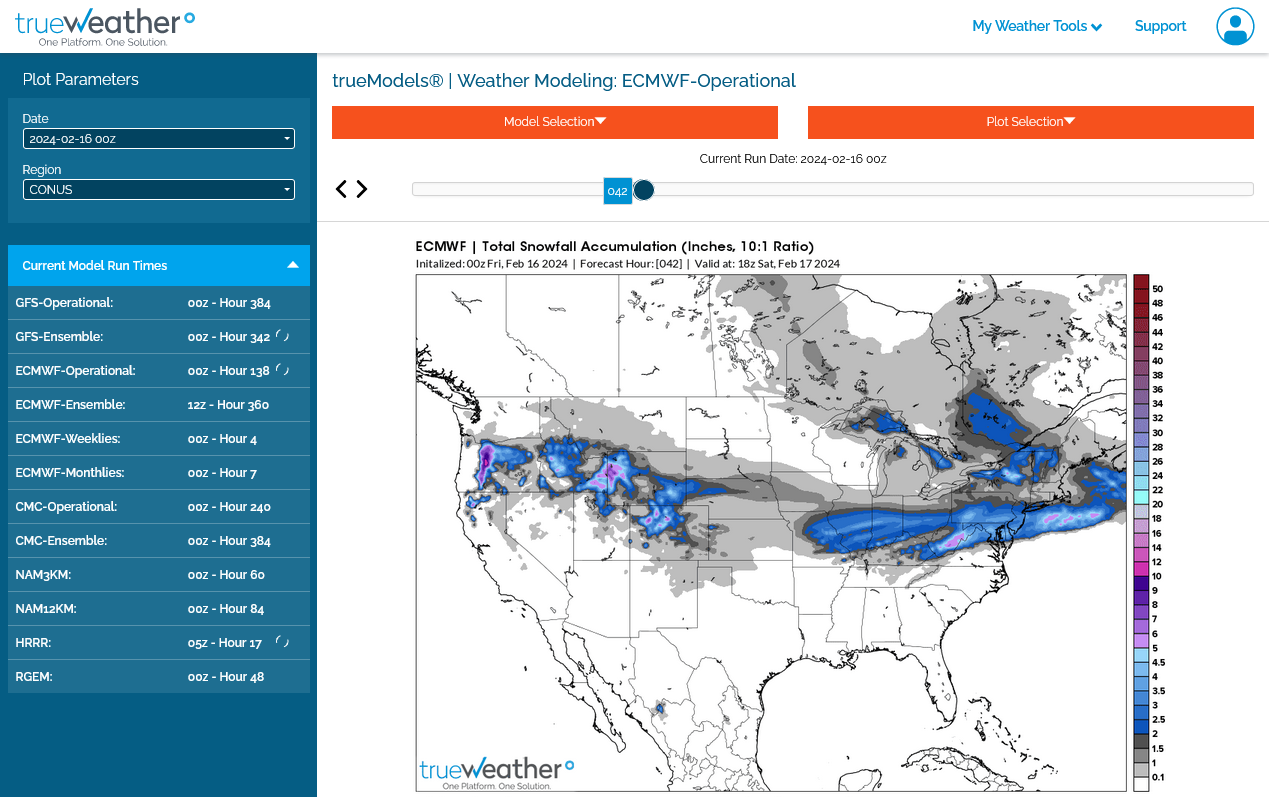
This was the just out 12z operational European model.
That's around 2 inches in Evansville, slightly higher amounts just north but under 4 inches. The snow starts early Friday afternoon and is over with by late evening.
+++++++++
The 12z European Ensemble has just over 2 inches below everywhere along and north of the Ohio River.
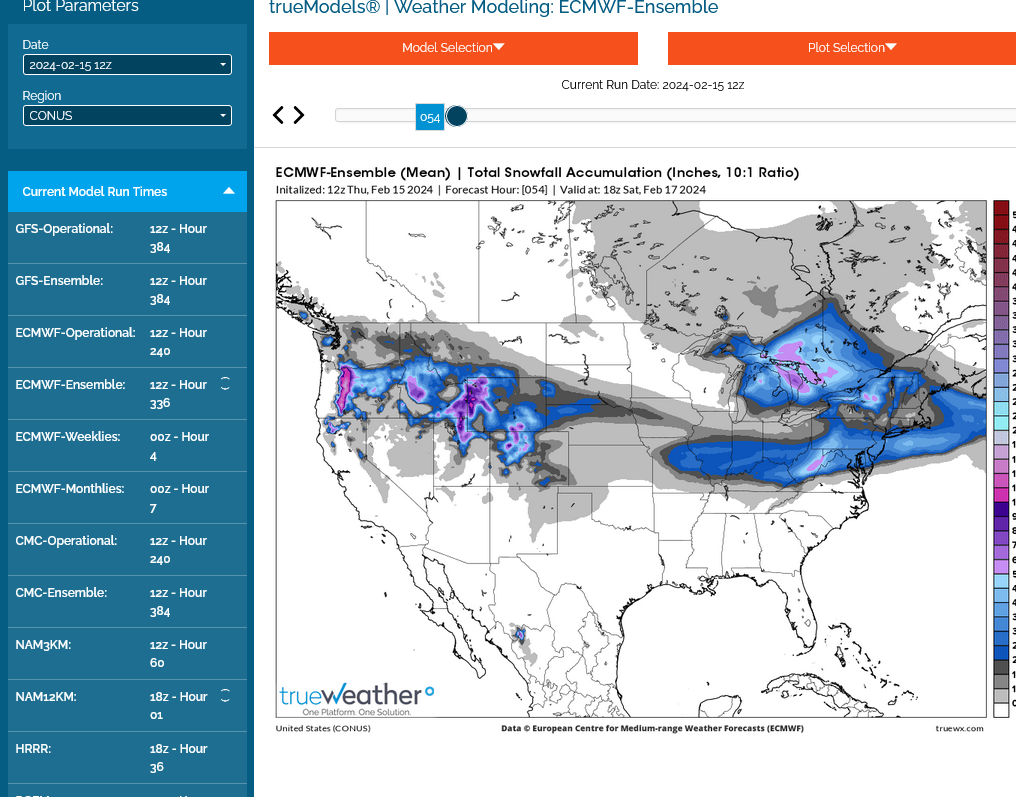
The ground is warm and surface temperatures will be ABOVE freezing so impacts, at worst will be some slushy snow on the roads even if 2 inches falls.
Grassy areas would have the minor accumulating snow that hangs around in the shady spots on Saturday with very cold temps....until we warm up well into the 40's on Sunday.
The just out 0z GEFS continues to be the most bearish with the least amount of snow.
A fairly sharp cut off from less than an inch along the Ohio River to 2 inches north of I-64, 25 miles north of the Ohio River. Again, this will NOT be a major storm and the ground is very warm, so unless we get an hour with an inch falling, most of it will melt on the roads shortly after it falls.
The 0z Canadian model below continues to be a bit more robust with amounts, about an inch more but still not major.
The just out 0z European Operational model below, like the Canadian model and the previous 12z European model run, has a bit more snow than the GEFS at the top. 2 inches down to the Ohio River.
Current Hazards at the link below.
Go to the link below, hit hazards box in the top right hand corner(it will also define all the color codes), if its not already in the hazards mode when you load the link.
Then you can hit any spot on the map, including where you live and it will go to that NWS with all the comprehensive local weather information for that/your county.

New radar product below
Go to: "Select View" then "Local Radar"
Hit the purple circle to see that local radar site
+++++++++++++++++++++++
This link below provides some great data. After going to the link, hit "Mesoanalysis" then, the center of any box for the area that you want, then go to observation on the far left, then surface observations to get constantly updated surface observations or hit another of the dozens of choices.
 |
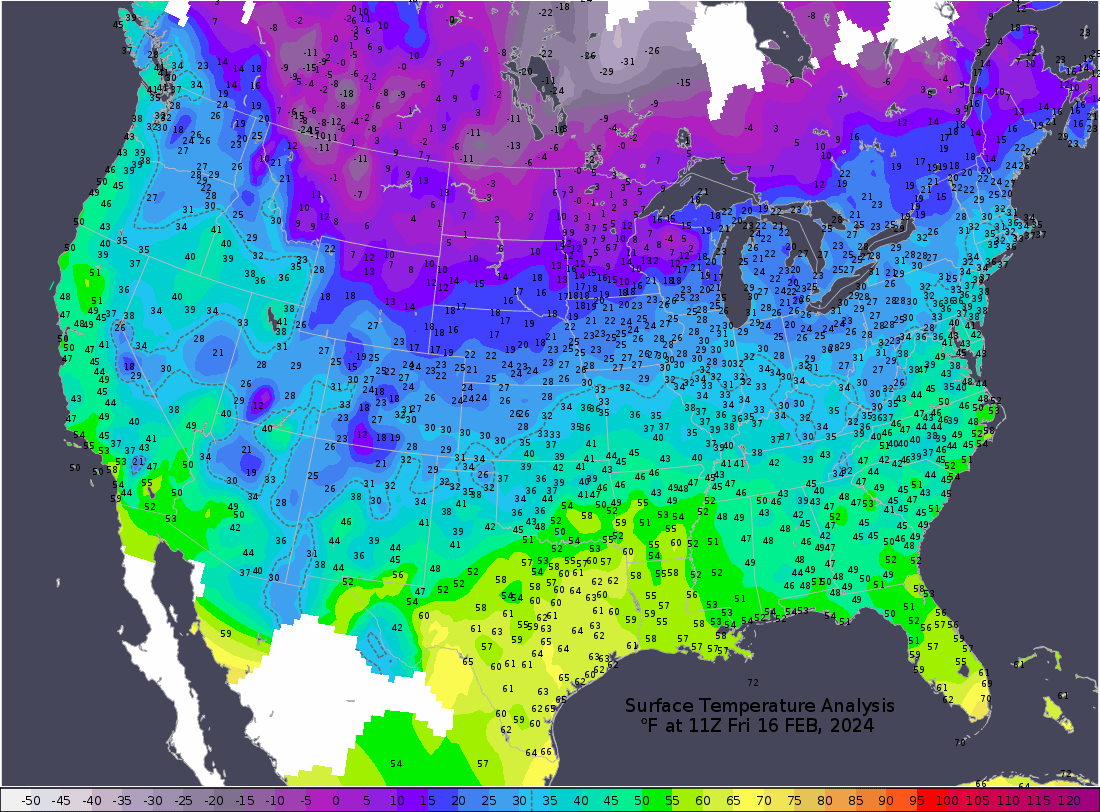
Current temperatures:
https://thermastor.com/dew-point-and-weather-maps/
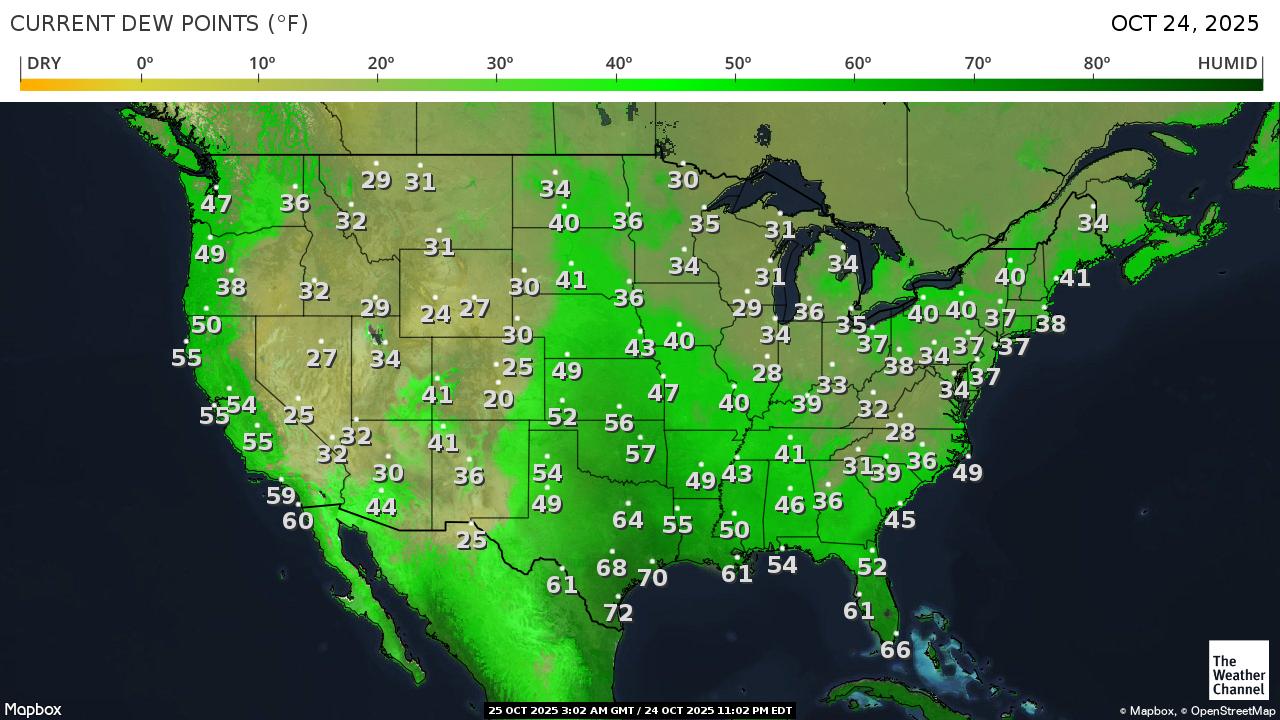
Current Conditions below updated every few minutes.
UPPER MIDWEST
https://www.spc.noaa.gov/exper/mesoanalysis/new/viewsector.php?sector=13#


https://www.spc.noaa.gov/exper/mesoanalysis/new/viewsector.php?sector=13#
LOWER MIDWEST
https://www.spc.noaa.gov/exper/mesoanalysis/new/viewsector.php?sector=20

https://www.spc.noaa.gov/exper/mesoanalysis/new/viewsector.php?sector=20#

https://www.spc.noaa.gov/exper/mesoanalysis/new/viewsector.php?sector=20# 
SOUTHCENTRAL
https://www.spc.noaa.gov/exper/mesoanalysis/new/viewsector.php?sector=15#
The just out 6z GEFS has increased snow amounts a tad and is more in line with the other models that have been slightly more bullish with snow amounts.
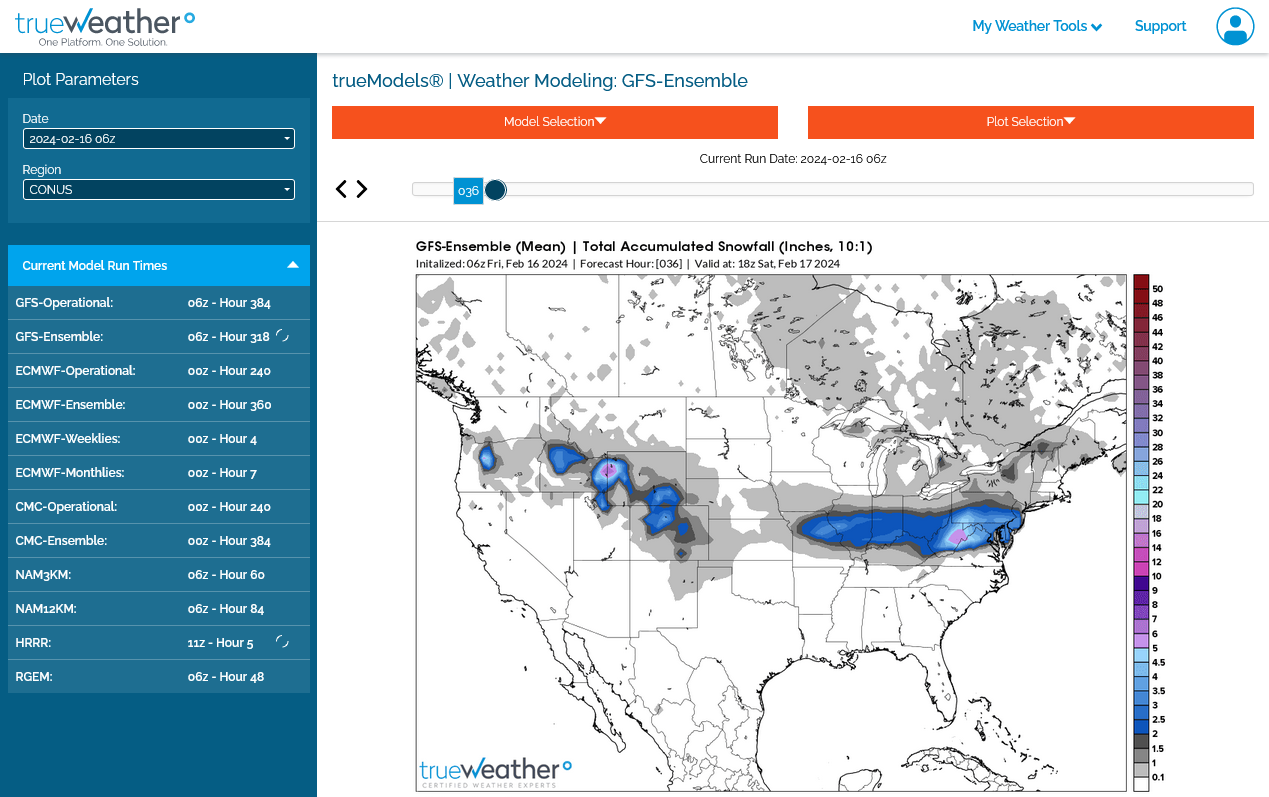
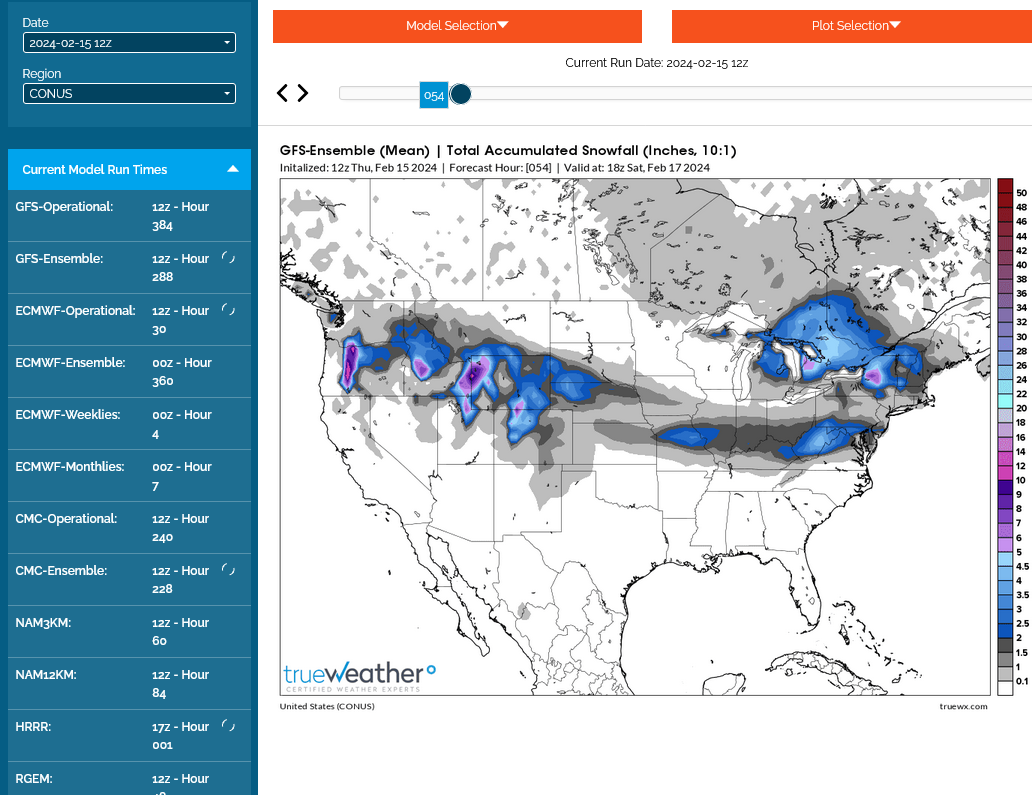
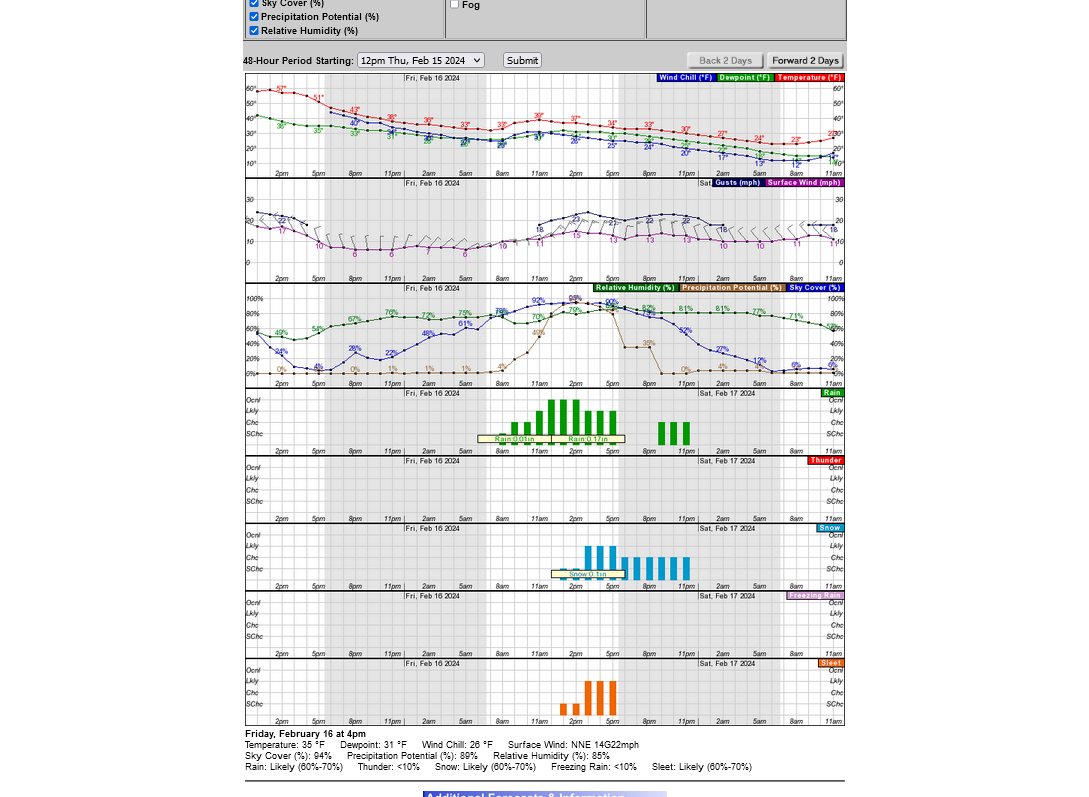
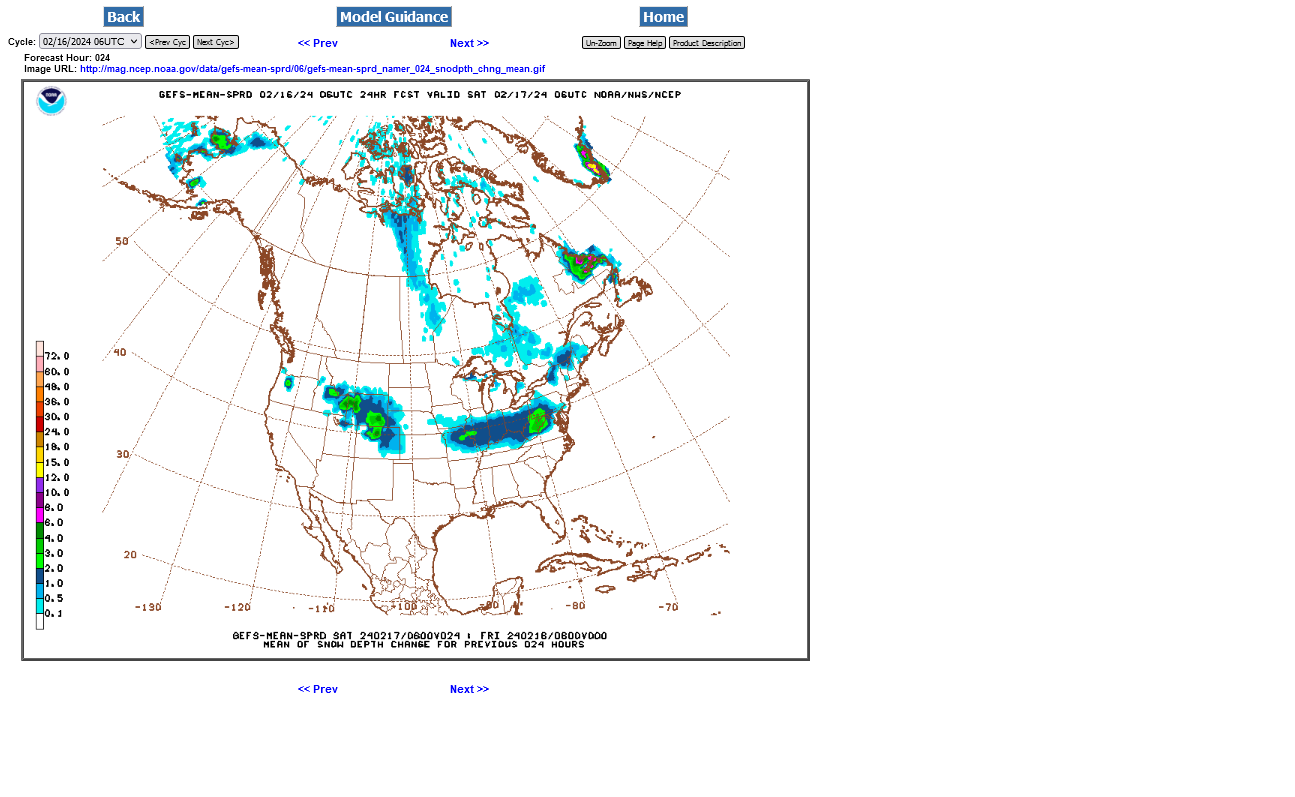
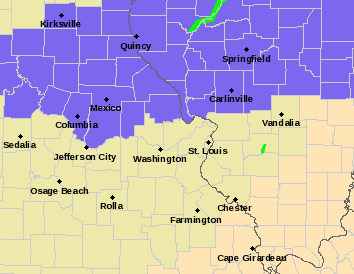
From a product use standpoint, I just noticed a strange disparity in the snow forecast product, when both of them are coming from the same model.
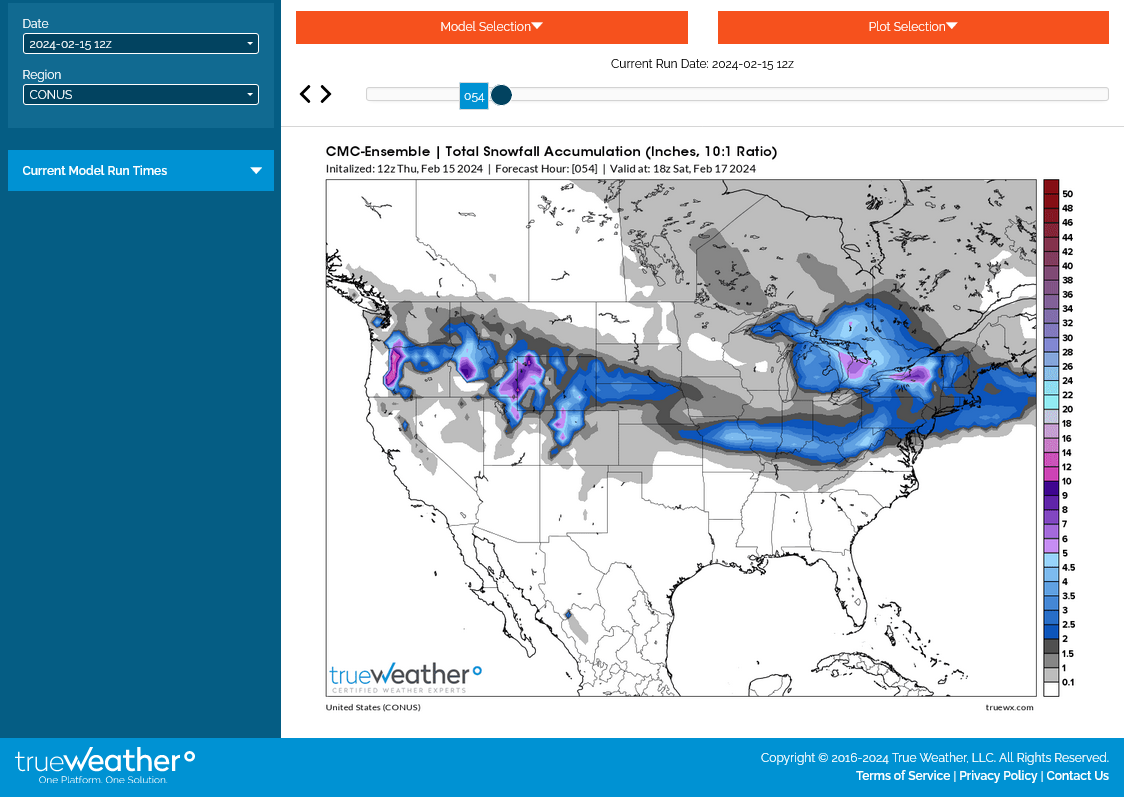
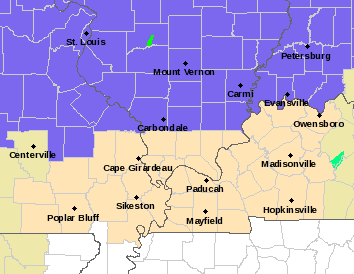
The one above is coming from TrueModels and the one below from NCEP.
The dark blue on the map above is 2.0 inches of snow, with the next color up, lighter blue =2.5 inches.
The dark blue on the map below is 1.0 inches of snow, with the next color up, light green being 2.0 inches.
Visually, they look the same with similar blue colors but the representation of the color coding is defined differently so that the map above is predicting 2 inches, where the one below it only 1 inch.
I think the one above is more realistic with the slightly heavier amounts and an extremely tight snowfall gradient right along the southern edge of the rain/snow boundary, which could feature some 3+ inch amounts, while 20 miles farther south, only 1 inch falls because it was 1-2 degrees too warm for snow.
The toughest challenge is determining where that rain/snow boundary will be located.
IN MO, IL and far southwest IN, The NWS thinks(based on their weather advisories below) the rain/snow line will be NORTH of what most of the graphical model products predict based on the depictions shown in this thread above.
Southern IL, especially is a spot where the NWS and the weather models(AND ME) have a huge disparity.
11am update: The NWS just added those areas in IL/IN to their Winter Weather Advisory, so the disparity is over.
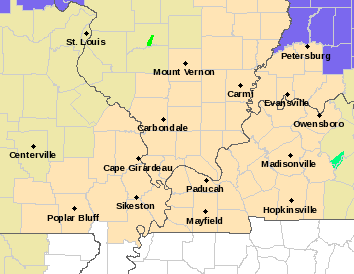
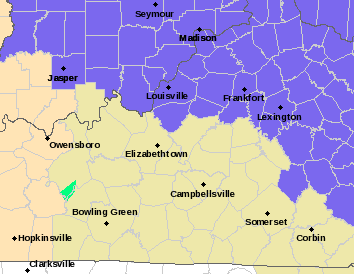
Here are the NWS advisories/forecasts to our west/St. Louis and east/Louisville. The weather advisories in purple lack continuity in Southern Illinois because of differences in the local NWS opinions, going from west to east. This could actually be not just from snowfall amounts but more from IMPACTS. With the St. Louis (ANDF PADUCAH) office feeling the warm roads will melt most of the snow, even if 3 inches fall in Southern Illinois........so no weather advisory for travelers. I disagree with no weather advisory in that area.
The NWS has just updated their Winter Weather Advisory to include much of Illinois and ALL of Indiana, similar to what my forecast and the models have shown the last 24+ hours.
The just updated 12z GEFS is closer to what the other more snow bullish models have shown the past 24 hours.
The southern edge of the very tight snow gradient is right along the Ohio River.
Less than 1/2 inch will fall south of that in KY, while 30 miles north of that, 3+ inches will fall(the 3rd blue color up on the scale to the right).
The heavy precip band has decided to set up just north of Evansville here at 3pm. Vincennes is really getting it.
This will shift south the next couple of hours but clearly, the heaviest amounts will be north of Evansville based on observing the radar at 3pm.
| |
Looks like around a 1 hour period between 4:30-5:30p of some moderate snow/sleet on the north side of Evansville..........then it ends abruptly early this evening.
These were snow amounts thru around 3 hours ago........with the farthest east areas still snowing.\
Southeast IL saw several reports of 4+ inches which extended east to Vincennes, IN(then slightly more farther east when its done). I measured around an inch here on the north side of Evansville/McCutchanville.
More IN reports later.
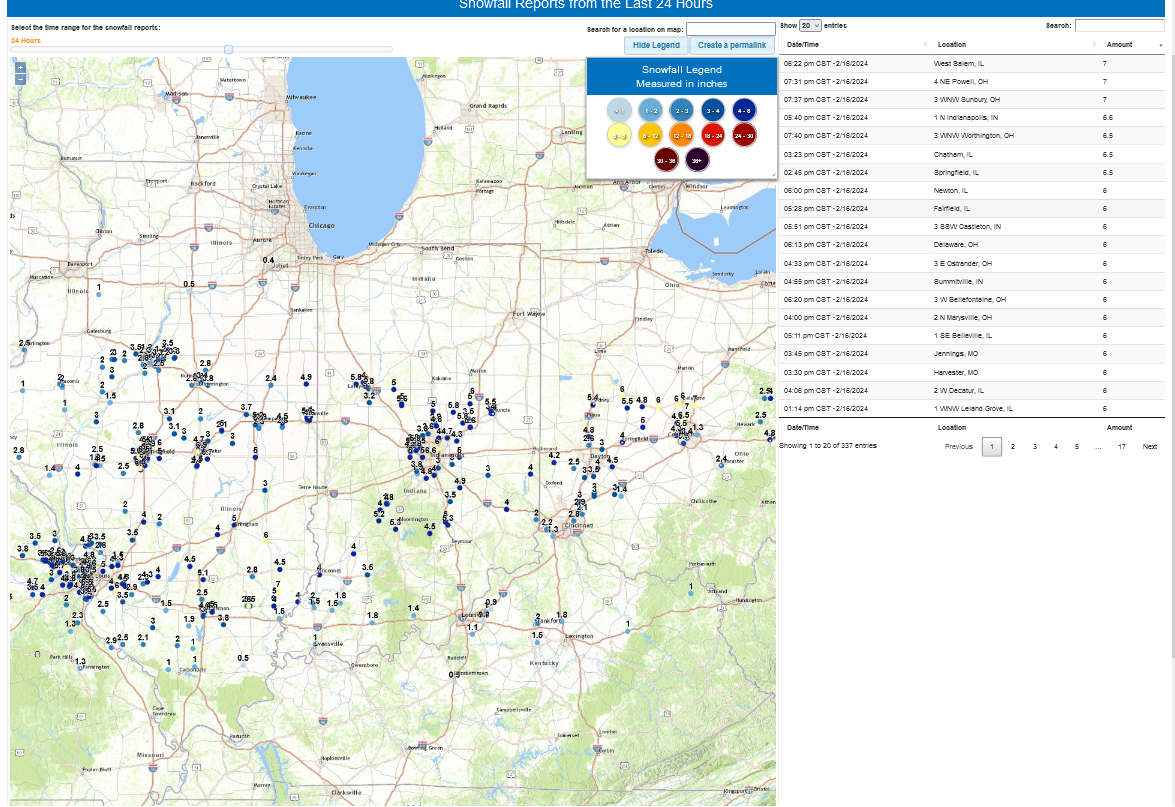
https://www.weather.gov/source/crh/snowmap.html?sid=pah
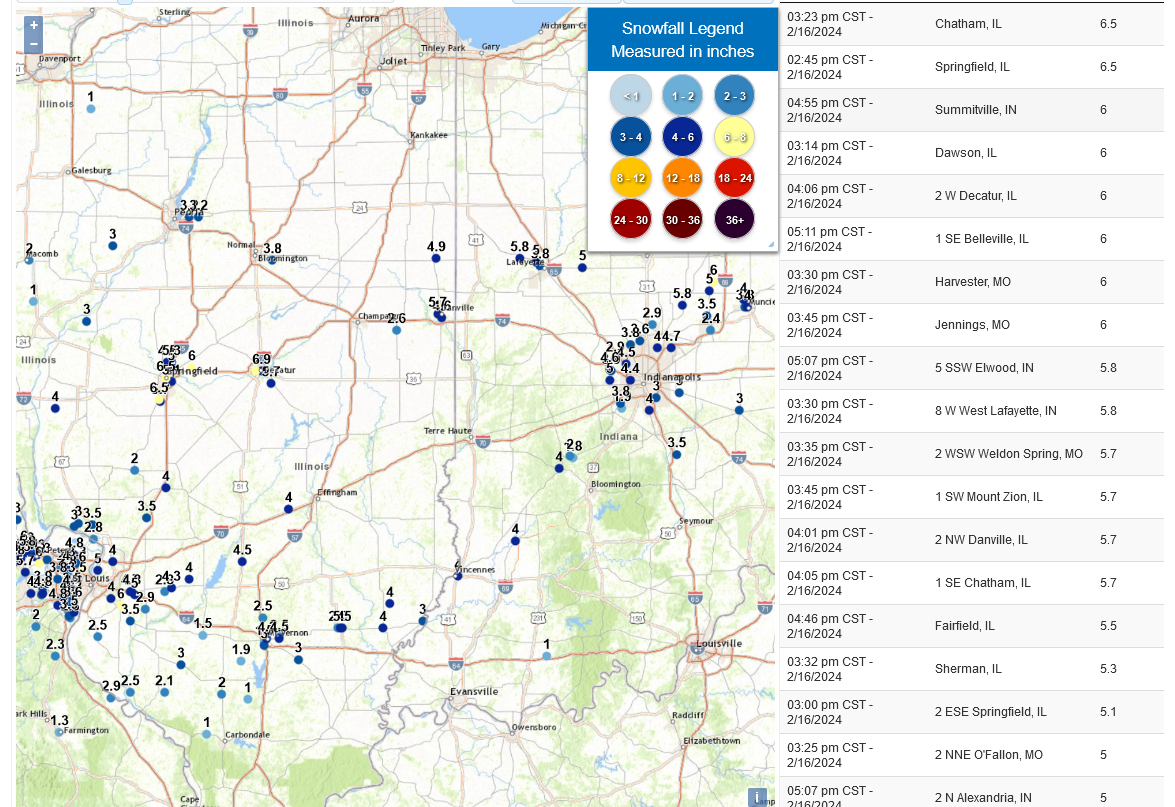
Go to this link to get hundreds of snow reports from this Winter Storm. Technology is AWESOME!
At that link, zoom in slightly to see the actual numbers next to the colored circles(like that depicted below).
40 years ago, there was no internet and you got everything from a satellite dish on the roof with less than .1% of the information we can get today.
https://www.weather.gov/source/crh/snowmap.html?sid=pah