By metmike - April 4, 2024, 12:47 p.m.
Look at the blue line on the graph below. Storage continues to be mega bearish. Highest ever for this time of year in history.
Interesting note: We constantly here about the climate crisis causing everything bad and nothing good. It hurts all good forms of life but somehow the exact same conditions........are perfect for all bad forms of life. Every time we have extreme weather from natural variation(even extreme cold) somehow, climate change played a role.(the truth is that this is a an authentic, scientific climate optimum for MOST life).
The truth is, we basically superimposed 2 deg. F of warming on the planet and MOST of that is in the coldest places, during the coldest times of year. Same weather systems/meteorology. Same laws of physics. Same natural variations........just 2 deg. F less cold in the coldest places and +125 parts per million of beneficial CO2(the building block for all life), that's still only half the optimal level of CO2 for most life.
Why am I bringing it up in this post?
One of the most profound REAL impacts from climate change that the media and others should be shouting out about if they were honest and objective would be the amount of natural gas in storage right now at the end of the mildest United States Winter in history.
How is this not a wonderful benefit? If this were the hottest Summer in history, we would have heard/read about it every hour of every day.
Because of this, a key energy source that we use to heat/cool our homes and generate electricity is the highest ever in storage and much of this is because we had a mild Winter.
Now consumers will have low natural prices and lower energy bills.
Now there will be less inflation from the utility energy sector.
Now we are covered by a massive energy security blanket for much of 2024.
We would NEVER want to attribute such a positive thing to a climate crisis.
Again, only part of that was caused by climate change and most of it from natural variation but the part from climate change WAS BENEFICIAL to ALL consumers and everybody that doesn't make money from higher prices. You will NEVER see that objective truth anywhere..............but here!
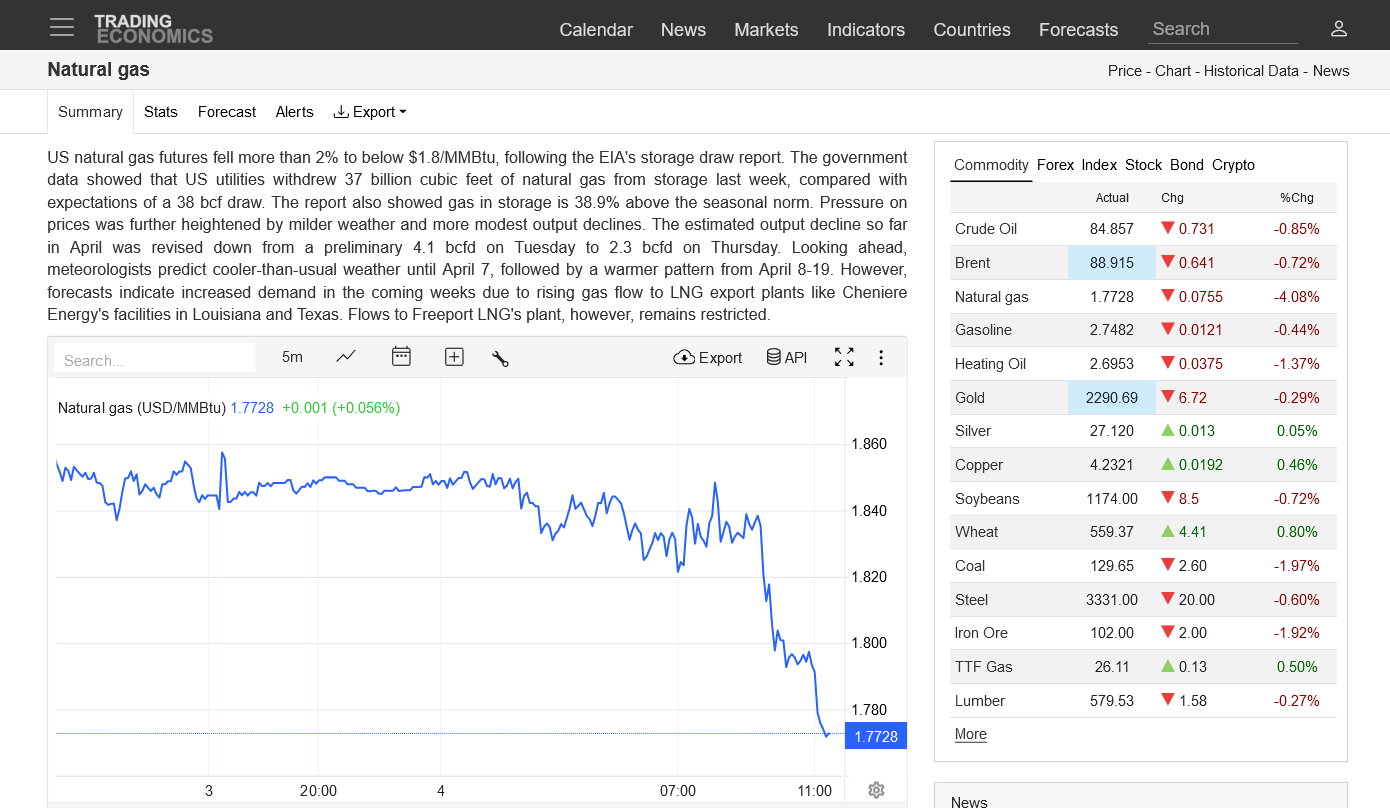
![]()
for week ending March 29, 2024 | Released: April 4, 2024 at 10:30 a.m. | Next Release: April 11, 2024
| Working gas in underground storage, Lower 48 states Summary textCSVJSN | |||||||||||||||||||||||||
|---|---|---|---|---|---|---|---|---|---|---|---|---|---|---|---|---|---|---|---|---|---|---|---|---|---|
| Historical Comparisons | |||||||||||||||||||||||||
| Stocks billion cubic feet (Bcf) | Year ago (03/29/23) | 5-year average (2019-23) | |||||||||||||||||||||||
| Region | 03/29/24 | 03/22/24 | net change | implied flow | Bcf | % change | Bcf | % change | |||||||||||||||||
| East | 363 | 387 | -24 | -24 | 337 | 7.7 | 298 | 21.8 | |||||||||||||||||
| Midwest | 510 | 528 | -18 | -18 | 426 | 19.7 | 369 | 38.2 | |||||||||||||||||
| Mountain | 162 | 166 | -4 | -4 | 81 | 100.0 | 88 | 84.1 | |||||||||||||||||
| Pacific | 227 | 223 | 4 | 4 | 73 | 211.0 | 149 | 52.3 | |||||||||||||||||
| South Central | 996 | 991 | 5 | 5 | 920 | 8.3 | 723 | 37.8 | |||||||||||||||||
| Salt | 294 | 294 | 0 | 0 | 263 | 11.8 | 216 | 36.1 | |||||||||||||||||
| Nonsalt | 701 | 698 | 3 | 3 | 657 | 6.7 | 507 | 38.3 | |||||||||||||||||
| Total | 2,259 | 2,296 | -37 | -37 | 1,837 | 23.0 | 1,626 | 38.9 | |||||||||||||||||
Totals may not equal sum of components because of independent rounding. | |||||||||||||||||||||||||
Working gas in storage was 2,259 Bcf as of Friday, March 29, 2024, according to EIA estimates. This represents a net decrease of 37 Bcf from the previous week. Stocks were 422 Bcf higher than last year at this time and 633 Bcf above the five-year average of 1,626 Bcf. At 2,259 Bcf, total working gas is above the five-year historical range.
For information on sampling error in this report, see Estimated Measures of Sampling Variability table below.

Note: The shaded area indicates the range between the historical minimum and maximum values for the weekly series from 2019 through 2023. The dashed vertical lines indicate current and year-ago weekly periods.
The U.S. Energy Information Administration (EIA) on Thursday reported a withdrawal of 37 Bcf natural gas from storage for the week ended March 29. The result fell just shy of expectations and, with inventories still plump and injections on the horizon, left Nymex natural gas futures under pressure. Ahead of the 10:30 a.m. ET government…
+++++++++++++
https://tradingeconomics.com/commodity/natural-gas
Congrats, Mike!
Thanks, Larry!
Hey Mike,
You’re welcome. You have posted at times about excessive cold being more of a killer (of humans I believe though you may have also been referring to other animals) than excessive heat and that, therefore, that is a net benefit of GW. Would you mind reposting that here along with backing data?
There’s an interesting discussion ongoing at the American weather BB addressing that GW isn’t all bad news and that also including benefits like increased greening/plants would make for a more honest assessment. Fewer deaths from excess cold vs excess heat is as you’ve emphasized another benefit.
Also, what about the potential net energy savings due to worldwide heating costs possibly being higher than cooling costs? We know that as you said in your POTW that net annual US NG usage is lower when the US is warmer overall because NG is used more as a heating fuel plus generator of electricity for electrical heating vs generator of electricity for AC demand. (I can back this up from my own experiences following NG storage.) Regarding the bigger picture, please tell me if we know for sure that overall WORLD energy usage has dropped due to GW. Do you know? Do you have data sources to back this up? Even if you know that that’s true for the US, what about the globe overall?
I’m not at all trying to minimize the bad effects of GW. But I’d prefer to also include the good effects for a more honest assessment.
You stated that pretty well, Larry!
Cold weather does kill 10 times more humans than hot weather.
And I speculate that it kills 200 times more life than hot weather.
I have chess practice for the kids at Oak Hill Elementary this afternoon and will get back to you this evening.
Theres no disputing that the warming increases heat waves by around 2 deg. F.
It increases extreme rains From the atmosphere holding 7% more moisture.
warmer oceans in hurricane season mean higher potential for hurricanes, especially rapid intensification under the right conditions.
sea levels are increasing just over an inch/decade.
That summarizes much of the bad stuff.
global drought is not increasing. Extreme weather is not increasing.
Blowing that away by itself is 26% more global food production from photosynthesis, just from the +130 ppm increase in CO2. The planet is massively greening up. Most Life loves this current climate optimum as seen by anybody actually looking with authentic science.
we can discuss the benefits to the (lower)energy use/demand sector more here.
Back to energy weather in a minute.
But with regards to this 0 emission scenario by 2050 nonsense or whatever ludicrous year they claim the objective is, keep in mind that CO2 emissions are well mixed in the global atmosphere.
This proves the entire thing to just be a political farce in the Western World sold for crony capitalists and governments to exploit for their self serving agenda's:
India leads coal plant constructions in Asia outside China: Report
https://www.cnbc.com/2024/01/11/china-and-india-cant-wean-themselves-off-coal-anytime-soon.html
++++++++++++++++++
By metmike - April 5, 2024, 9:29 a.m.
https://en.wikipedia.org/wiki/BRIC
BRIC is a term describing the foreign investment strategies grouping acronym that stands for Brazil, Russia, India, and China. The separate BRICS organisation would go on to become a political and economic organization largely based on such grouping.
metmike: The graph below should be a reality check for every American. It's not a matter of IF China will pass up the USA but WHEN it will happen.
Who realistically thinks that the US dollar will still be the global currency in 2050 when China's economy is double the size of the US???
This is just 1 estimate below but no credible estimate shows the US maintaining the economic dominance which has allowed it to act with impunity, using the US Dollar for political punishment to countries is doesn't like or to enjoy many tremendous other benefits.
Abusing those privileges like we are right now with Russia, will with 100% certainty cause the demise of the dollar to come SOONER rather than LATER.
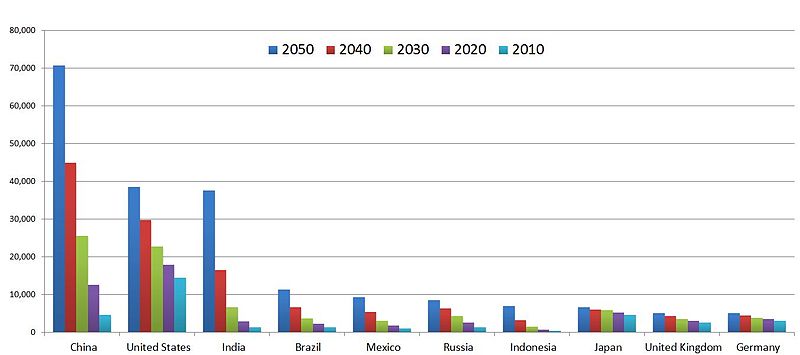 Projection of the ten largest economies in the world to 2050, measured in GDP (billions of 2006 USD), according to Goldman Sachs in 2007
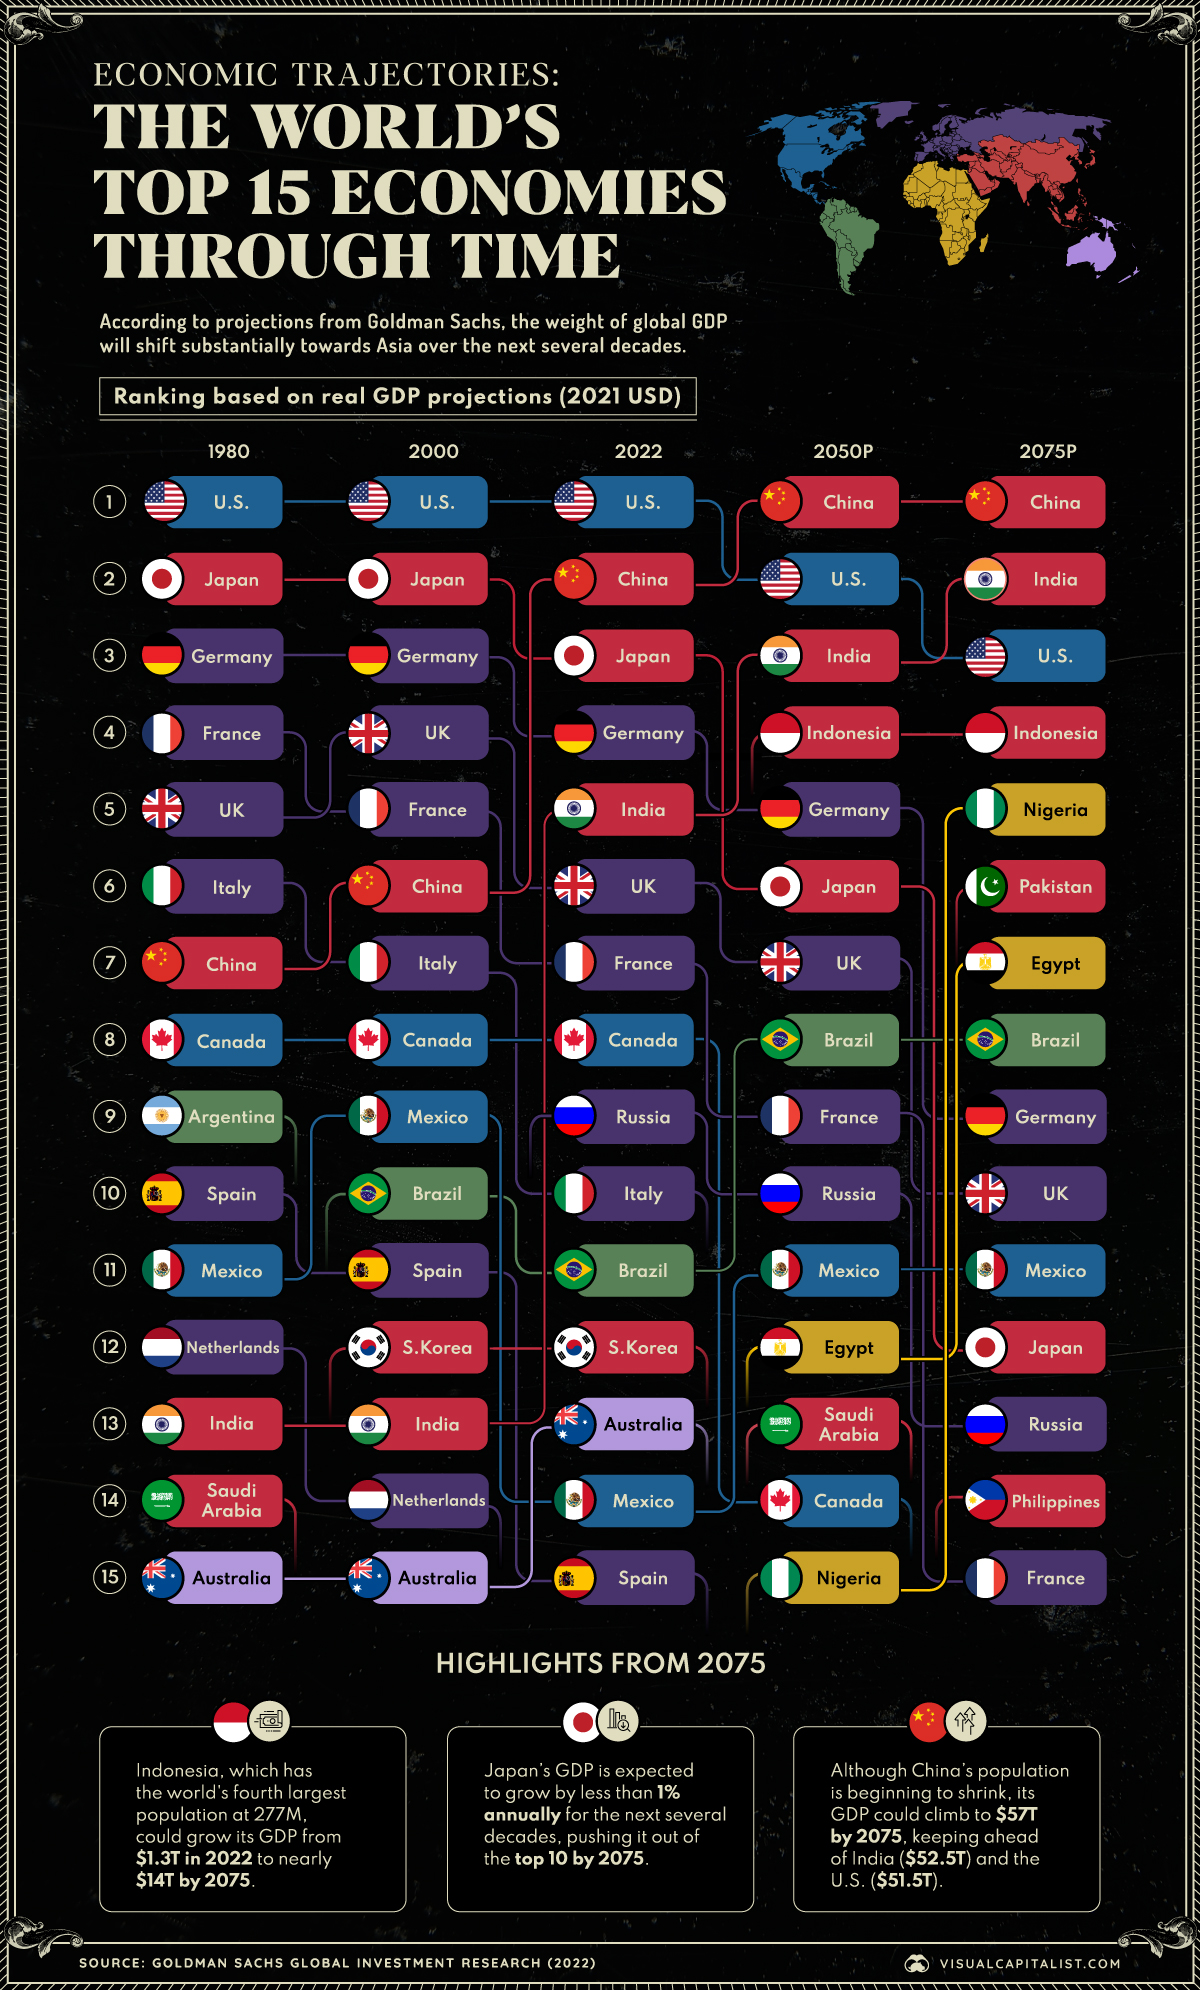
https://www.visualcapitalist.com/top-economies-in-the-world-1980-2075/
There is no way that Asian countries will bow to the US Dollar when they become the dominant economic continent. The USA, with its retarded global political policies right now (ESPECIALLY in Ukraine and Israel/Gaza) is just accelerating the demise of the US dollar and our ability to control global policies from other realms.
As a result, the CO2=pollution scam/hoax is on borrowed time.
The CO2=pollution scientific farce is well known by Asian countries that follow authentic science and energy policies.
These facts below prove the futility of the ludicrous US and Western countries imposing of economy damaging fake green energy schemes for crony capitalism and political agenda.
We're left with 2 potential explanations for this:
1. Asian countries don't care if they destroy the planet(THEIR planet) with their CO2 pollution causing all the really, really bad things to happen in a few decades. Billions of selfish people willing to destroy everything for everybody, just so their economies and people can benefit the way our country did the past 100 years as the result of fossil fuels.
OR
2. Asian countries know that CO2 is a beneficial gas, greening up the planet. All the really, really bad things are NOT going to happen, so they focus on authentic science and the best energy/economics for THEIR countries that will not harm the planet. Instead of joining the West's junk science propaganda-fest that exploits CO2 for corrupt science/government/capitalism and dishonest media reasons.
Almost all the authentic evidence and science points to #2.
Since we live in the West, we get bombarded with #1 every hour of every day which is NOT the truth.
Unless you're an atmospheric scientist type or have the ability to do objective, independent science and energy research(that ignores propaganda, junk science) why would you not buy into the massive, convincing sounding/reading propaganda that defines #1?
There are many separate issues that impact this realm.
For instance, eliminating the combustion engine and going 100% electric means bye bye ethanol.
They refuse to tell you that because it would cause the ag industry to become an extreme enemy, along with almost every crop farmer in the USA.
Instead, we read hogwash articles about how ethonal will fit into the low carbon future.
Not with the 0 emission, all electric plan we supposedly need to save the planet.
ALL electric cars DO NOT burn fuels like combustion engines. Spin it however they want but entirely electric means no more corn ethanol for those vehicles. NONE!
Hybrids would still have a combustion engine but this is ALL electric that the absurd future will bring.
You can't find any articles telling the truth about this.
The US will never be all electric, unless a new technology is invented that allows them to to triple their efficiency(cost/range/cold weather performance and so on).
This could happen. Improved technologies in new fields with strong financial and other incentives happen all the time.
However, with the current EV vehicle technology, people will NEVER buy into it on a scale where it replaces most of the BETTER combustion engine technology.
ANOTHER SPECTACULAR EV ROAD TRIP
22 responses |
Started by 12345 - Jan. 5, 2024, 2:12 p.m.
https://www.marketforum.com/forum/topic/101621/
++++++++++++
https://tradingeconomics.com/tsla:us
Mike and others who may be interested, please read a post I just did at the American weather BB on the effects of increased CO2 not all being bad. Also, I asked whether increased vegetation from increased CO2 will eventually lead to equilibrium and thus a halt to GW. I also ask if climate models are even able to take this into account: (let me know if this link works)
Great comment, Larry!
I agree with it.
Thanks for sharing It with us. I can see why you enjoy conversations there. If not for this place, I would be tempted to join you.
Thanks. Here is a reply:
“The article linked was more sanguine about CO2 effects than your write up. Not all of the greening is due to CO2 and increased greening is a mixed blessing. Your description of radiation effects isn't correct. Increased photosynthesis causes plants to absorb more sunlight, and reflect less, so greening generally causes warming. The effect is particularly large in the arctic where greening is mainly due to expansion of shrubs and trees northward. The greener surface absorbs much more sunlight than the snow or tundra surface it replaces. I believe these effects are included in models but am not familiar with the details.
Finally here's a short interview with an ag expert, who expects a negative impact from CO2 on agriculture in most areas.
Here’s his 2nd reply, which again says that increased greening leads to further warming in many places and thus negates the benefit of CO2 removal by those plants:
“Related to the CO2 fertilization post above, the recent study below accounted for the albedo effect of planting trees. In many places around the world, planting trees causes warming, as increases in absorbed sunlight offset the benefit from CO removal.
Thanks much, Larry.
Where to start.........
1. Of course CO2 is plant food! There's no debate on this. It amazes me how science trained minds that were convinced CO2 is pollution first..........have closed their minds to the authentic agronomy/plant science that proves it indisputably. Without a shred of doubt! I've studied this objectively as a scientist and somebody that predicts crop yields based on growing conditions for 3+ decades.
https://www.marketforum.com/forum/topic/69258/#71114
https://www.marketforum.com/forum/topic/69258/#71266
That last link is where you'll get the greatest compilation of experimental results from controlled CO2 studies of almost every plant in the world(thousands). With all things being held the same.........except for elevating CO2. The data proves irrefutably that CO2 is plant food.
I've seen some greatly flawed studies from scientists that want to show work that states otherwise for various flawed reasoning. This only shows the bias of the scientists doing the studies. The massive data from objective plant studies proves without a shred of doubt that CO2 is plant food.
The optimal level of CO2 for most plants is around 900 ppm. We are not quite half of that.
2. On the albedo of global greening absorbing more sunshine and warming the planet. I can debunk that myth quickly.
We know that the MOST warming is taking place in the coldest places and at the coldest times (higher latitudes during the Winter and at night).
Those are also the times when albedo from the sun has the LEAST impact.
For instance, during the Northern Hemisphere's high latitude, greatly amplified warming of Winters, the solar angle is either near the horizon and insignificant or below the horizon with darkness.
The nights (with no sun) have been warming the most, days the least. Also, the driest locations with the lowest humidity are warming the most.
This is because of the radiation physics of CO2 and H2O and not albedo. In areas with the highest water vapor content, water vapor crowds out much of the CO2 absorption from the same bands of absorption. Some of the radiation absorption bands are already saturated from H2O in areas with very high dew points.
In drier areas........which includes ALL cold places, CO2 is able to absorb more long wave radiation because of the absence of H2O absorbing at the same bands.
There's no disputing this proven law of radiation physics!
https://www.youtube.com/watch?v=XIBsjBvRTew
The LEAST amount of warming has been happening in places with the greatest vegetation increase, during the growing seasons. During the days, with the sun shining is when greater vegetation results in LOWER readings.
Every operational meteorologist knows to forecast lower daytime temperatures(and higher dp's) over highly vegetated areas in the growing season, which includes massive corn fields......especially on sunny days with evapotranspiration becoming a more significant factor.
https://www.marketforum.com/forum/topic/69258/#69259
https://www.marketforum.com/forum/topic/69258/#99598
More discussions here on that:
https://www.marketforum.com/forum/topic/98328/#98329
https://www.marketforum.com/forum/topic/98304/#99449
+++++++++++++
Most of the widespread misunderstanding of science related to this by scientists relates to confirmation/cognitive bias vs the scientific method.
The more damaging impact that CO2 is going to have on climate/society that a scientist believes in, the less likely they will be able to see benefits of CO2.
The scientific method, however compels the scientist to ASSUME THEY ARE WRONG and to SINCERELY and OBJECTIVELY analyze the data with the opposite position, trying to prove themselves wrong .......not always gravitating to acceptance of things that show them to be right.
In this case, the plant studies data is extremely effective at proving the law of photosynthesis and that CO2=plant food. All that's needed is an open mind and the scientific method.
Same thing with radiation physics. The authentic data/physical laws are there for the objective scientist. They just need to practice the scientific method and ignore much of the mainstream JUNK science about CO2.
STOP! Only going to places that confirm what they want to believe and also go to places that question what they think they know/believe with the mindset of learning something new.
STOP! Only searching for studies that confirm what they think they know. There are plenty of bad ones from biased scientists to reinforce whatever junk science you want to believe in.
This is almost impossible to stop because of a lifetime of doing it automatically, without thinking. I know because it impacts me too and is tough to overcome without consciously and constantly making a strong effort to try to prove yourself wrong.
However, the reward for proving yourself wrong is priceless. Not only is it a wonderful discovery and acquisition of authentic science, but from that point on……you will be processing new information that loads your brain with authentic science and rejects bad science. So it pays dividends the rest of your life!!
The toughest part is for the NON scientist. They haven't acquired the understanding to discern what's authentic and what's not. It's hard for somebody to practice the scientific method when the science sources for 2 contradicting sides have an order of magnitude more understanding and appear to be just as convincing.
That's exactly what made climate science so easy to hijack!
That last sentence is often a huge turn off for believers in the climate crisis and will turn on the subconscious defensive mechanisms because it suggests they were hoodwinked.
Nobody likes to admit that they got fooled/misled or are wrong. One a person believes in something, especially convinced of it, 10 times the information is required to get them to realize they're wrong.........and sometimes that's not enough because confirmation bias causes them to REJECT anything that contradicts what they think they know.
Mike,
1. Mike said: “Of course CO2 is plant food! There's no debate on this.”
There isn’t disagreement on this.
2. Mike said: “On the albedo of global greening absorbing more sunshine and warming the planet. I can debunk that myth quickly.”
This is what Charlie is disagreeing with me on. I don’t think he’s right. In my rebuttal, I’ll likely include some direct quotes from you along with giving you credit.
3. Mike said: “Every operational meteorologist knows to forecast lower daytime temperatures(and higher dp's) over highly vegetated areas in the growing season, which includes massive corn fields”
With higher DP’s, are summer low temps warmer? If so, what about summer average temps?
With higher DPs, are avg summer heat indices (24 hour) higher despite the lower high temps?
With higher DP’s, are summer low temps warmer? If so, what about summer average temps?
With higher DPs, are avg summer heat indices (24 hour) higher despite the lower high temps?
For sure the higher DP's mean low temps are warmer. Regardless of the reason. In this case, it's part of a positive feedback to increasing CO2. Warmer air holds more moisture. Climate models go bonkers with this H2O positive feedback with equations that amplify the warming to extremely unlikely levels.
Wet air/soils will always have less temp range than dry soils. H2O is a greenhouse gas so it RETAINS LW radiation. Without it, life on our planet would have inhabitable cold temperatures(besides the need for water for life).
The impact on easing of cold is most seen in the coldest places, where there's isn't much H2O in the air and in desserts, which causes HOTTER temps.
Very humid air in the Summer is dominated more by H2O radiation physics.
If the DP stays above 75 all night, you can bet the low won't be less than 75.
Everything the same, including the high temperature, let's say that it was 95. if the DP is 45 odds are the low temperature will be less than 75, maybe MUCH LESS than 75.
Even though daytime highs will be LESS in humid air, the added warmth at night exceeds that by a wide margin. There is no sun or SW radiation at night. This is the greenhouse gas impact from mostly water vapor preventing as much LW radiation from escaping........and CO2 having a small impact too in humid air where the absorption bands are not saturated already from H2O.
With certainty, the average Heat Indices will be higher with higher DP's............by definition. This metric adds the impact of H2O to the temperature.
This is sort of like asking if the Wind Chill temps will be lower with higher winds.
+++++++++++++++++++
The impact of CO2 on forcing is also logarithmic. So the higher that CO2 goes, the less warming each molecule has. Note on the forcing on the graph below.
Note that forcing values on the Y axis are going up linearly, while the CO2 concentrations are going up exponentially:
Why the forcing from carbon dioxide scales as the logarithm of its concentration
https://www.osti.gov/servlets/purl/1864725
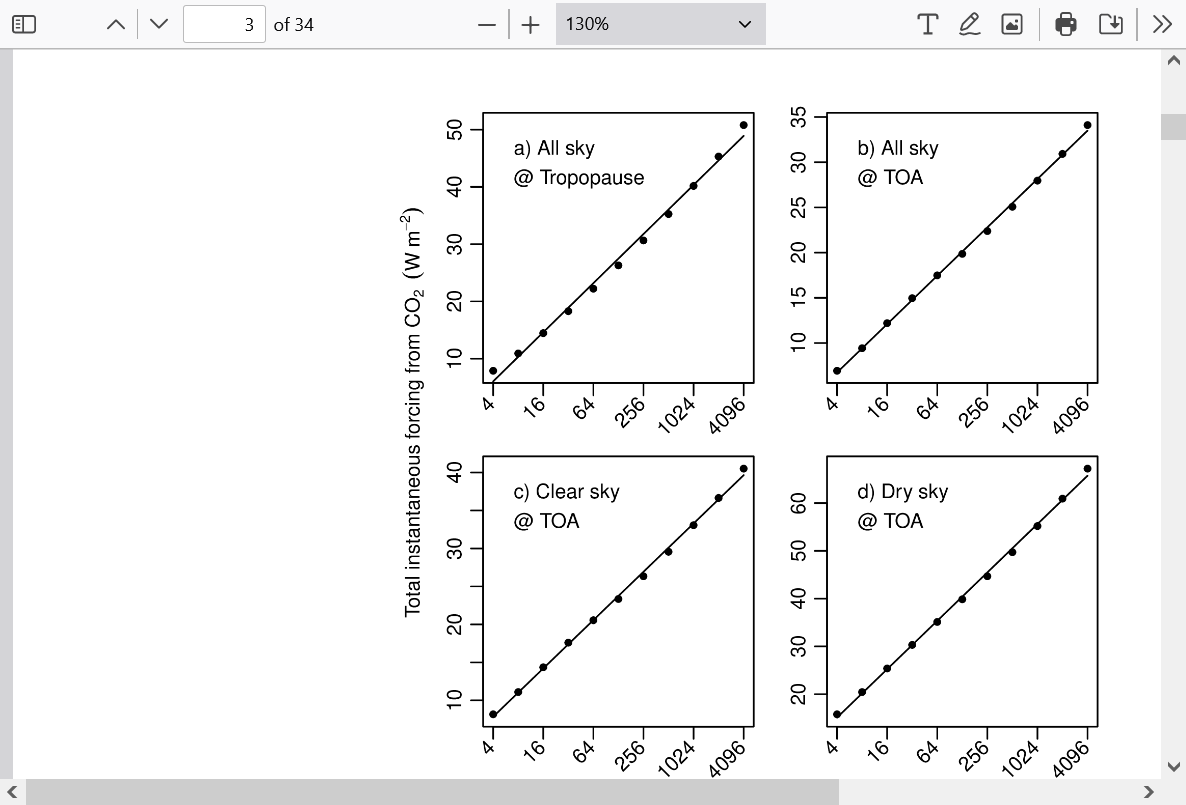
Let's say that burning fossil fuels caused an increase in atmospheric CO2 of 130 ppm. In order to get the same amount of warming, CO2 will need to increase by 260 ppm.
Climate scientists know this and so they use equations(calculus) in their global climate models that triple that amount of waning warming with the positive feedback from increasing H2O.
This leads to a "tipping point" unsubstantiated theory with runaway warming feeding on itself to some incredible amount. We KNOW this is wrong, despite there being a waning positive feedback from increasing CO2 from increasing H20 because the NEGATIVE feedbacks GROW as temps and greenhouse gases increase.
If there was such a runaway warming impact, we would have some evidence of it from the past warmings. It's been the opposite. There are increasing NEGATIVE feedbacks built into the system. Increased vegetation. Higher temps mean increased outward radiation to space. Convective cooling processes.
Cumulus clouds for instance, form at a lower level in the troposphere from rising, more humid air and as a result, they radiate from a higher temperature and LOSE more LW heat as they block more SW radiation vs higher clouds at a LOWER temperature that tend to trap more heat/radiation than any blocking of SW radiation.
+++++++++++
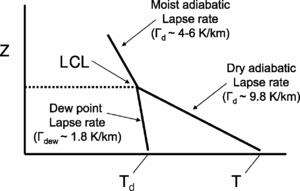
The higher the DP, the lower the LCL(lifting condensation level) will be. This is the level needed to cool rising air parcels to their dew point which results in H2O condensing out.
The lower the base of the clouds, the more SW radiation is blocked, the higher the temp of the cloud which is radiating at an increased LW radiation rate out to space.
https://en.wikipedia.org/wiki/Lifted_condensation_level
Mike said:
“The higher the DP, the lower the LCL(lifting condensation level) will be. This is the level needed to cool rising air parcels to their dew point which results in H2O condensing out.”
—————
Mike,
The lower LCL due to a higher sfc DP makes sense but I assume you agree that’s only if the sfc temp isn’t also higher by the same amount as the sfc DP (i.e., there needs to be increase in avg sfc RH to get a lower avg LCL, right?). Aren’t avg sfc temps also higher due to AGW? Or are you just talking about in places like the MW with increased vegetation, where daytime RH has risen?
This is true, Larry but as we noted DAYTIME temps in the humid areas are increasing the least.
Highly vegetated areas like the US Cornbelt have experienced Summer COOLING of daytime readings.
This is when most Summer convective storms develop from rising air and the lapse rate.
The United States Midwest growing seasons have been like an outdoor laboratory in recent decades to observe and learn from this.
The biggest contributor to this micro climate has been the tightly packed row crops(especially corn, which is twice as dense as 40 years ago and the resulting additional evapotranspiration causing a positive feedback in the water cycle and negative feedback to the daytime warming.
I've been watching this area closely for 30+ years now. Even without the confirmation from the study below, I could tell you from observations it's been going on.
Without question, DPs are much higher than they used to be during the Cornbelt growing season and daytime highs are NOT AS hot as they used to be with the exact same 500 mb heights.

++++++++++++
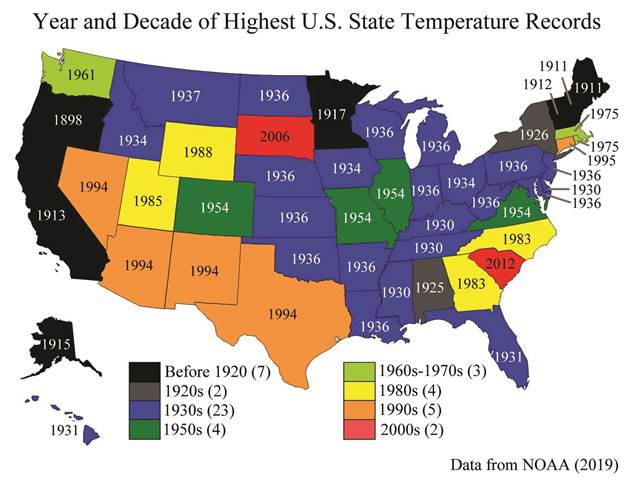
https://en.wikipedia.org/wiki/U.S._state_and_territory_temperature_extremes
The graphic below was made just before OR, WA and CO broke their records.
 |
From the EPA, Figure 3. Used to be their front page.
https://www.epa.gov/climate-indicators/climate-change-indicators-heat-waves
Image(s) #5. Heat waves and drought in the 1930s. Can we have both of these images on the same page, please. 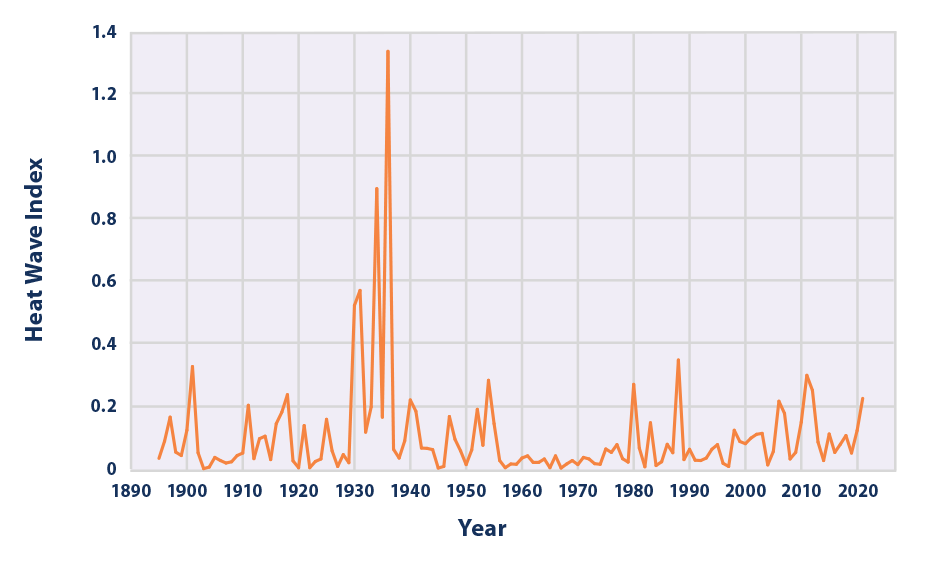 | ||
The data.........is the data??? But note the slight of hand by the EPA to change their front page to THIS data below around 6 years ago, which intentionally starts after global cooling of the 40's-50's-60's ended. The blatantly misleading impact on people using the different data starting points is profound.  |
The EPA initially disposed of the front page, starting with 1890 that they'd used for over a decade and replaced it with the graphics above. Then, there was massive blow back and legit accusations of data manipulation, so they added it back as figure 3.
Nobody can convince me that these government scientists and bureaucrats are objective and honest when it comes to climate change. They are not. This is just one especially obvious and easy to prove example.
I'm not an expert but isn't light energy used in photosynthesis?
The process of photosynthesis is commonly written as: 6CO2 + 6H2O → C6H12O6 + 6O2. This means that the reactants, six carbon dioxide molecules and six water molecules, are converted by light energy captured by chlorophyll (implied by the arrow) into a sugar molecule and six oxygen molecules, the products.
In photosynthesis, solar energy is converted to chemical energy. The chemical energy is stored in the form of glucose (sugar).
Exactly, cutworm!!

Here's a wonderful discussion on that topic:
Solar Radiation in Corn Production
Thanks, Mike!
Below is a copy of a just posted civil reply from Charlie to my last post at American that defended the idea that albedo changes, themselves, from increased greening haven’t resulted in further GW. I haven’t had a chance to read the linked paper yet. Might Charlie have a valid point about albedo? Opinion?
“I agree that albedo effects from fertilization are not.as important as CO2 radiation effects or plant evapotranspiration, which is important in the case of midwest corn. On-the-other hand, don't think Maguire has debunked albedo effects either. CO2 fertilization has a relatively small climate effect that needs to be evaluated carefully to determine if it is positive or negative.
Found a paper (link below) which isolated the biophysical effects of CO2 fertilization on climate. CO2 fertilization had a net warming due to effect mainly due to the albedo effect of the northward advance of Boreal forests. Considered separately in the paper, increased CO2 sequestration would offset the albedo effect in the short-term but not in the long-term. In any case the climate effects of CO2 fertilization are small,and the radiation effects of CO2 are dominating. Note also that increasing CO2, increases atmospheric water vapor leading to a radiation effect that is in the same ballpark as the effect of increased CO2 alone.
https://www.tandfonline.com/doi/pdf/10.1111/j.1600-0889.2006.00210.x “
Thanks, Larry!
"Found a paper (link below) which isolated the biophysical effects of CO2 fertilization on climate."
This relates exactly to what I stated earlier:
https://www.marketforum.com/forum/topic/102946/#102985
"STOP! Only searching for studies that confirm what they think they know. There are plenty of bad ones from biased scientists to reinforce whatever junk science you want to believe in.
This is almost impossible to stop because of a lifetime of doing it automatically, without thinking. I know because it impacts me too and is tough to overcome without consciously and constantly making a strong effort to try to prove yourself wrong."
I do this all the time too in order to prove points but in this case, we can use authentic science and common sense, applied with an open mind and not try to search around to get something to support what we think that we know.
So let's do that, using the equation for photosynthesis below:
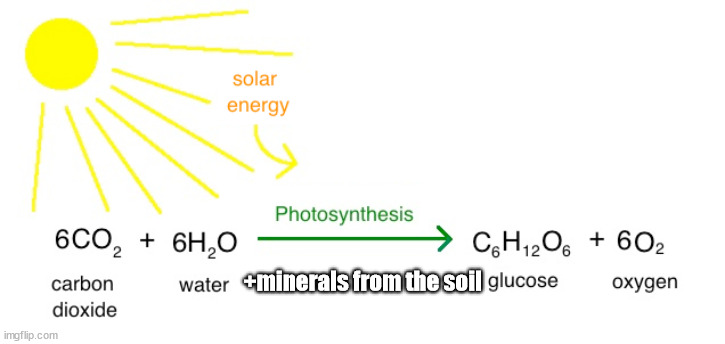
We know that if the solar energy is not being reflected and potentially lost from high albedo, it's absorbed, in this case by plants and used in photosynthesis.
We have a net gain in energy, right? Does this then mean a net gain in heat that contributes positively to global warming?
In a rapidly growing forest with trees that live for 100+ years, where does that heat go?
It's stored in the trees. It can be released if the wood from the trees is burned but that's NOT what we are discussing here. When we grow crops, the same process takes place. The absorbed solar energy is stored in the food crops and BURNED BY HUMANS FOR ENERGY which is used for metabolic and physical activity. Warm blooded creatures release heat into the environment. I don't this is the type of warming that we are talking about.
https://www.physlink.com/education/askexperts/ae420.cfm
If you think about what's actually going on with photosynthesis, it's taking heat energy out of atmosphere and sequestering it into plants. The greater the rate of photosynthesis, the more heat/radiation taken out of the system that gets sequestered into the plants.
That's actually what fossil fuels are. They are nothing more than radiation energy that originally came from the sun and got sequestered into plants, then stored for millions of years under pressure, deep in the ground which concentrated the remnants to form fossil fuels.
We read all the time that plants are sequestering carbon but they are also sequestering HEAT/SOLAR ENERGY.
Since I think that we are discussing the instantaneous heat/radiation lost or gained from photosynthesis as it happens, one can see that it clearly USES UP solar radiation/takes it OUT OF THE ATMOSPHERE and stores it.
Speculating about some future time frame when it might be released and how goes into the Outer Limits because of the myriad of possibilities and most of them don't contribute significant heat to global warming.
In fact, when we release the stored heat of photosynthesis from burning fossil fuels or trees , we don't measure the heat, we measure the EMISSIONS of CO2.
Do 8 billion humans living on the planet, all fueled by solar radiation energy captured by plants or something that ate plants release alot of body heat?
Yes.
We should also note cutworms post that stated exactly what the miracle of photosynthesis does.
It converts heat/radiation energy from the sun into chemical energy, stored in plants.
It takes heat out of the atmosphere And changes it to a new form.
I’ll have to show a diagram of different surfaces and their respective albedos When back in the office. Snow and ice are highest. If we have melting ice or subliming ice or evaporating water, then we have an additional cooling process. process.
Plants don’t reflect UV radiation back to space, like ice does but instead, they take it out of the atmosphere and convert it into STORED chemical energy. Whether it’s corn for animal feed or ethanol fuel or whether it’s wood in forests.
It’s stored solar energy that changed its form.
All FOSSIL fuels are concentrated, stored solar energy. When burned they release heat that came from the suns radiation originally. And they release the carbon dioxide that was in the atmosphere before the,plants captured it and sequestered it in the ground.
All this so called carbon pollution is just NATURAL, BENEFICIAL CO2, the building block for all life, that was once in the atmosphere being released back, after being stored in the remnants of plants for many years.
The optimal level of CO2 for most plants is double the current level in the atmosphere.
In what realm would most life prefer a doubling in the concentration of a pollutant?
Answer: In politics 2024, sold as fake climate science and fake agronomy/plant science. Convincing us that a beneficial gas, causing the current climate optimal for most life on this greening planet….is pollution.
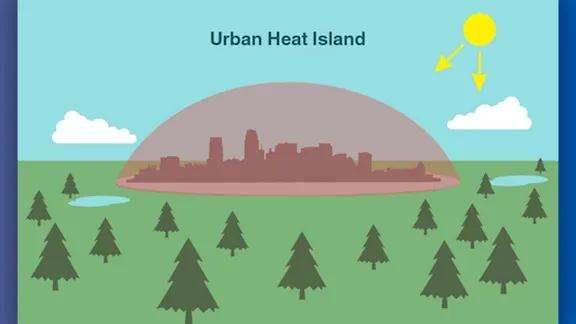
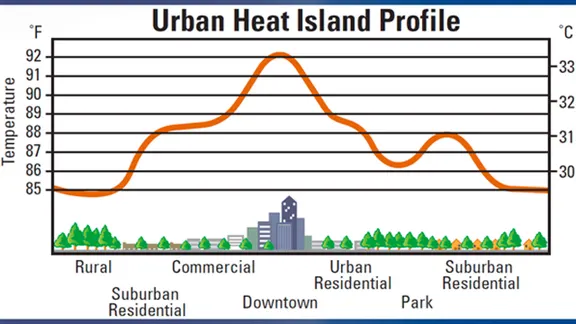
What plants do with this heat can be contrasted with what happens to the suns heat in the urban heat island effect.
I know that you guys know this but just for other readers:
The UHI effect is consequence of climate change independent of the direct impact from the increase in CO2 but solely the result of human impact on the local climate/weather/temps.
It's impact is immediate, especially after a day of powerful, high angled solar radiation being stored in man made structures in and around cities.
After the sun sets, that heat radiates out and warms the air closest to the surface above those structures.
In addition, waste heat from energy use and other activities adds a great deal to that.
https://www.foxweather.com/learn/urban-heat-islands-explained
++++++++++++++++++++++++++++
Here's an alarmist site that frequently states retarded science, using biased studies and twisted interpretation to convince itself and readers of junk science nonsense. It's an example of a place pretending to represent authentic science that anybody can go to in search of the evidence to support what they want to believe and what they think they know:
What the science says...
https://skepticalscience.com/urban-heat-island-effect.htm
The difference between ideal rural sites compared to urban sites in temperature trends has been very small:
The Urban Heat Effect has no significant influence on the record of global temperature trends.
+++++++++++++++++++++++++
Seriously? Cities aren't warming much faster than rural areas?
I'll do my version of intentionally picking out studies that state something I want to state in embellishment form, especially the title:
https://www.climatecentral.org/news/urban-heat-islands-threaten-us-health-17919
+++++++++++++
Regardless, the site Skeptical Science is the complete opposite of skeptical. They should rename the site "Cult/Junk Science"
Hey Mike,
Thanks for your posts. Due to lack of time, I’m having trouble keeping up with the back and forth and still haven’t responded back to Charlie since your last 3 posts. And now, a different poster, “TheCCer”, just replied to me with emphasis on Midwest heat indices instead of temperatures:
“Like the deniers always say, cherrypicked. Everybody knows the 1950s had a lot of hot summers.
These statements also never account for humidity. The driest July on record in Des Moines was in 1936 (see below), which is also the hottest on record. Remarkably, the average dewpoint was even lower than the very chilly July of 2009, which had the lowest mean dewpoint of any recent years!
In fact, if you look at the highest hourly heat indices on record, you will see they were mostly set just last summer. There was nothing remotely similar to the deadly combination of heat and humidity that occurred last summer during the Dust Bowl. I don't think people realize that, without widespread air conditioning, thousands of people would die each and every summer these days.
In sum, there is no evidence for milder summers in the midwest; rather, dangerous heat and humidity has been on the increase in recent decades.
Note - the 122F from 1936 appears to be erroneous. No other hourly heat index that day was anywhere near that measurement. Appears to be a spuriously high dewpoint reading. Regardless, 8 of the 24 highest hourly heat indices on record in Des Moines were established just last summer. Almost all of the record readings are from this century.”
And:
“The bottom line is this: Even if daytime maxima have decreased slightly in the Corn Belt, humidity has increased substantially moreso. So cooler temperatures should not be read as milder. There has clearly been an increase in the incidence of dangerously high heat indices.”
Hi Larry,
Is this the same guy that insists that photosynthesis, planting trees and a greening planet from increasing CO2 causes global warming or a different one?
I note the last comment from this person includes name calling "denier", referring to all people that have data he doesn't want to look at objectively.
It's a complete waste of time to have a discussion with a closed minded person like this.......that assumes they already know everything and will twist all facts to support what they think they know and ignore all facts that contradict what they think they know.
My favorite conversations are with open minded people that are capable of applying the scientific method which allows them to learn new things. A person like that can also help me to learn new things. Calling a person a denier is the quickest way to shut down civil, open minded, learning discourse.
I realize this is done so often that its an acceptable practice. Big time in politics but people practicing the authentic, scientific method would NEVER call other people with a different opinion "Deniers" or make personal attacks. It's ANTI scientific method behavior.
You didn't provide his data source, only quotes like this:
In fact, if you look at the highest hourly heat indices on record, you will see they were mostly set just last summer. There was nothing remotely similar to the deadly combination of heat and humidity that occurred last summer during the Dust Bowl.
+++++++++++
Without calling this person a name, I will just obliterate him with authentic DATA.
He is right that dew points are higher, especially in the growing seasons in the last couple of decades, mostly from the increased evapotranspiration caused by tightly packed corn plants(twice as dense as 40 years ago) which has created a man made micro-climate over the state of IA every Summer. We've had many discussions on this. It's well known and accepted by authentic science/agronomy
He is wrong about his other stuff. Again, I don't have his data source, so I'll use this credible one on the longest stretch of Heat Index's above 100 in in Des Moines.
From the article below:
"Friday is also forecast to make it above 100° for a heat index. 7 Days consecutive with a heat index of 100 or more has only happened five other times in history. Only two were longer. A stretch of 9 days in late July/early August of 1955 and the longest of 10 days in the same time frame of 1987! The most recent was a 7 day string in early July 2012."

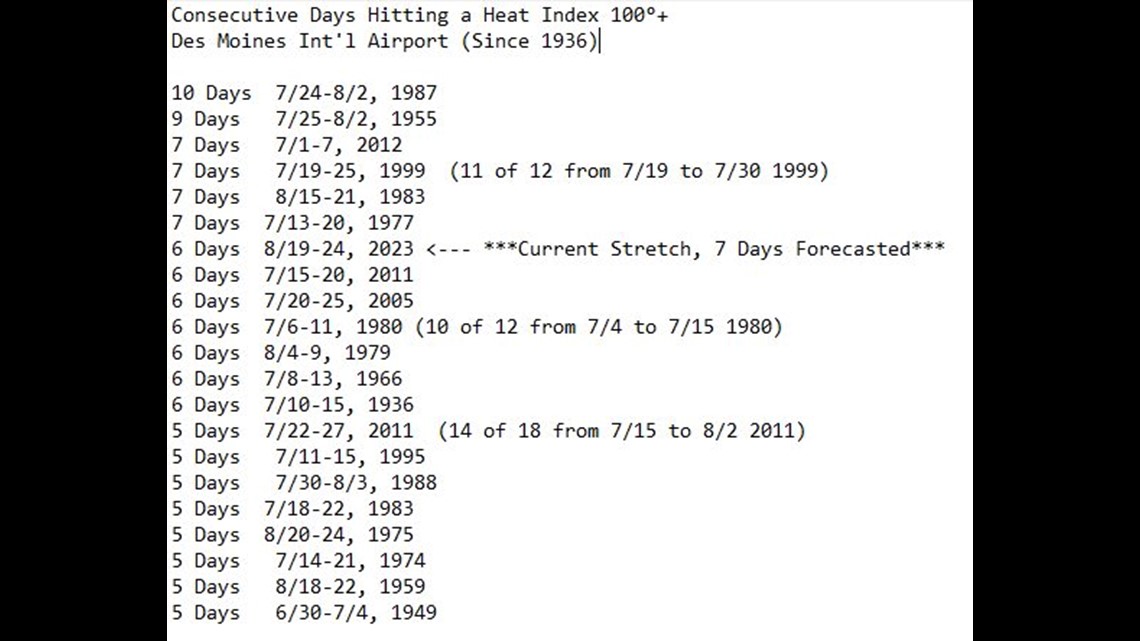
Credit: Chris Kuball
++++++++++++++++
Out of those top 21 longest stretches of a 100+ Heat Index, only 5 have occurred since 2000.
It does not go back to prior to 1936 but there were several other Dust Bowl years prior to 1936 with extreme heat in IA, as well as previous decades with extreme heat.
Decade and # of times on the list
30's-1(doesn't include the very hot years 1930-35)
40s-1
50s-2
60s-1
70s-4
80s-5
90s-2
00s-1
10s-3
20s-1
In fact, last year, 2023 getting back up there in the top 21, stopped the longest streak of NOT having a year in the top 21 highest Heat Index. (11 years from 2012-2023). This is the polar opposite of what he claims.
He insists that last Summer was worse than 1936 because the dew points were higher
Not even close.
These were temps last June/July/August, 2023 with the anomaly on the 2nd map. 4th maps are for the entire 90 days.
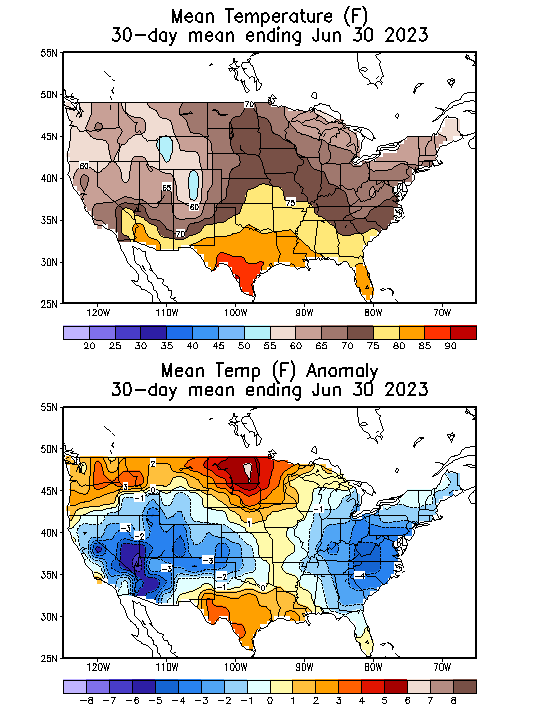
++
++++++++++++++++++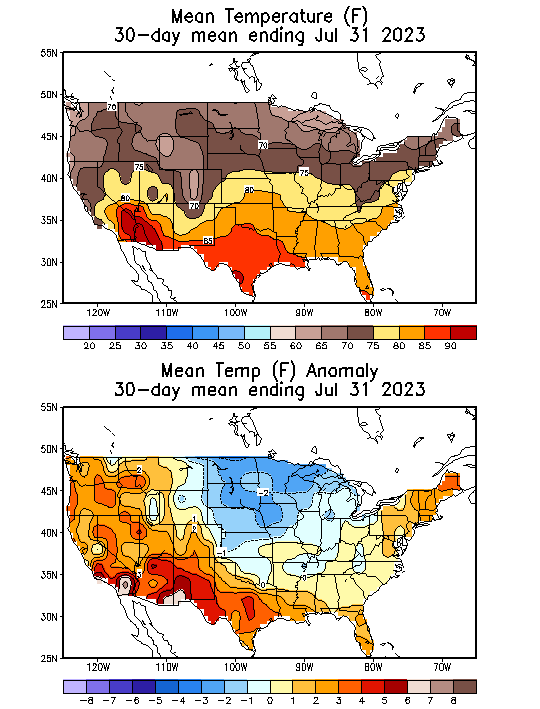 +++++++++++++++
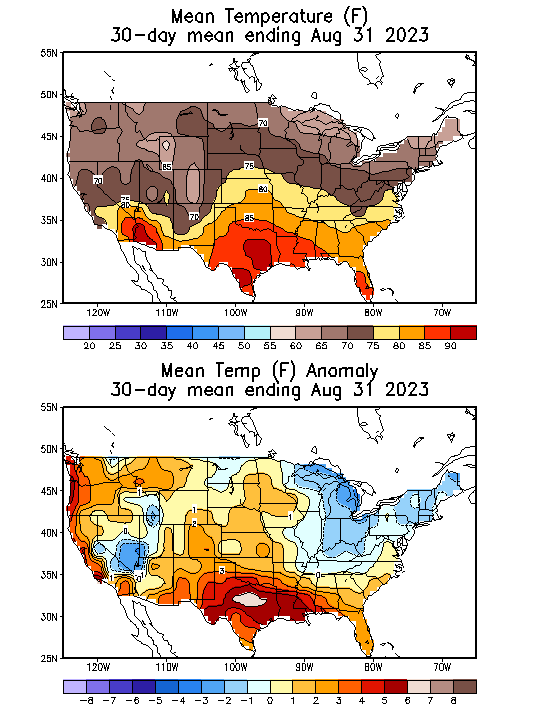 +++++++++++++++++++++
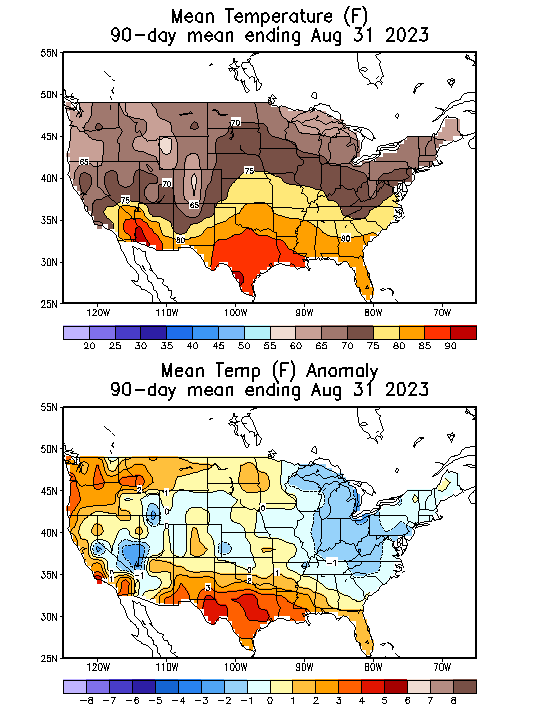
+++++++++++++++++
Now, lets compare that to the anomalies of July and August of 1936
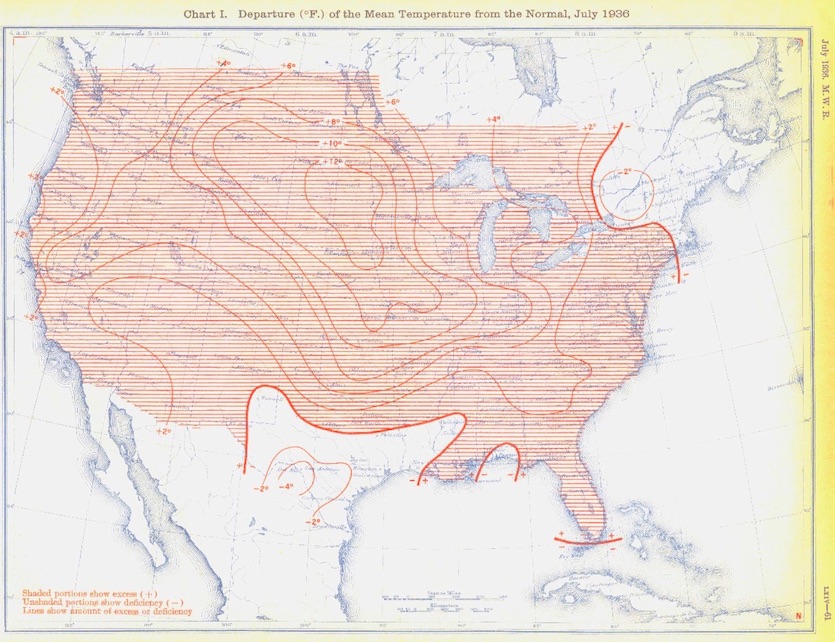
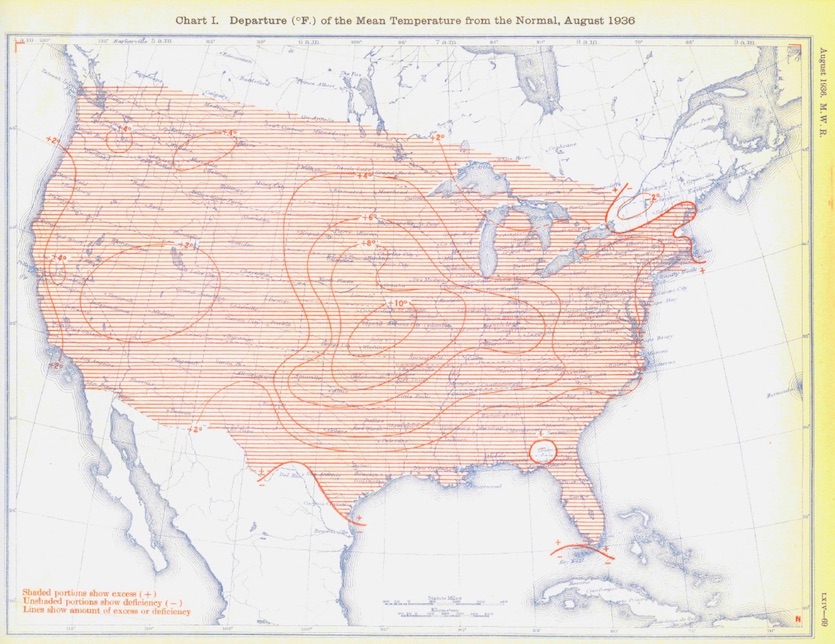
+++++++++++++++
In addition, consider the authentic data already presented earlier in this thread:
https://www.marketforum.com/forum/topic/102946/#102992
+++++++++
It's sad that people have become so completely convinced about this fake climate crisis that they react this way and sabotage their minds ability to learn authentic science, while trying to convince others of what they think they know using junk science.
This is because its NOT authentic science. It's politics, crony capitalism, corrupt science and dishonest, sensationalizing activists, especially in the media that have hijacked climate science. Like with politics, people don't use the scientific method. They use divisive opinions that often rely on selling manufactured realities based on junk science, cherry picking, exaggerating and some times just making things up.
Larry,
I could spend 24 hours a day, 365 days/year debunking/busting people like this and accomplish nothing. They have already decided what they want to believe.
I prefer to focus my time on productive measures that show authentic science and profound truths in all realms, including climate, weather, trading, politics.......everything that matters to anyone.
If somebody shows me legit data or authentic evidence that contradicts a position I will adjust it on the spot.
And I assume they MIGHT BE right from the get go, vs looking for things to prove them wrong. Or looking for a study that proves what I want to prove. I first look at what evidence they are using and test that evidence.
This is what led me to this evidence.........using what this past comment stated about the Heat Index in IA. I used THEIR EVIDENCE about THEIR POINT, not mine from the get go.
Mike asked:
“Is this the same guy that insists that photosynthesis, planting trees and a greening planet from increasing CO2 causes global warming or a different one?”
Hey Mike,
No, the other guy who I had been debating is named Charlie. I still haven’t replied to his latest because of falling behind/too much other stuff like taxes keeping me occupied. He’s been civilly mainly suggesting reduced albedo resulting from increased greening.
This newest stuff that I posted earlier today is from “TheClimateChanger.” I don’t consider him to be outrightly overly uncivil, but he seems to me to be more close minded. I don’t think I could get him to be more open-minded about negative feedbacks from increased vegetation. He today emphasized that even if there’s been slight cooling in the MW that HIs have still increased and are a bigger deal.
There’s a tiny bit of hope for Charlie but only tiny. He’s also seemingly already mostly made up his mind.
Keep in mind that I’m not even debating the existence of AGW fueled CC. And I’m not saying AGW is good. All I’m doing is looking at what I feel are some positive effects from increased CO2 all the while still acknowledging the many more bad aspects of it. I’m only trying to take a slight middle of the road stance. But it is hard for that to get even mild support. Getting strong support is hard to get unless one is on one extreme or the other.
They seem to be arguing against the idea of increased greening leading to localized cooling and the idea of that being worthwhile to mention as a potentially significant negative feedback against GW. Plus there’s the increased food supply even if it isn’t a longterm negative feedback. Charlie hasn’t outrightly refuted that yet. He’s concentrating on his idea of reduced albedo from greening.
*Edit: A 3rd poster bdgwx just said this:
“Yeah. If you look at enthalpy metrics like equivalent potential temperature (theta-e) you'll see that heat (including latent) actually increased in the corn belt.”
Thanks, Larry!
People reading the biased science sources become convinced...........then only go to sources that reinforce what they think they know and what they want to believe(which usually lines up with their confirmation bias telling them what to believe and not believe). They twist everything to line up with what they want to believe.
This is not you, Larry!
I go overboard sometimes in showing one side to emphatically bust junk science and bad data/evidence which gives a false impression that my views don't also agree with that side on SOME elements of climate science.
If a person reads only those posts, they might not appreciate my view that global warming is real. We have basically super imposed 2 deg. F of warming on the planet, more so in the coldest places during the coldest times of year.
This has increased extreme rain events from an atmosphere that can hold 7% more moisture. Heat waves can be 2 deg. F hotter and last longer. Hurricanes can strengthen faster under the right conditions and cause heavier rains.
Oceans are rising at a rate of just over 1 inch/decade with the rate increasing slightly with time.
The VAST majority of life on this greening planet considers this a climate OPTIMUM. Its ludicrous to call it a climate crisis FOR LIFE on the planet with the optimal level of CO2 being double this.
Separating out JUST HUMANS, one can make a better case for it to be a bad thing but still not a crisis by any means.
The only reason for this is that so many HUMANS have built properties along ocean coast lines, so the fate of hurricanes and seas levels are weighted much more with humanity than most life.
Hey Mike,
I just replied to TheCCer with the data you provided on Des Moines longest 100+ F heat indices:
Thanks, Larry!
Now that I've seen his actual data, I can comment. I'll copy it here:
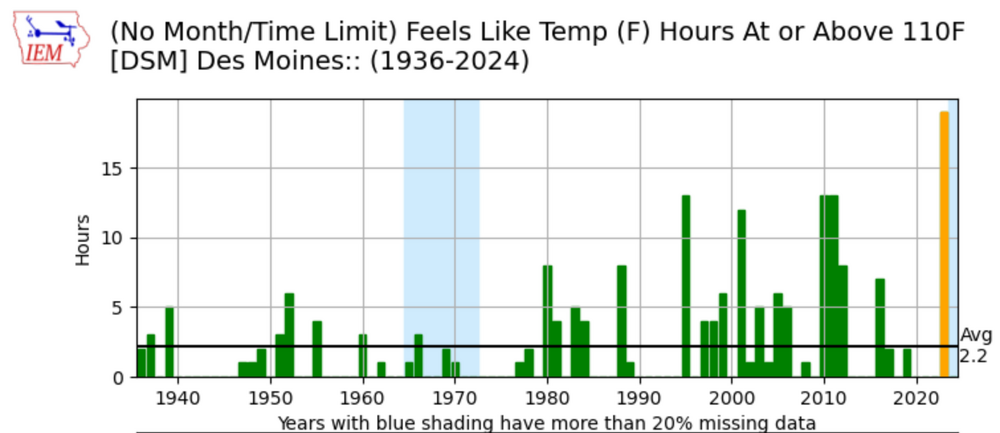
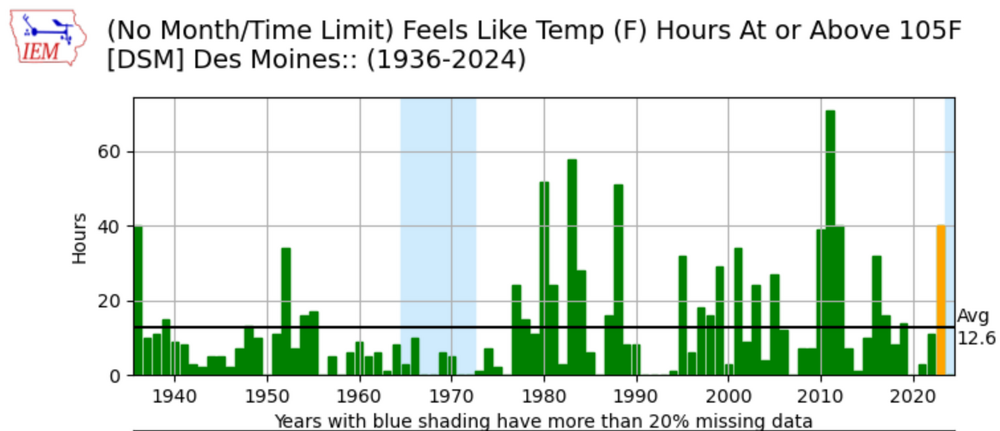
1. The first graph shows 2023 spiked above a 110. Deg F heat index for less than 20 hours during the entire year. The 2nd graph shows 2023 spiked above 105 Deg. F for less than 48 hours during the entire year. Even if those were consecutive hours, they don't even qualify as 1 heat wave!
https://www.ncbi.nlm.nih.gov/pmc/articles/PMC3040608/
"Heat waves were defined as ≥ 2 days with temperature ≥ 95th percentile for the community for 1 May through 30 September."
++++++++++++++++++++++++++++++
I showed the authentic data on actual heat waves here, which contradicts the aberrant, 1 time brief spike higher in 2023:
https://www.marketforum.com/forum/topic/102946/#102992
2. This can’t be repeated enough and applies to all the other similar extreme weather situations the last 2 decades of people cherry picking extremes to blame on climate change.
Cliff Mass can be counted on as an elite source for using objective, authentic science:
https://cliffmass.blogspot.com/2016/03/the-golden-rule-of-climate-extremes.html
The GoldenRule
“Considering the substantial confusion in the media about this critical issue, let me provide the GOLDENRULE OF CLIMATE EXTREMES”
Here it is:
“The more extreme a climate or weather record is, the greater the contribution of natural variability.”
“Or to put it a different way, the larger or more unusual an extreme, the higher proportion of the extreme is due to natural variability.”
3. The massively flawed attempt to show 2023 as an example of how climate change is causing more dangerous Heat Index values using 105 Degrees, fails badly, not just because the period is short of a legit heat wave(less than 48 hours) but the trend is DOWN since the 1980's, which is the main period with the most amount of global warming(1980-2024). After the 2012 spike higher from natural variation, Des Moines went thru an 11 year period with the lowest hours/year of having a 105+ Heat Index since prior to 1980.(2012-2023)
So we are supposed to believe that 40 hours of time in 2023 defines climate..........but not 10+years(2012-2022)? Or 42+ years(1980-2022)?
This is cherry picking on steroids!
The authentic data on heat waves actually shows the complete opposite of the flawed attempt to show climate change causing more dangerous heat and humidity in Des Moines, IA.
+++++++++++++
Larry,
When somebody tries to use a junk science, cherry picking trick like this and continues to insist that its a meaningful metric for proving something that was the complete opposite of what they show in that realm, it obliterates their credibility as representing anything resembling objective and anything resembling using authentic science.
This is very powerful evidence of the mindset that I described previously:
https://www.marketforum.com/forum/topic/102946/#103062
https://www.marketforum.com/forum/topic/102946/#103063
There is no way to teach somebody like this anything. They will only look at creative ways to spin data so that it matches with what they want to believe and when it doesn't, they completely reject it. I've personally dealt with many thousands of others like this the past decade. It is NOT unusual. In many ways, it DEFINES the cognitive/confirmation bias for most humans(although this is an EXTREME example of it).
It's taking place in the minds of tens of millions regarding politics every day in America and getting worse every day. Sadly, it's come to define the mentality of millions about the fake climate crisis which no longer resembles science anymore.
https://www.azquotes.com/author/30824-Richard_Lindzen
https://en.wikipedia.org/wiki/Richard_Lindzen
Lindzen has published papers on Hadley circulation, monsoon meteorology, planetary atmospheres, hydrodynamic instability, mid-latitude weather, global heat transport, the water cycle, ice ages and seasonal atmospheric effects. His main contribution to the academic literature on anthropogenic climate change is his proposal of the iris hypothesis in 2001, with co-authors Ming-Dah Chou and Arthur Y. Hou.[8][9]
Lindzen is a member of the National Academy of Sciences and the Science, Health, and Economic Advisory Council at the Annapolis Center for Science-Based Public Policy. He joined MIT in 1983, prior to which he held positions at the University of Washington (1964–65), the Institute for Theoretical Meteorology at the University of Copenhagen, the University of Oslo (1965–67), the National Center for Atmospheric Research (NCAR) (1966–67), and the University of Chicago (1968–72). From 1972 to 1982, he served as the Gordon McKay Professor of Dynamic Meteorology at Harvard University. Lindzen also briefly held a position of visiting lecturer at UCLA in 1967.[10]
As of January 2010, his publications list included 230 papers and articles published between 1965 and 2008, with five in process for 2009. He is the author of a standard textbook on atmospheric dynamics, and co-authored the monograph Atmospheric Tides with Sydney Chapman.[11]
He was Alfred P. Sloan Professor of Meteorology at MIT from 1983,[1] until his retirement which was reported in the Spring 2013 newsletter of MIT's Department of Earth, Atmospheric and Planetary Sciences (EAPS).[2] On December 27, 2013, the Cato Institute announced his appointment as a Distinguished Senior Fellow in its Center for the Study of Science.[12]
Hey Mike,
1. From your source:
“We identified heat waves as ≥ 2 consecutive days with daily mean temperature (Tmean) higher than the community’s 95th percentile warm season Tmean (for 1987–2005)”
Then you said: “The first graph shows 2023 spiked above a 110. Deg F heat index for less than 20 hours during the entire year. The 2nd graph shows 2023 spiked above 105 Deg. F for less than 48 hours during the entire year. Even if those were consecutive hours, they don't even qualify as 1 heat wave!”
I think you’re comparing apples to oranges. Why? Because # days with daily mean temps >95th percentile and hours spiking above a certain HI are very different things. I would find it very hard to believe that 2023 didn’t have a heatwave based on the definition from your source.
2. You said: “In fact, last year, 2023 getting back up there in the top 21, stopped the longest streak of NOT having a year in the top 21 highest Heat Index. (11 years from 2012-2023).”
TheCCer pointed out an error. The longest streak is actually the 13 years of 1936-49. 2012-23 was close but no gar.
"Then you said: “The first graph shows 2023 spiked above a 110. Deg F heat index for less than 20 hours during the entire year. The 2nd graph shows 2023 spiked above 105 Deg. F for less than 48 hours during the entire year. Even if those were consecutive hours, they don't even qualify as 1 heat wave!”
I think you’re comparing apples to oranges. Why? Because # days with daily mean temps >95th percentile and hours spiking above a certain HI are very different things. I would find it very hard to believe that 2023 didn’t have a heatwave based on the definition from your source."
Seriously, Larry???
Now you're going to make up your own definition of what a heat wave is so that it matches with what you want to believe?
I searched and intentionally used the SHORTEST time frame of any entity that I could find for qualifying a heat wave. 2 days or more.
Are you not capable of looking things up?? Of course you are.
Let me help you out with credible sources using time frames:
https://en.wikipedia.org/wiki/Heat_wave
There are several definitions of heat waves:
At the most, if you want to round off this period to 2 days, it's the shortest duration heat wave that any source any where would call a heat wave.
A 40 hour period with a 105+ Heat Index during a Summer that lasted 15,456 hours is climate but not natural variation? Or even more absurd 19 hours at 110+ Heat Index.......less than 1 day out of 92 days in the Summer of 2023.
And the 44 years of weather before then, 680,064 hours don't matter because we had the 40 hours spiking to a high Heat Index in 2023 which should define climate, not the previous 680,064 hours?
++++++++++++++
TheCCer pointed out an error. The longest streak is actually the 13 years of 1936-49.
Appreciate the correction, so let me adjust that.
It was the 2nd longest stretch since records were kept of NOT having an incidence of a top 21 ranked stretch of Heat Index days of 100+ and the longest stretch since 1949. So how much meaning/significance did that change?
Your response proves EXACTLY what my analysis was here:
https://www.marketforum.com/forum/topic/102946/#103070
There is no way to teach somebody like this anything. They will only look at creative ways to spin data so that it matches with what they want to believe and when it doesn't, they completely reject it. I've personally dealt with many thousands of others like this the past decade. It is NOT unusual. In many ways, it DEFINES the cognitive/confirmation bias for most humans(although this is an EXTREME example of it).
+++++++++++++++
The absurdity of where this conversation has gone proves it. I agree 100% that heat waves on most of the planet have increased. Not a shred of doubt.
However, they have decreased in the Midwest. I proved it in every way, shape and form(using almost everybody's standard for what a heat wave is). I've been an operational meteorologist forecasting the weather EVERY DAY for this region for over 4 decades.
In the last 3 decades, I've followed the weather in IA for almost every hour of every day during the Summer as a corn and soybean trader using weather. Heat waves are LESS frequent and LESS intense in the Midwest than they used to be....even including the humidity and Heat Index. Not a shred of doubt.
Added: A 19 hour spike to 110+ heat index is NOT a heat wave, nor is it climate. It's a natural variation spike higher, from unusual weather conditions(and corn transpiration) that all came together briefly(sure, the increase in CO2 did have a tiny contribution and maybe it would have only been a Heat Index of 106 without it). Climate is defined as the weather over a 30 year period. If we were having spikes higher like this FOR LONGER PERIODS OF TIME, measured in days but not hours that are less than a day in 30 years, then it counts...........but just 1 time this high? NOT climate! Heat Index values of 100+ DO happen with enough frequency and length of time to be considered as climate. That's why almost everybody else uses that metric for heat waves in IA.
One reason for the time frame to be 2+ days is that Heat Index spikes to 110+ are not like tornadoes, or wind or rainfall where the magnitude of the intensity/spike higher is everything. You need SUSTAINED heat and humidity over the course of 2+ days for it to become impactful. You can't pick your significant threshold as 110+ degrees when it fails to meet the time standard for heat waves, then claim it meets the 100+ standard. OK, then use 100+ Heat Index and acknowledge that 110+ is the wrong standard and there's only 1 reason that 110+ is significant..........because it happened in 2023 and this poster is applying the cherry pick standard of blaming every extreme from natural variation on climate change.
++++++++++++++++++++++++
You can't find authentic data (maybe more nonsense) to show anything different because its a rock solid fact.
Battling me with BS to fight acknowledging the authentic science and pretending to not understand my data or having your brain disabled by confirmation bias is just proof of what I summarized above.
I don't remember all of the many hundreds to 1 thousand+ of cherry picks but this one is right near the top!
If you really wanted to learn something, you'd stop wasting time fighting completely settled science and look at the reasons for WHY THE MIDWEST has had cooling Summers the last several decades.
Hanging out with know it alls that insist that photosynthesis increases global warming and who look for studies/papers to confirm what they want to believe/think they know, instead of having the ability to objectively apply authentic data USING THE SCIENTIFIC METHOD will make it that much harder.
Your forum pal that calls people like me deniers, because I have the authentic science with rock solid proof, should stop wasting time calling names and vilifying and instead, open his mind to make room for more authentic science/agronomy principles to replace the preconceived assumptions using bad/junk science.
The higher dew points in the Midwest Summers are mostly NOT from the increase in CO2. They are mostly the result of corn plants in tightly packed rows almost twice as dense as 4+ decades ago. It's the evapotranspiration from the corn plants causing the higher DPs, along with irrigation.
This is also what has substantially lowered daytime extreme heat and INCREASED rainfall. Completely independent of anything to do with with the climate change being caused by increasing CO2.
The Midwest has been like an outdoor laboratory. A man made micro climate exists there from May-September of every year.
Do you want to learn new things from the objective data?
Please Join me in doing that.
Mike said: “Now you're going to make up your own definition of what a heat wave is so that it matches with what you want to believe?”
——————-
Hey Mike,
I’m not making up a heatwave definition. Rather, I’m merely thinking that Des Moines likely reached the heatwave criteria in Aug 2023 per your source’s definition:
Heat waves were defined as ≥ 2 days with temperature ≥ 95th percentile for the community for 1 May through 30 September.
I’m going to reassess. Please give me time to reassess this and analyze it in detail.
Also, that was said to you not at all because I “want to believe” that. I’m not trying to join a team/take a side. Or better yet, I like to think I’m on the not black and white team. I generally think AGW is more bad than good probably influenced by slowly rising sea levels, but unlike those folks I’m not shying away from saying I think some aspects are good. One sided folks will tend to only list either the good or the bad. More later when I have time. I promise! I’m going to rehash this as well as look at these two definitions you just listed:
Maybe I’ll determine I was wrong in saying they likely reached heatwave criteria. Please, I beg you to let me reevaluate. Thanks in advance.
PS I never felt I was a good “team player” in debates. That’s because I value thinking for myself too much over trying to please others on a particular team as a primary motive. Also, I have a pet peeve against being a party hack in politics where the party thinks for a person more than their own brain. Related to this, I have a pet peeve over doing or buying something only because it is “in” as opposed to genuinely enjoying it.
Thanks, Larry! I look forward to it.
1 item to point out with regards to the 2023 heat wave and heat waves.
I realize my response might have been confusing. It absolutely WAS a legit heat wave by all standards with 7 days of 100+ Heat Index.
My point is that using the standard of 105+ Heat Index and 110+ Heat Index is a greatly flawed standard because there are so few hours in the year(less than the time frame needed to be a heat wave) and in fact, so few hours in the decade.
If 110+ Heat Index was used as the metric for heat waves, for instance then there hasn't even been 1 full day of a heat wave in history yet for Des Moines IA.
The length of time matters as well as the magnitude of the threshold.
With this person wanting to cherry pick his threshold as being 110+ because 2023 spiked to a new record for 110+ heat index hours, he takes a stand on THAT value as being significant and NOT the 100+ heat index which me and others use for heat waves in that part of the world.
You can't have your cake and eat it too on this.
In other words you can't claim that 2023 was a 7 day heat wave based on 100+ Heat Index but HIDE the stats on all the other 100+ Heat Index heat waves and ONLY show the stats for 110+ and 105+ Heat Index occurrences and only use those to judge 2023 by.
That is cherry picking to the most extreme extent.
Also, I'm not suggesting picking forums or friends or sources. Even on this, you have a right to decide what YOU want to believe.
 O
O
............Or Science
https://www.marketforum.com/forum/topic/102946/#103074
Added: A 19 hour spike to 110+ heat index is NOT a heat wave, nor is it climate. It's a natural variation spike higher, from unusual weather conditions(and corn transpiration) that all came together briefly(sure, the increase in CO2 did have a tiny contribution and maybe it would have only been a Heat Index of 106 without it). Climate is defined as the weather over a 30 year period. If we were having spikes higher like this FOR LONGER PERIODS OF TIME (measured in days) or 19 hour really high spike several times every year, for numerous years, then it counts as climate...........but just 1 time this high?
NOT climate! just the opposite of how we define climate.
Heat Index values of 100+ DO happen with enough frequency and length of time to be considered as climate. That's why almost everybody else uses that metric for heat waves in IA.
One reason for the time frame to be 2+ days is that Heat Index spikes to 110+ are not like tornadoes, or wind or rainfall where the magnitude of the intensity/spike higher is everything. You need SUSTAINED heat and humidity over the course of 2+ days for it to become impactful. You can't pick your significant threshold as 110+ degrees when it fails to meet the time standard for heat waves, then claim it meets the 100+ standard. OK, then use 100+ Heat Index and acknowledge that 110+ is the wrong standard.
there's only 1 reason that 110+ is significant..........because it happened in 2023 and this poster is cherry picking, looking for extremes from natural variation to blame on climate change.
1. Many of us that are science savvy (metmike is an atmospheric scientist) have to ask ourselves if we want to be part of the corrupted climate science problem?
2. Or whether we want to be part of the solution. Fighting against bad/junk science and related realms? Speaking out to expose the blatant corruption. Providing the truth via authentic science.
3. Or whether we want to do nothing and say nothing. Pretend that there really isn't a big problem. Just some misguided elites getting carried away with exaggeration. A bunch of people that mean well. Their actions won't hurt anything or anybody!
Wanna bet??
Big Oil SAVES Lives!
Started by metmike - April 11, 2024, 3:15 p.m.
Mike said,
“I realize my response might have been confusing. It absolutely WAS a legit heat wave by all standards with 7 days of 100+ Heat Index.”
Ok, then there really is no debate on whether or not Des Moines in Aug of 2023 had a heat wave. I misunderstood you.
Thanks, Larry,
My fault on that.
I read over my post related to that and realized I ws saying it wasn’t a heat wave when it was.
I badly communicated that 105 and 110 were not heat waves based on them failing to last 2+ Days long but should have also made it clear that 7 days of 100+ is a MAJOR heat wave For the same event.
The reality too is that 19 hours at 110 heat index is nothing compared to 7 days of 100+ heat index. Which is why one of them is NOT a heat wave and the other one is.
Amazing how much time Ive spend on this :-)