Science corruption
19 responses |
Started by metmike - March 20, 2023, 5:50 p.m.
https://www.marketforum.com/forum/topic/93926/
+++++++++++++++++++
Amsterdam, 9 May 2023
* IPCC hides good news about disaster losses and climate-related deaths
* IPCC wrongly claimed the estimate of climate sensitivity is above 2.5°C; it is more likely below 2°C
* IPCC misleads policy makers by focusing on an implausible worst-case emissions scenario
* Errors in the AR6 report are worse than those that led to the IAC Review in 2010

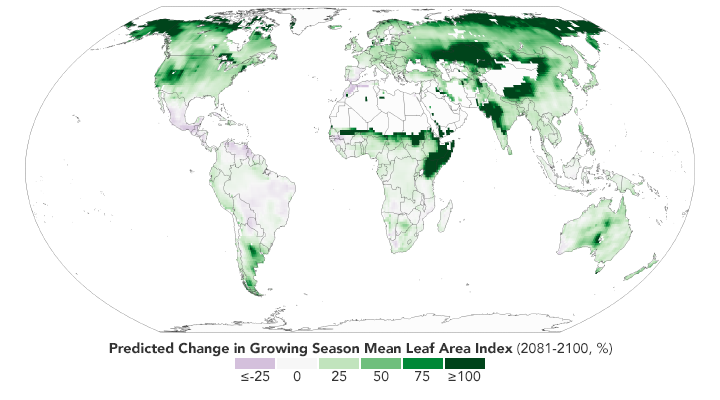
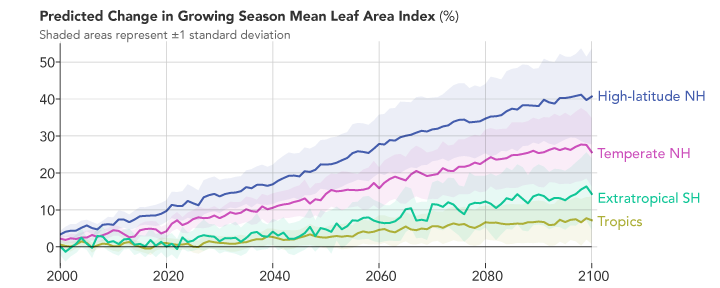
metmike: Look at the graph above and point out where the so called climate crisis is reducing global food production, which they have been insisting on for the last couple of decades.
It's their response to the fake climate crisis that will reduce food production and do all the damage, since fossil fuels are greening the planet and massively increasing crop yields.
Death by Greening:
https://www.marketforum.com/forum/topic/69258/
++++++++++++++++++++
Mike Maguire
May 12, 2023 1:11 pm
Another secret about fossil fuels–The Haber-Bosch Process
https://www.marketforum.com/forum/topic/39215/
“Referred to by some as the most important technological advance of the 20th century….Between 3 and 5 percent of the world’s annual natural gas production – roughly 1 to 2 percent of the world’s annual energy supply – is converted using the process to produce more than 500 million tons of nitrogen fertilizer, which is believed to sustain about 40 percent of the world’s 7 billion people. Approximately half of the protein in today’s humans originated with nitrogen fixed through the Haber-Bosch process”

Reply to Mike Maguire
May 12, 2023 1:14 pm
A brief history of U.S.corn yield growth since the 1860s Notable growth in yields was seen after the adoption of modern fertilizers in the 1940s, which made drought years esp. in the 1980s stand out more than before (compare with 1930s Dust Bowl for example).

Spring WH bear reports
Andrew Derocher and his team of students from University of Alberta have been monitoring WH polar bears for years. They go out every spring, in April, to tag and collar bears. Derocher communicates almost exclusively via Twitter, so there is seldom anything more than brief snippets of information provided. Links below to his original tweets:
Spring 2023 – bears reported in good condition
Spring 2022 – bears reported in good condition
Spring 2021 – no field work but a population survey was done that fall
Spring 2020 – no field work but a number of bears left the ice as late as the 1980s, in mid-to-late August
Spring 2019 – bears reported in good condition and left the ice in August, as late as 1980s
Susan Crockford
This is an early breakup year for Hudson Bay but sea ice loss has not been accelerating. While some Western Hudson Bay bears have been on land for weeks, others are still out on melting remnants of sea ice, much of it invisible to satellites. This is only the third year since 2014 that the bay has had less than usual amounts of ice, which means most years since then have had normal or nearly normal ice coverage, similar to the 1980s. Hardly the ever-worsening catastrophe of sea ice loss story being spun in the media for Western Hudson Bay polar bears.
https://wattsupwiththat.com/2023/07/15/untold-story-of-climates-holocene-gift-to-humanity/
Mike Maguire
July 15, 2023 3:01 pm
We’re repeating warmth similar to the previous warmings that, before climate science was hijacked were known as climate OPTIMUMS for life that flourished because of them.
Medieval Warm Period~1,000 years ago
Roman Warm Period~2,000 years ago
Minoan Warm Period.~3,500 years ago
However, we have a ways to go in order to warm the higher latitudes of the Northern Hemisphere up to Holocene Climate OPTIMUM temperatures between 9,000-5,000 years ago.
https://en.wikipedia.org/wiki/Holocene_climatic_optimum
“Of 140 sites across the western Arctic, there is clear evidence for conditions that were warmer than now at 120 sites. At 16 sites for which quantitative estimates have been obtained, local temperatures were on average 1.6±0.8 °C higher during the optimum than now. Northwestern North America reached peak warmth first, from 11,000 to 9,000 years ago, but the Laurentide Ice Sheet still chilled eastern Canada. Northeastern North America experienced peak warming 4,000 years later. Along the Arctic Coastal Plain in Alaska, there are indications of summer temperatures 2–3 °C warmer than now.[9] Research indicates that the Arctic had less sea ice than now.[10]“
Study: Cold kills 20 times more people than heat
https://www.usatoday.com/story/weather/2015/05/20/cold-weather-deaths/27657269/
+++++++++++++
Mike Maguire
Reply to bnice2000
July 15, 2023 11:00 pm
Humans have done tremendous environmental damage to the planet and are gobbling up natural resources at an unsustainable rate.
However, the best thing we’ve ever done is gift the planet massive amounts of the beneficial gas, CO2.
Rescuing life from dangerously low amounts of CO2.
There are many dozens of pollutants which humans are responsible for and need to limit.
However, CO2 is still only half of the optimal level. Most plants do best when CO2 is enriched to around 900 parts per million.
If we want to discuss the negatives with greenhouse gas warming of 1 Deg. C and the potential increase of 7% in atmospheric moisture,, meaning that heat waves are a tiny bit hotter and some rain events, 7% wetter……….why ignore the massive benefits of CO2 on our greening planet which greatly outweigh those negatives?
Answer: Because it’s not objective science. It’s biased politics.
This would be like calling H2O pollution.Only telling us that it causes numerous drowning deaths every year. Property damage from flooding. It’s 95% of the greenhouse warming effect.
Never mind that life would not exist on earth without it and the many positives associated with water.
'Hottest Days’ Manipulation?
https://wattsupwiththat.com/2023/07/16/hottest-days-manipulation/
Mike Maguire
July 16, 2023 10:40 am
Climate science has been hijacked and is hopelessly corrupted.
Every Summer, especially in July, the hottest month in the N. Hemisphere, all the places with above average temperatures become the reporting locations for daily, alarmist climate crisis propaganda.
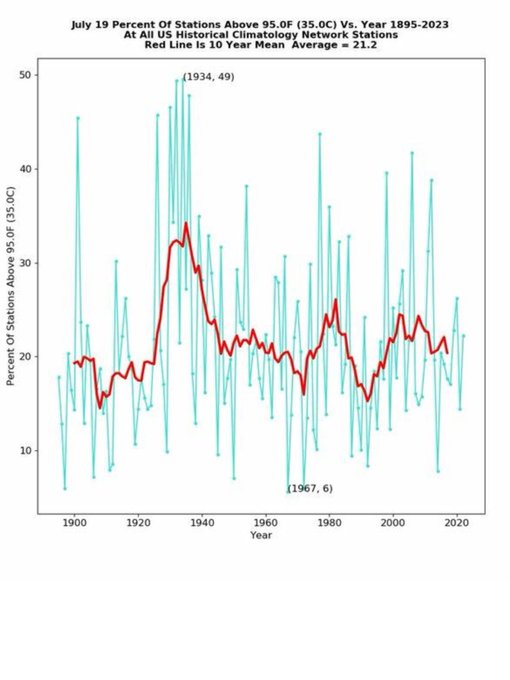
As if we never had record highs in July before the climate crisis. The decade of the 1930’s in the US makes this heat look like a picnic.
Almost half of the hottest state temperature records, that still stand were set in the 1930’s. 23 states.
https://en.wikipedia.org/wiki/U.S._state_and_territory_temperature_extremes
From 1876-1878, the world lost 50,000,000 people, 3% of the population from a REAL climate crisis!
Causes of the Great Famine, One of the Deadliest Environmental Disasters
https://news.climate.columbia.edu/2017/12/15/causes-great-famine-drought/
Climate science, by an extremely wide margin, is the most corrupted scientific field but isn’t alone:
Summary and discussion of: “Why Most Published Research
Findings Are False”
Statistics Journal Club,
https://www.stat.cmu.edu/~ryantibs/journalclub/ioannidis.pdf

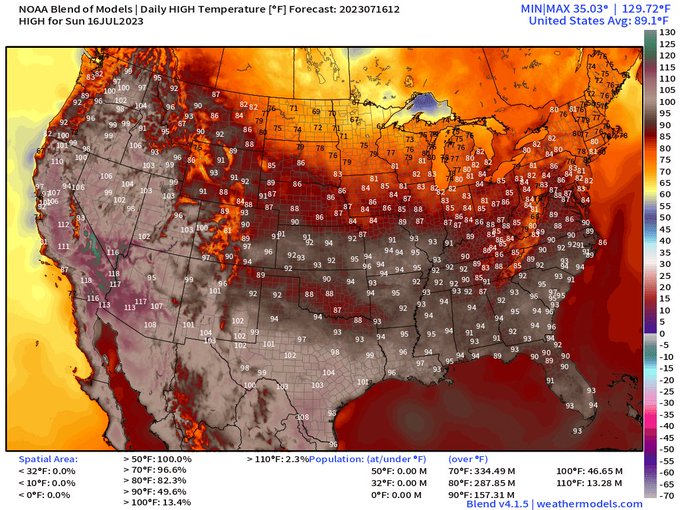
https://wattsupwiththat.com/2023/07/17/ryan-maue-puts-yesterdays-us-extreme-heat-in-context/
Extreme heat warnings stretch from California to Miami with temperatures nearing 130°F in the hottest spots. In terms of historical context, this might be the hottest day across the U.S. since last year. Unvelievably hot 89.1°F national average high temperature. 157 Million or almost half of U.S. population to see 90°F level heat.
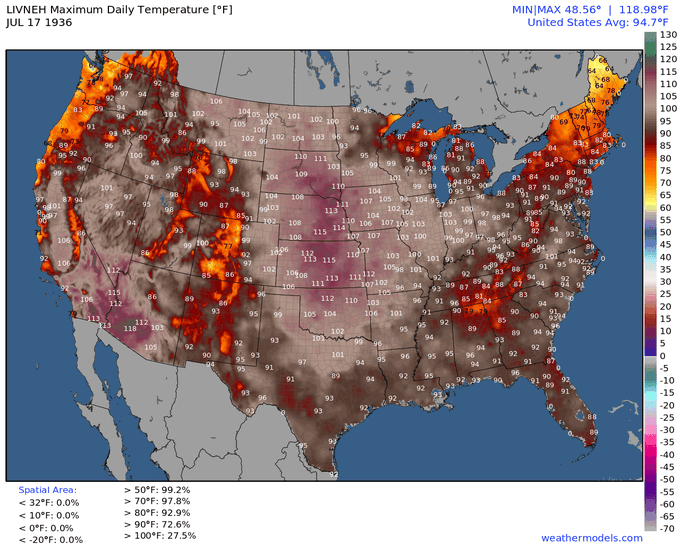
Some have asked about 1936. Here's the map for July 16, 1936. It was 5°F hotter on average across 48 states, but that was due to Dust Bowl. The heat now is caused by climate change, which is different and more dangerous. So, don't get hung up on the numbers. 27.3% area was 100°F+ or two times today's value of 13.4%
+++++++++++++++++++++
Mike Maguire
July 17, 2023 6:29 pm
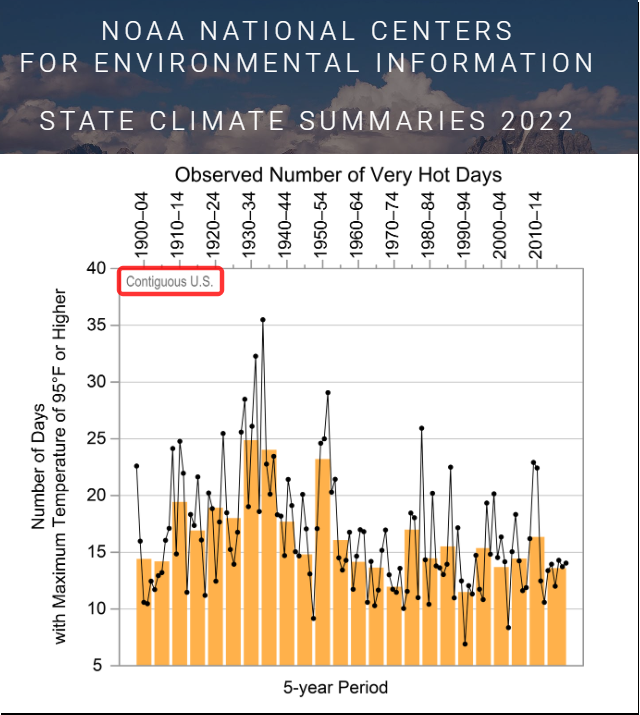
Climate Change Indicators: Heat Waves
https://www.epa.gov/climate-indicators/climate-change-indicators-heat-waves
23 of the currently still standing hottest state temperature records were set in the 1930’s. That’s almost half of the hottest temperatures in each state during 1 decade……around 9 decades ago.
https://en.wikipedia.org/wiki/U.S._state_and_territory_temperature_extremes
There was no air conditioning in the 1930's!
++++++++++++++
Posted on July 16, 2023 by tonyheller
According to the EPA, time began in 1960 and all of the hot weather before 1960 didn’t happen.
https://realclimatescience.com/2023/07/the-dawn-of-climate-time-2/
Mike Maguire
Reply to Mr Ed
July 18, 2023 7:37 am
The threat to the crops from climate change has been the complete opposite.
Climate change has resulted in the best growing weather conditions for crops and most plants in the last 1,000 years.
The additional CO2 has been making a massive contribution. Not just from its key role in photosynthesis but enriching the air with CO2 causes plants/crops to be more water efficient. They don’t need to open their stomata (underside of leaves) as wide to get CO2 and so they lose less moisture from transpiration. This makes them more water efficient/drought tolerant.

Rep. Scott Perry (R-Penn.) flattens Biden climate envoy John Kerry at today’s House Foreign Affairs’ Subcommittee on Oversight and Accountability hearing. You haven’t heard anyone confront Kerry or any other climate clown like Perry does, calling him a “grifter” and asking why he wants to spend $1.6 quadrillion on something that is not a problem.
++++++++++++++++
John Kerry's family private jet emitted over 300 metric tons of carbon since Biden took office
“So, how do we get there? Well, the lesson I’ve learned in the last years and I learned it as secretary and I’ve learned it since, reinforced in spades, is: money, money, money, money, money, money, money. And I’m sorry to say that,” he added.
I've never been a John Kerry fan because he's always seemed to be the typical hack/close-minded politician.
Thanks, Larry!
You'll especially love this one:

Mike Maguire
July 18, 2023 10:54 am
Thanks, Anthony.
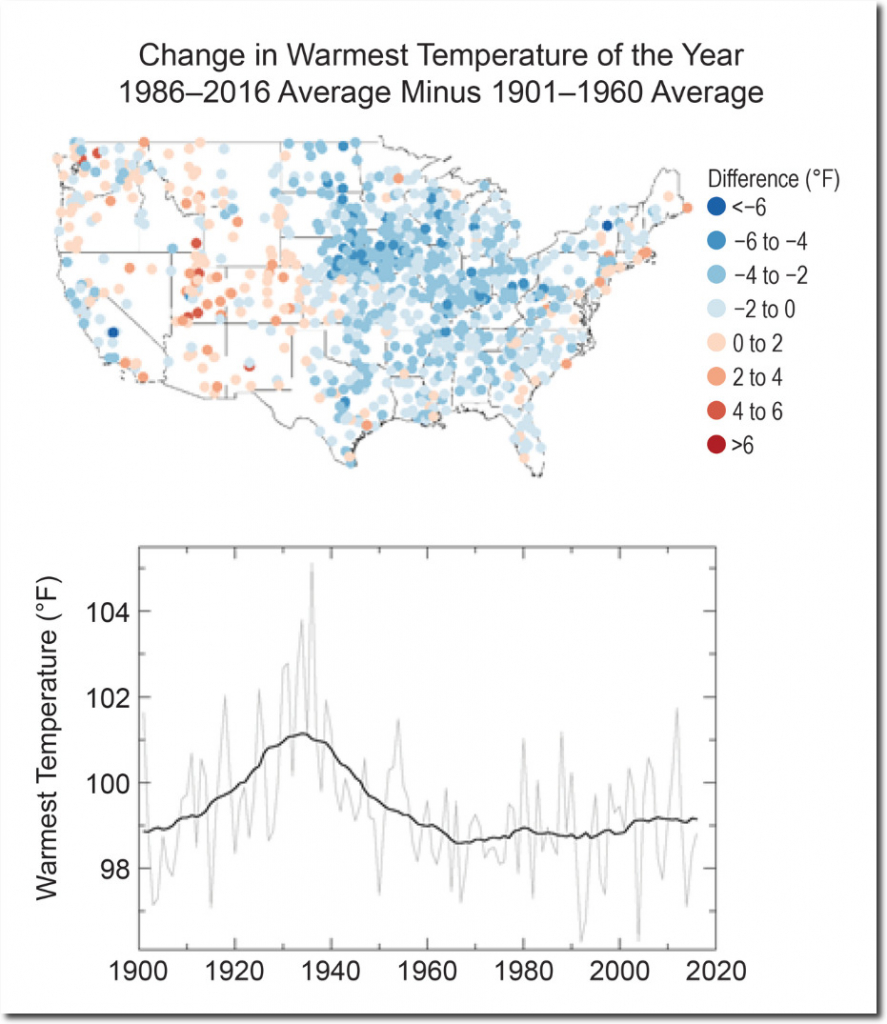
As you stated, overnight temps are the ones warming the most. Also the coldest places and driest places.
As your map of hotter days shows, it’s mainly the Western 1/3rd of the US that has had the increase(also some coastal cities in the East). Those are the driest places in the country.
In the Midwest, Summer daytime extreme heat has been greatly suppressed by massive evapotranspiration of the tightly packed corn plants, which has established a man made, beneficial micro climate across a dozen states during the growing season in the Cornbelt.
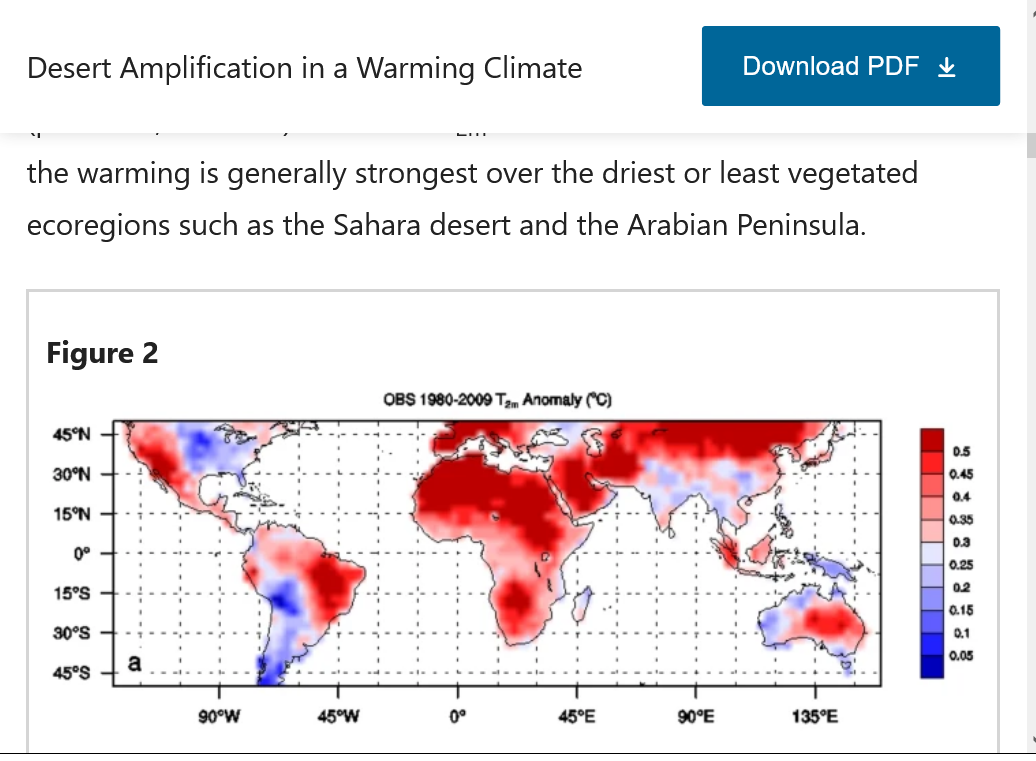
Desert Amplification in a Warming Climate
https://www.nature.com/articles/srep31065
The last 30 years in the Cornbelt have featured the best growing season weather in our country's recorded history.
When Everything is Climate Change, Nothing is Climate Change
https://wattsupwiththat.com/2023/07/18/when-everything-is-climate-change-nothing-is-climate-change/
In the realm of modern-day alarmism, no term is more popular, or more malleable, than ‘climate change.’ As evidenced by Jacopo Prisco’s recent CNN piece, it seems the phrase can be attached to virtually any phenomenon with even the slightest hint of thermal irregularity. Prisco introduces us to a novel climate change culprit: the ground beneath our cities, which, we’re told, is being deformed by so-called ‘underground climate change.’
Mike Maguire
July 18, 2023 12:31 pm
No term generates more funding than “climate change”
The silent impact of underground climate change on civil infrastructure
https://www.nature.com/articles/s44172-023-00092-1
This work is further supported by the National Science Foundation under Grant No. 2046586.
BINGO!
How We Make Funding Decisions
Funding at NSF
https://new.nsf.gov/funding/merit-review
On this page
Will Wind Turbines Be Generating More Waste Than Electricity?
https://wattsupwiththat.com/2023/07/18/will-wind-turbines-be-generating-more-waste-than-electricity/
Mike Maguire
July 18, 2023 7:38 pm
Wind: The most anti-green, anti environmental form of energy there is. Wrecking the planet to supposedly save it.
Produces diffuse, intermittent energy, while killing birds/bats and whales. Destroys landscapes and disrupts ecosystems. Tears up the earth for the raw materials, then the blades only last 20 years and get dumped into landfills.
It only exists because of crony capitalists thrilled to exploit corrupt governments that are willing to shower the industry with hundreds of billions of dollars thanks to self serving political agenda.
Using corrupt climate science that was hijacked over 3 decades ago along with absurd, impossible promises of energy delivery.
These are sold to the world by fake green energy charlatans and the colluding media, which greatly profits from sensationalizing the weather/climate and deludes itself that its helping to save the planet.
These wind farm projects and the energy delivery system they claim will result, defy the laws of physics, energy and common sense.
Regardless, most of them get authorized anyway because the rich and powerful gatekeepers with self serving interests have so much control.
The victims?
Everybody else that isn’t on the list above (billions of people), including every poor person on the planet.
Ironically, the fossil fuels they claim can be replaced using this strategy are the only true green energy based on authentic science.
While wind turbines are busy wrecking the planet as described above, the increase in the beneficial gas, CO2 from fossil fuel emissions, has greatly enriched the atmosphere. This has resulted in massively greening up the planet from the indisputable law of photosynthesis.
This massive greening of earth via CO2 fertilization is Gaia communicating a loud and clear “THANK YOU!” for rescuing the planet from near CO2 starvation below 300 parts per million. The current 420 ppm is still not barely half the optimal level for plants.
To define CO2 as pollution, when we know the authentic science proves irrefutably otherwise, is just proof of how corrupted climate science, politics and energy markets have become. Evidence of how dishonest the media is as they sensationalize every extreme weather event as being caused by the fake climate crisis.
Same atmospheric physics as a century ago. Same meteorological principles. Same weather systems………..with +1 Deg.C and +7% more moisture holding capacity compared to 100 years ago.
Death by GREENING!
https://www.marketforum.com/forum/topic/69258/
Plant Growth Database
http://www.co2science.org/data/plant_growth/plantgrowth.php
Center for the Study of Carbon Dioxide and Global Change
The Positive Externalities
of Carbon Dioxide:
Estimating the Monetary Benefits of Rising Atmospheric
CO2 Concentrations on Global Food Production(multi trillions)
“And as the CO2 concentration of the air continues to rise in the future, this positive externality of enhanced crop production will benefit society in the years, decades, and even centuries to come”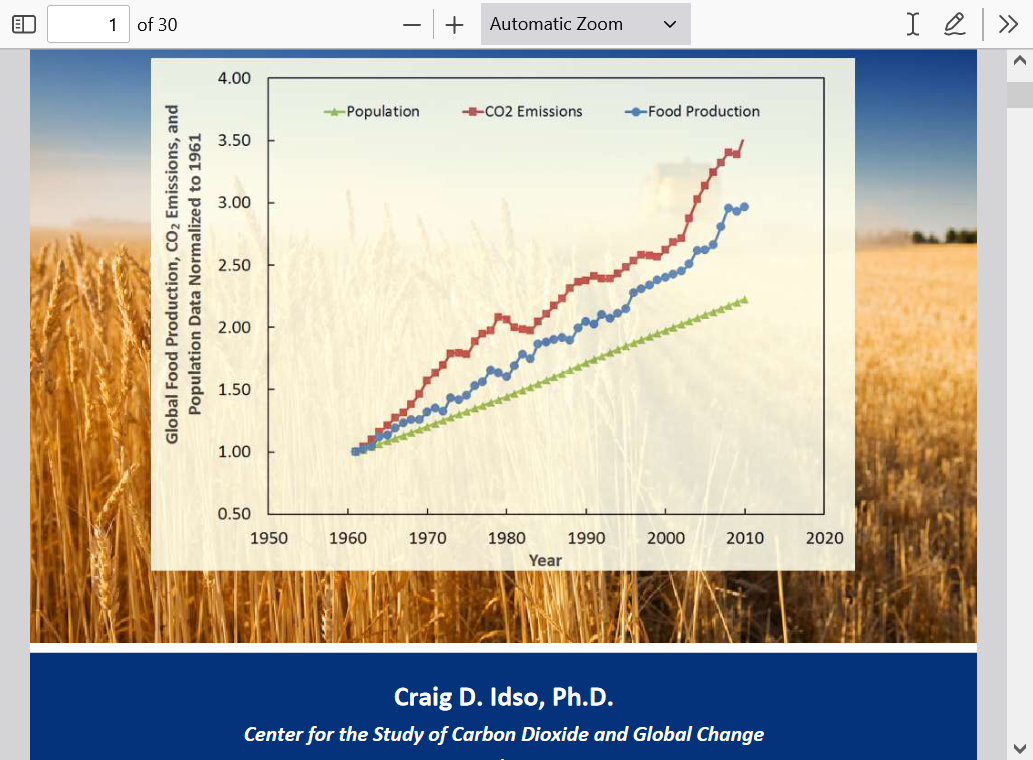
+++++++++++++++++
Energy transition is a hoax
Started by metmike - April 15, 2023, 5:50 p.m.
The source of this article is one that I have had enormous respect for the last decade and this article shows exactly why!
From the Cliff Mass Weather Blog
https://wattsupwiththat.com/2023/07/20/is-global-warming-causing-massive-heatwaves/
The media is going hyperbolic about heat waves, claiming that global warming/climate change caused by human CO2 emissions is producing a huge, sudden uptick in massive heat events. The greatest in the historical record. Heatwaves are all over the planet! Phoenix, Arizona is a frequently noted poster child of the new heatwave regime.
Here are a few examples of the headlines, I could provide dozens more just like it.

It is important to understand that current heatwaves are localized, with substantial portions of the planet experiencing cooler-than-normal conditions as well. Most of the planet is NOT experiencing unusual warmth.
Consider the observed temperature pattern on Tuesday night at 11 PM, or more exactly the difference in the observed temperature from normal (see below). Red areas are above normal and blue/green are below normal.
The figures shows that the Earth has BOTH heatwaves and cold waves going on at that time.
For example, the Southwest US. is warm, while much of the eastern U.S. is colder than normal. Northern Europe is cold, while southern Italy is experiencing heat.

But the selection of Phoenix is worse than that.
Phoenix has perhaps the most profound and rapidly growing urban heat island in the nation.
Phoenix has been one of the most rapidly growing cities in the US (see below) and all the construction (concrete, buildings, sources of heat) results in profound warming, something known as the urban heat island effect.

Do you want to see Phoenix’s heat island in action this week?
Below are the temperatures on Tuesday during the late afternoon. 117F at the Phoenix airport but 111F just outside of the metro area. This difference is quite typical for the city.

Claiming that a sudden and rapid increase in heat waves is occurring due to global warming may be good clickbait for the media and a potent tool for climate activists, but it is simply not true.
Finally, let me note that headlines early this month that the Earth was warmer than any period during the past 125,000 years were really nonsense. But I will leave that discussion to another blog.
+++++++++++
Mike Maguire
July 21, 2023 8:43 pm
As a meteorologist for 42+ years, I consider Professor Mass to be an elite, enlightened authority on this topic. He always adheres to rock solid meteorological and climate principles, along with using empirical data.
This article is one of his best and belongs in the WUWT Hall of Fame!
A principle that he taught, which I’ve shared with thousands of others at numerous times, should be repeated again here:
https://cliffmass.blogspot.com/2016/03/the-golden-rule-of-climate-extremes.html
The Golden Rule
“Considering the substantial confusion in the media about this critical issue, let me provide the GOLDEN RULE OF CLIMATE EXTREMES”
Here it is:
“The more extreme a climate or weather record is, the greater the contribution of natural variability.”
“Or to put it a different way, the larger or more unusual an extreme, the higher proportion of the extreme is due to natural variability.”
++++++++++
Copied, are the 850 temperature anomalies for the Northern Hemisphere from this morning. They show a similar pattern that Cliff noted on his map of 2m temperature anomalies from Wednesday, 7-19-23.
Small areas with yellows that had the greatest heat compared to average…….probably just less than 5% of the N.Hemisphere.
Small areas with blues which identify the coolest patches.
The vast majority of the N.Hemisphere (90% or so) is in a green-ish shade that represents close to average.
What I’ve noted for quite some time is that the media will pick all the hottest spots on the map to report from during the Summer and pretend they represent the entire planet. This year has been the worst yet.
They do that for other weather anomalies during the year but this is prime time for climate charlatanism because the Summer is the hottest season and it ALWAYS features hot spots.
We still have the same atmospheric principles and meteorological systems that we did 100 years ago but have superimposed the added heat from greenhouse gas and natural warming.
The greatest increase has taken place in the coldest places/high latitudes on the planet during the Winters. The driest places have also warmed a bit more than the average increase of 1 deg. C.
I agree with Cliff’s statement on his surface temperature map for the Phoenix area and saying that in July 2023, a high temperature of 117 in Phoenix, even with the urban heat island effect of the much greater population today but only replacing the environment with the July 1923 atmosphere that had 116 ppm less CO2(420-304 ppm), would likely feature a high of around 115. Around 2 deg. hotter today from the increase in CO2 alone..
Take away all the people/development and also dropping the CO2 back to 304 ppm (the 1923 level) would likely take off an additional 4 degrees to 111 deg. F.
Some of the areas on Cliff’s map that were 6 deg. F cooler outside of the city also have slightly higher elevations, so that’s why I only guesstimated a more conservative 4 degree contribution from the UHI vs 6 deg. F in the outlying areas.
So the urban heat island contribution (+4 Deg. F) is probably double the greenhouse gas warming contribution (+2 Deg F) for Phoenix in this case.
![]()
Mike Maguire
Reply to Mike Maguire
July 21, 2023 9:28 pm
I’ll be on a tv show called “Ladies of Another View” that’s broadcast out of Bismark, ND next week to discuss this topic.
https://www.bek.news/ladiesofanotherview
Perfect timing!
Bismarck will be having a heat wave next week with a high temperature getting well into the 90’s on several days. These are the 2 hottest days below:
https://forecast.weather.gov/MapClick.php?x=189&y=165&site=bis&zmx=&zmy=&map_x=189&map_y=164
Monday
Mostly sunny and hot, with a high near 91. Northeast wind 6 to 9 mph becoming east in the morning.
Monday Night
Partly cloudy, with a low around 66. East wind around 9 mph.
Tuesday
Mostly sunny and hot, with a high near 94. Southeast wind 8 to 15 mph, with gusts as high as 23 mph.
Tuesday Night
A slight chance of showers and thunderstorms. Partly cloudy, with a low around 67. South wind 9 to 14 mph, with gusts as high as 21 mph.
Wednesday
Sunny and hot, with a high near 94. South wind 8 to 14 mph becoming northwest in the afternoon. Winds could gust as high as 22 mph.
+++++++++++++++++++
How hot is this compared to the past?
Let’s look at the record books for next Wed-Thu, the day the show will air and the day after in Bismarck, ND and compare the numbers with the 10 hottest temperatures for those dates.:
I put the most recent 3 on the list in bold/underlined to stand out.
Note how the 1930's are on there the most and don't even include the hottest July and Summer in North Dakota recorded history, 1936.
Wednesday, July 26
| Rank | Value | Date |
|---|---|---|
| Top 10 Record Daily High Temperatures for Bismarck | ||
| 1 | 106 | 07/26/1929 |
| 2 | 102 | 07/26/2021 |
| 3 | 101 | 07/26/1988 |
| - | 101 | 07/26/1933 |
| - | 101 | 07/26/1930 |
| 6 | 99 | 07/26/1941 |
| - | 99 | 07/26/1931 |
| 8 | 98 | 07/26/1914 |
| 9 | 97 | 07/26/1952 |
| - | 97 | 07/26/1900 |
Thursday July 27
| Rank | Value | Date |
|---|---|---|
| Top 10 Record Daily High Temperatures for Bismarck | ||
| 1 | 107 | 07/27/1931 |
| 2 | 106 | 07/27/1988 |
| 3 | 104 | 07/27/1959 |
| 4 | 101 | 07/27/1960 |
| 5 | 99 | 07/27/2006 |
| - | 99 | 07/27/1933 |
| - | 99 | 07/27/1917 |
| 8 | 98 | 07/27/1952 |
| - | 98 | 07/27/1890 |
| 10 | 97 | 07/27/1941 |
This is consistent with the other states in the US.
23 of the 50 all time hottest US state record high temperatures were set in the 1930’s and still stand today.
https://en.wikipedia.org/wiki/U.S._state_and_territory_temperature_extremes
https://cei.org/blog/post-heat-wave-reflections/
+++++++++++++++++
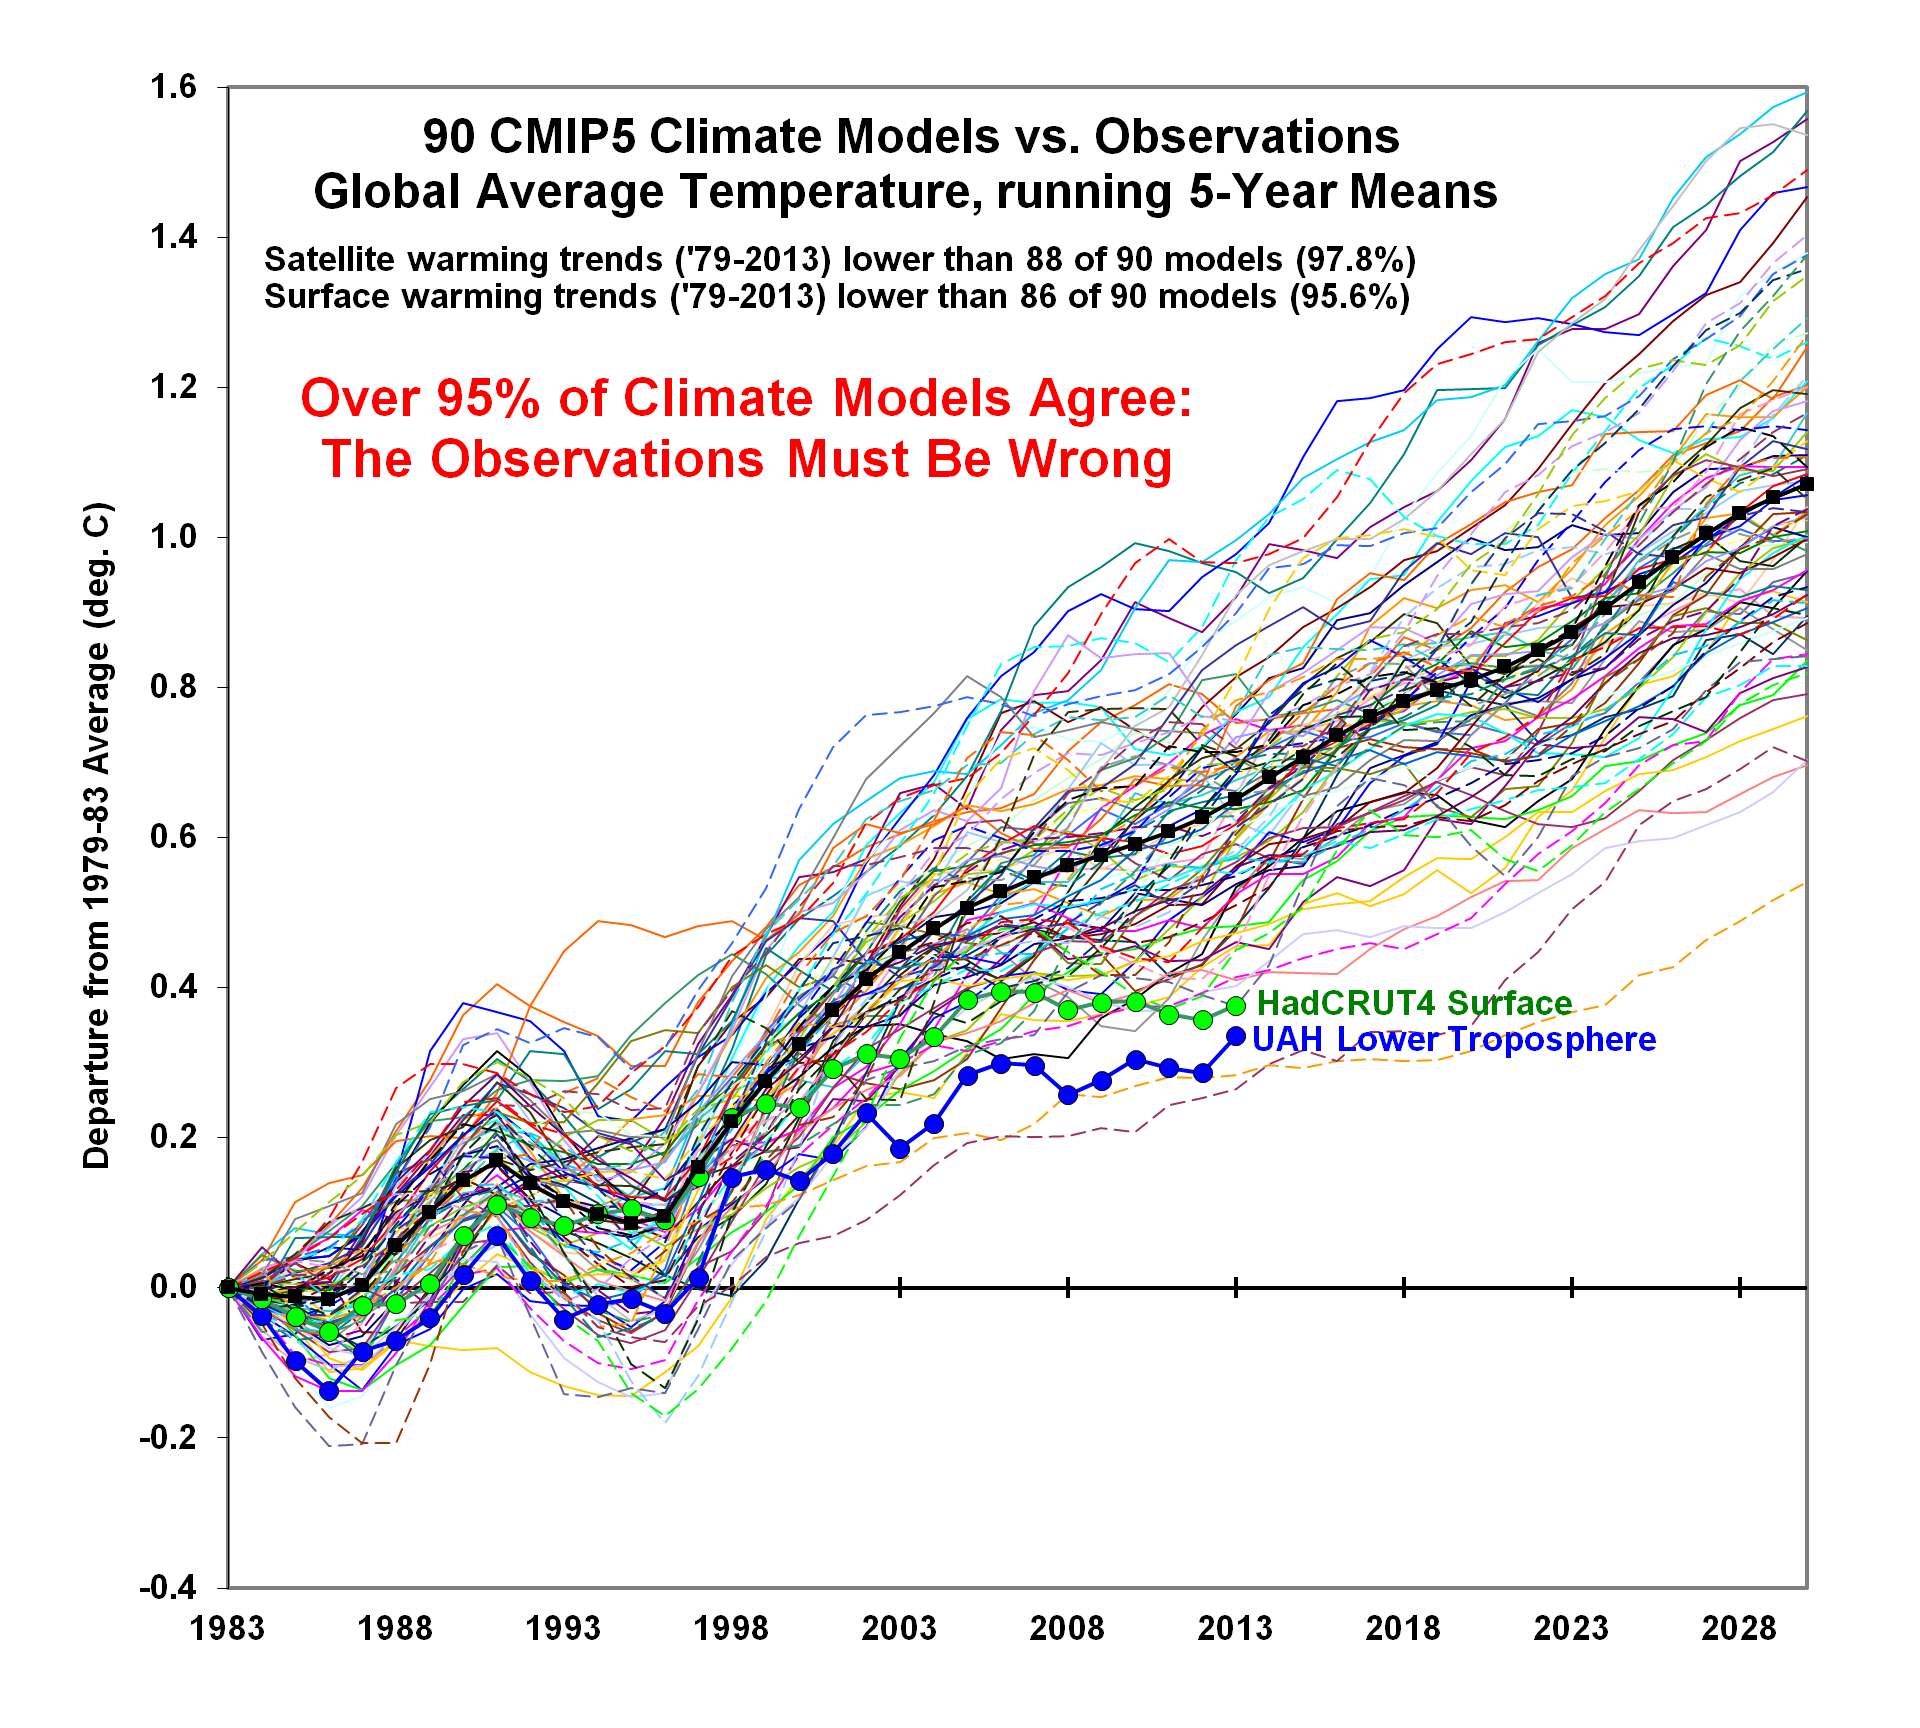
Profound: Smoking Guns!! Proof with accurate 2 decade long measurement of the actual amount of radiative forcing caused by CO2 of 1 irrefutable reason for WHY global climate models continue to be too warm. Climate emergency is really about social justice and brainwashing people. Even MORE confirmation that climate models overstate atmospheric warming. Models clearly too warm yet incredibly programmed to get even HOTTER! Now, even more confirmation why the models are too warm. August 2020
https://www.marketforum.com/forum/topic/57636/
Busted Climate models
Started by metmike - April 16, 2021, 6:13 p.m.
https://wattsupwiththat.com/2023/07/20/is-global-warming-causing-massive-heatwaves/
Tom Abbott
Reply to Mike Maguire
July 22, 2023 4:50 am
“the greenhouse gas warming contribution (+2 Deg F) for Phoenix in this case”
That is an assumption. There is no evidence this is the case.
Reply
Mike Maguire
Reply to Tom Abbott
July 22, 2023 6:06 am
Greenhouse gas warming from CO2 is not just a speculative theory. It’s based on a law in physics that has been proven with empirical data, including accurate measurements in the atmosphere.
Those measurements show that the IPCC models are using equations that add 42% more forcing than the actual measured amount in the REAL atmosphere. When we obtained that powerful empirical data, what did the IPCC do?
They ignored it!
That persistent refusal to adjust the models down to observations is solid evidence that the IPCC modeling products are NOT rooted in the scientific method but instead are political tools.
RADIATIVE FORCING BY CO2 OBSERVED AT TOP OF ATMOSPHERE FROM 2002-2019
https://arxiv.org/pdf/1911.10605.pdf
“The IPCC Fifth Assessment Report predicted 0.508±0.102 Wm−2RF resulting from this CO2 increase, 42% more forcing than actually observed. The lack of quantitative long-term global OLR studies may be permitting inaccu-racies to persist in general circulation model forecasts of the effects of rising CO2 or other greenhouse gasses.”
Additional information about busted global climate models:
https://www.marketforum.com/forum/topic/57636/
https://www.marketforum.com/forum/topic/68079/
50-Year U.S. Summer Temperature Trends: ALL 36 Climate Models Are Too Warm
https://www.drroyspencer.com/2022/10/50-year-u-s-summer-temperature-trends-all-36-climate-models-are-too-warm/
++++++++++++++++++++++++++++++++
October 20th, 2022 by Roy W. Spencer, Ph. D.
As seen in the accompanying plot, 50-year (1973-2022) summer (June/July/August) temperature trends for the contiguous 48 U.S. states from 36 CMIP-6 climate model experiments average nearly twice the warming rate as observed by the NOAA climate division dataset.
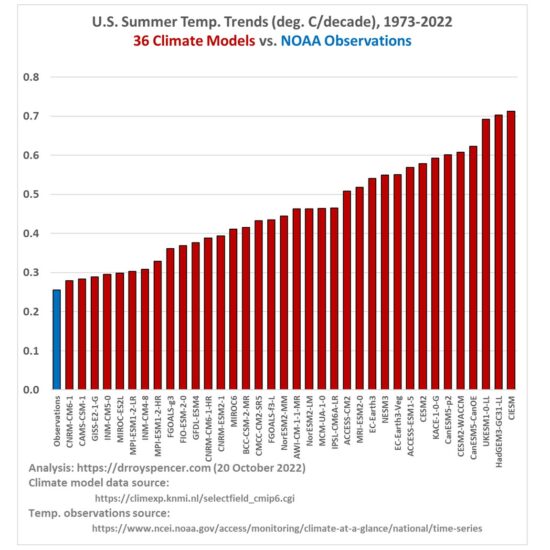
"The official NOAA observations produce a 50-year summer temperature trend of +0.26 C/decade for the U.S., while the model trends range from +0.28 to +0.71 C/decade.
The importance of this finding should be obvious: Given that U.S. energy policy depends upon the predictions from these models, their tendency to produce too much warming (and likely also warming-associated climate change) should be factored into energy policy planning. I doubt that it is, given the climate change exaggerations routinely promoted by environment groups, anti-oil advocates, the media, politicians, and most government agencies."
+++++++++++++++++
The U.S. warming in Dr. Spencers study is almost all coming from the western 1/3rd of the country. The Midwest has actually seen a slight cooling trend during the Summers of the last several decades.
https://realclimatescience.com/2023/07/the-dawn-of-climate-time-2/
+++++++++++++++++
Mike Maguire
Reply to Mike Maguire
July 22, 2023 6:36 am
The U.S. warming in Dr. Spencer’s study is mostly coming from the western 1/3rd of the country. The Midwest has actually seen a significant REDUCTION in the number of hot days during the Summers of this period.
Thanks to Anthony for the graph!

Climate change has been a wonderful blessing to those of us that live in the Midwest and surrounding areas.
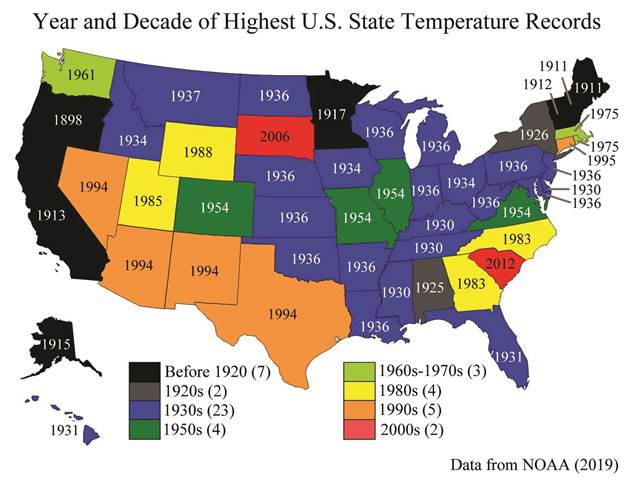
I finally found a good map that shows the all time state record highs and the year.
Since this map came out, Washington State hit 120 degrees on June 29, 2021 to break the old record by 2 degrees.
https://wonderingmaps.com/us-hottest-days/

Below is a better look at the years only for the hottest state temperature records.
Right after this map came out in 2019, Colorado broke their state temperature record to go with the one in Washington State in 2021.
So now we have 4 all time hottest records set in the 2+ decades since the year 2000.
Compare that to 23 all time hottest temperatures in just the decade of the 1930's in the purple color below that still stand!
https://cei.org/blog/post-heat-wave-reflections/
They cherry pick the hottest spots in the world in the hottest months and tell us the earth is on fire.
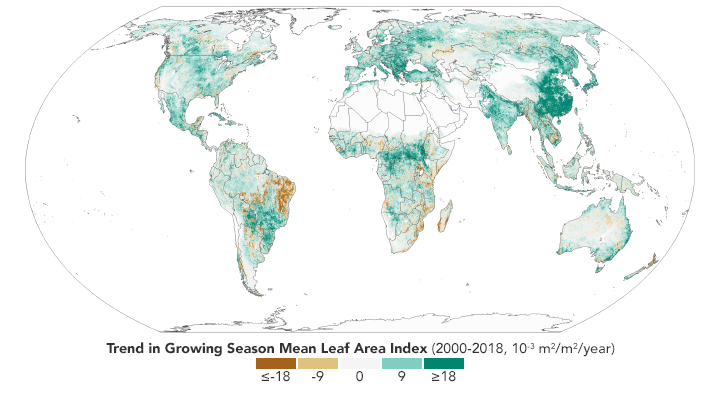
While this is the truth:
https://earthobservatory.nasa.gov/images/146296/global-green-up-slows-warming
+++++++++++++++++++++++++++++++
++++++++++++++++++
Challenging "Net Zero" with Science Richard Lindzen William Happer CO2 Coalition

metmike: Half of the world's population is supported by synthetic fertilizers made with fossil fuels(natural gas).
However, note the measured greening of most of the planet at the top of the page that includes natural vegetation and forests cut for timber, regrowing at twice the rate they did 100 years ago. This is predicted to continue to the year 2100. None of that is caused by synthetic fertlizers like those in the chart above. Our planet is not dying but instead is massively greening from:
1. The enrichment of the air with increasing amounts of beneficial CO2.
2. The benefits from the current climate and weather OPTIMUM for life.
Authentic science always shows all the data and never cherry picks items that represent a small part of the science, while intentionally ignoring the biggest factors.
This thread clearly proves that the field of climate science was hijacked by the self serving gatekeepers of the false narratives that all collude to get their share of the 100's of trillion of dollars and power.
For political agenda, crony capitalism, media sensationalism/ratings and corrupt science.
We are having an authentic climate optimum for life not a climate crisis.
that post right there MM is why I would gladly pay your way and have you seated directly to the right of that idiot John Kerry at that committee hearing last week. By the time you got done with him he would be seen sneaking out the side door in tears and America would be far better informed about all things climate.
Thanks much, mcfarm!
Our producers, like you that grow crops for a living in the REAL world are authorities on synthetic fertilizers!
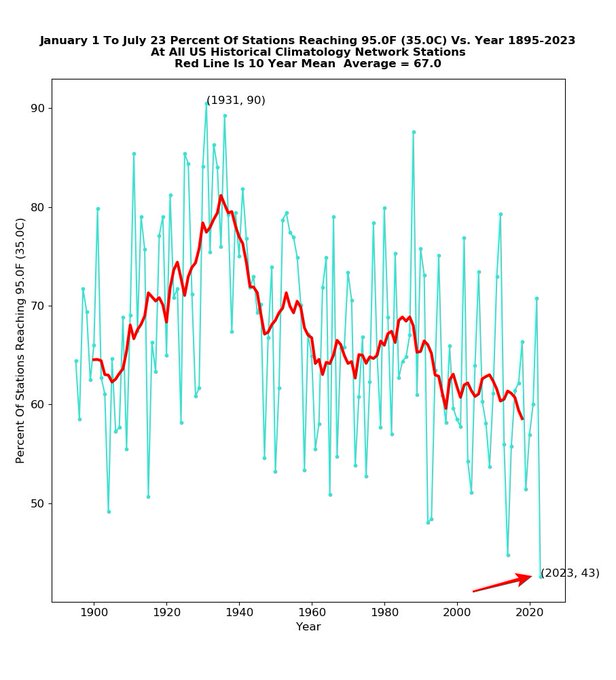
Through July 23, 2023, how are Lower 48 USA temperatures (area averaged) compared to last 70+ years? The red line tracks this year's progress. So far, nothing exceptional across the United States: middle of the pack. While global ocean temperatures have run much warmer than normal, that's not translating to the entire USA. Hot weather has been confined in July to the desert southwest to Texas, so far.
How about this chart?
The percent of the US to reach 95F (35C) through July 23 continues at a record low 43%, down from 90% in 1931. #ClimateScam
2022 Nobel physics winner John Clauser ripped the pseudoscience and ‘techno-con’ that is climate last week in South Korea.
At 10:40, he states that "the dominant processes in climate change have been misidentified by a factor or 200"
Keep in mind that the climate models are completely based on the physics of the atmosphere, represented by mathematical equations. This guy was just recognized as the best of the best in that field with a Nobel Prize in physics.
We keep hearing that "deniers" are the ones who don't believe in the climate crisis and models. They're making that up. You just heard the smartest man in physics say something that "deniers" claim.
He states earlier, that observations ALWAYS trump theories.
In climate science, they have IGNORED the observations because the models are a political tool NOT SCIENCE.
https://www.drroyspencer.com/2014/02/95-of-climate-models-agree-the-observations-must-be-wrong/