how strong will this El Niño BE?
More later today.
Today's SOI did rise but only barely/much less than I thought with it still down at -9.48. That now tells me that the -SOI streak is safe to continue for a good number more days with it now at 11 days. It should end up at 17+ days as it looks now.
Due to the combo of way above normal Darwin and significantly below normal Tahiti SLP, the GFS and Euro are suggesting a sub -50 SOI is quite possible on May 23rd. That would mean the lowest daily SOI since at least the -52 of 2/17/2017 and possibly the lowest since the -58 of 2/6/2010! It would also mean the lowest daily May SOI since 1997.
May MTD is now at -8.3. With this very strong -SOI period coming next week, a sub -10 May of 2023 is now just about a certainty. That is a very strong indicator of an upcoming El Niño of an unknown magnitude.
Per ONI I still favor a strong fall/winter peak but with high end moderate (+1.3 to +1.4) on the low side and super (+2.0+) on the high side. That puts me +1.6 to +1.9 for most likely.
But per RONI assuming a -0.4 adjustment due to very warm worldwide tropical SSTAs, anywhere from a high end weak (+0.9) to low end super (near +2.0) is reasonably possible for the fall/winter peak with +1.2 to +1.5 for most likely.
--------------------------
Redifining Nino indices in a warming climate (relates to RONI):
https://iopscience.iop.org/article/10.1088/1748-9326/abe9ed/pdf
Gentlemen of the Weather
Translation, please.
Are you cover grain shorts, adding to shorts, or getting long??
tjc said: "Gentlemen of the Weather
Translation, please.
Are you cover grain shorts, adding to shorts, or getting long??"
-----------------------
tjc,
1. There is a negative (positive) correlation between the SOI and an oncoming or ongoing El Niño (La Niña). This sharp drop of the SOI this month is showing that an impending El Niño is beginning to affect the atmosphere.
SOI is based on the difference in barometric pressure between Tahiti and Darwin.
https://www.cpc.ncep.noaa.gov/products/analysis_monitoring/ensocycle/soi.shtml
2. I have no trade recommendations.
Sorry for not following thru with the ENSO analysis promised earlier.
Thanks for doing that and generously sharing for us, Larry.
More in a bit.
tjc,
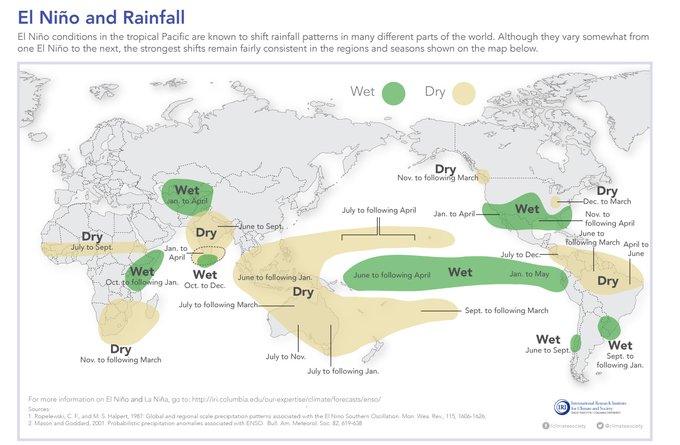
There is a strong correlation between El Nino growing seasons and favorable weather. It's likely CAUSATION related with La Nina's, like the last couple of growing seasons often featuring bad/dry weather.
For sure the market knows this and is already dialing that into prices and is LESS threatened with current drought areas expanding. Week 2 weather maps were increasing rains this week(especially for the driest areas), which confirmed less need for drought scare weather premium and prices crashed.
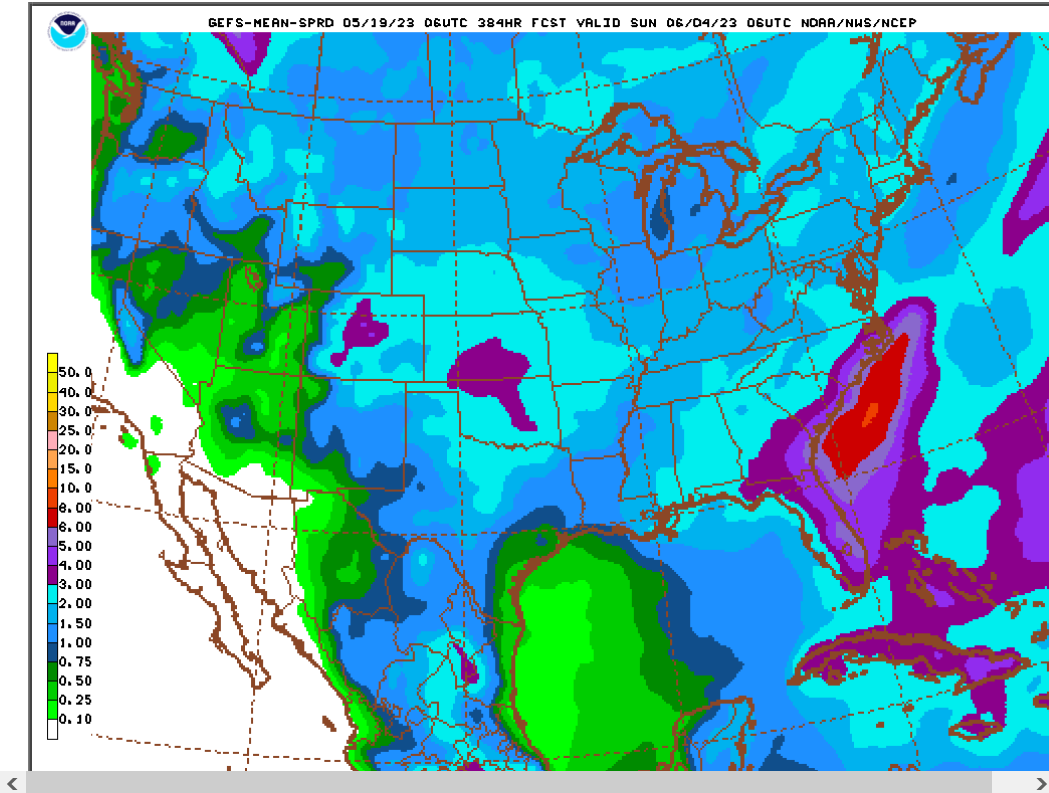
This was the last 6z GEFS rain total map for 2+ weeks.
Light blue is 2+ inches and good rains for the some of the driest areas. 3+ inches will make a dent in the drought and just what the doctor ordered for the worst rated HRW in the S.Plains since accurate records started on this metric.
This will help some P/VP wheat to make Fair but not give up much G/Ex wheat in KS, though there will be a single digit amount of that.
Planting being well ahead of average means there will be no planting delay concerns for most of the crop this year (other than ND).
ND/MN are not as wet but they need warm/dry to plant so its actually bearish for them too.
On 5/19 ITT, I said this:
"Due to the combo of way above normal Darwin and significantly below normal Tahiti SLP, the GFS and Euro are suggesting a sub -50 SOI is quite possible on May 23rd. That would mean the lowest daily SOI since at least the -52 of 2/17/2017 and possibly the lowest since the -58 of 2/6/2010! It would also mean the lowest daily May SOI since 1997."
------------------------------
Today's SOI update:
The models did a great job. Yesterday's was -43 and today's is -62, which is the lowest since 2/6/10 and 12th lowest since dailies started in June of 1991. The seasons since 1991-2 with the 11 lower SOI dailies were 2009-10, 2006-7, 2004-5, 1997-8, and 1991-2. Of these five seasons, one was super strong Nino, two were strong Nino, and two were weak Nino. So all over the board in terms of El Niño strength.
Though today will end up the low of this stretch, the next two days will still be strong -SOIs (likely sub -25) before a further rise.
Thanks much, Larry!
This is really impressive and something I've been neglecting so thanks for your persistence and wonderful, very insightful contributions.
From the site that you provided a link to earlier:
https://www.cpc.ncep.noaa.gov/products/precip/CWlink/MJO/enso.shtml#current
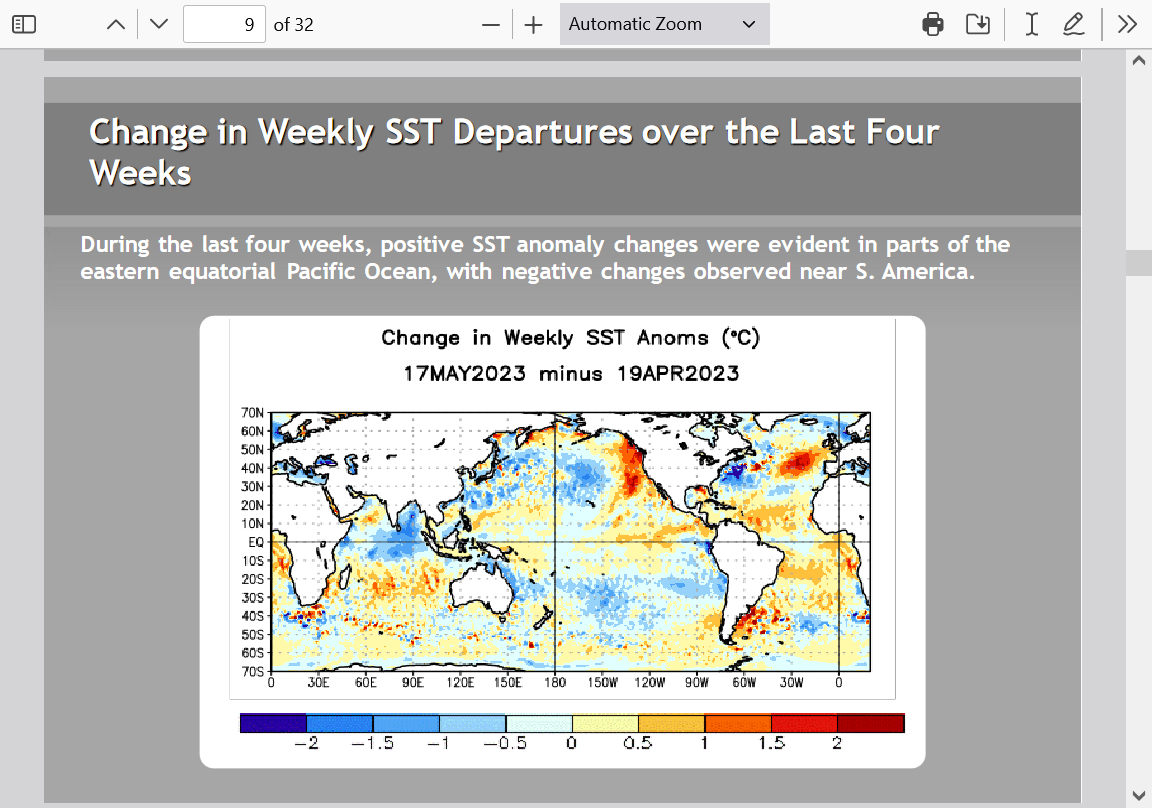
https://www.cpc.ncep.noaa.gov/products/analysis_monitoring/enso_update/sstanim.shtml
 |
 |
https://www.cpc.ncep.noaa.gov/products/analysis_monitoring/enso_update/wkxzteq.shtml
 |
 |
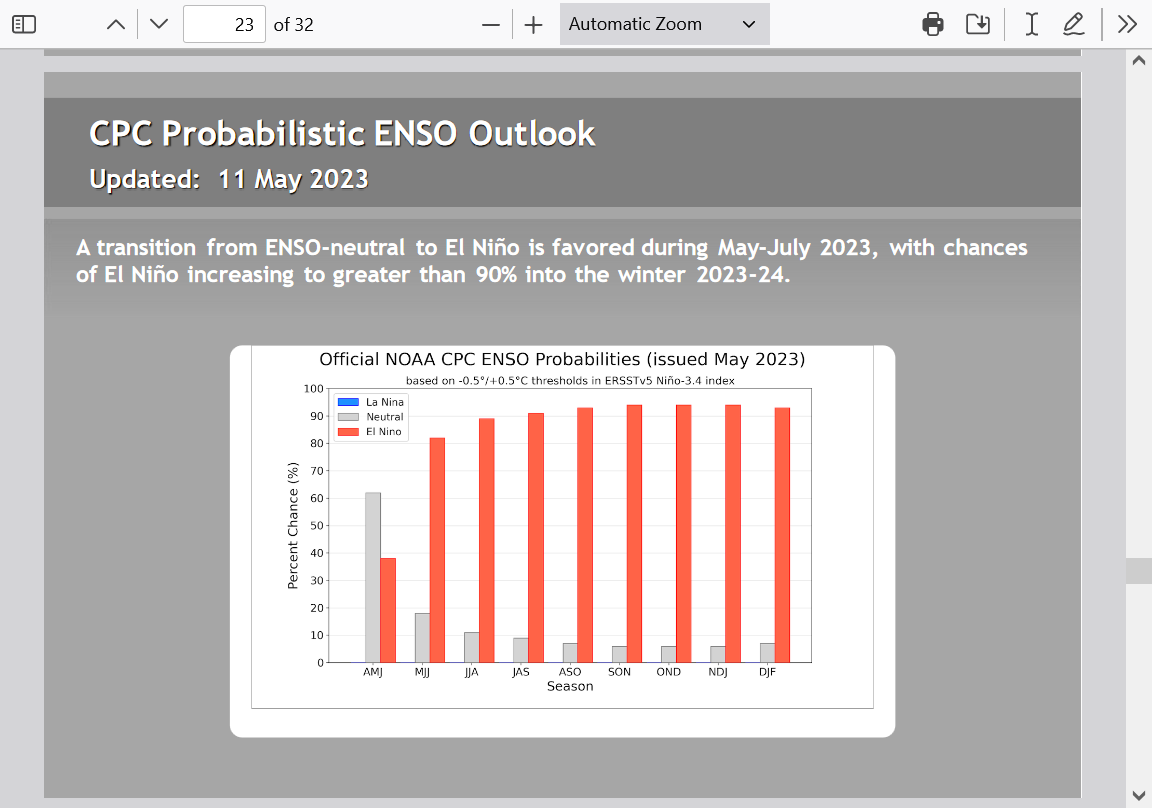
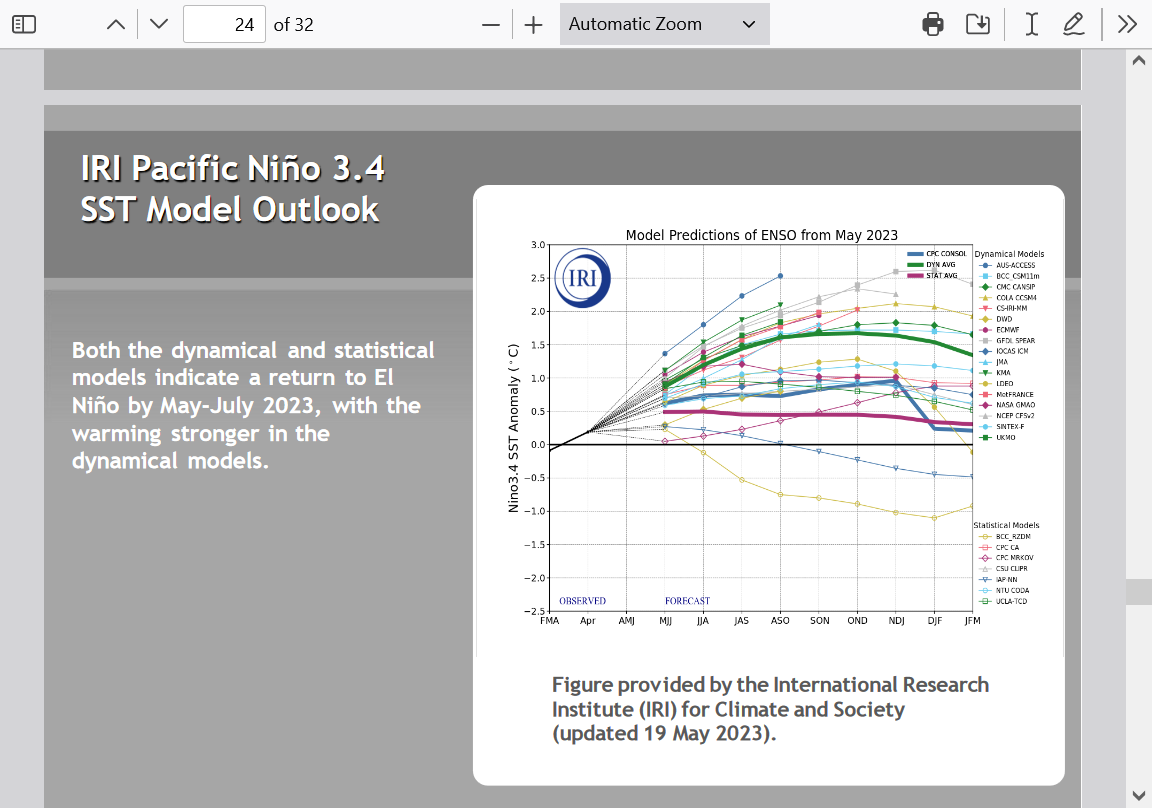
This was the just updated ENSO report from yesterday. SUPER El Nino, here we come!
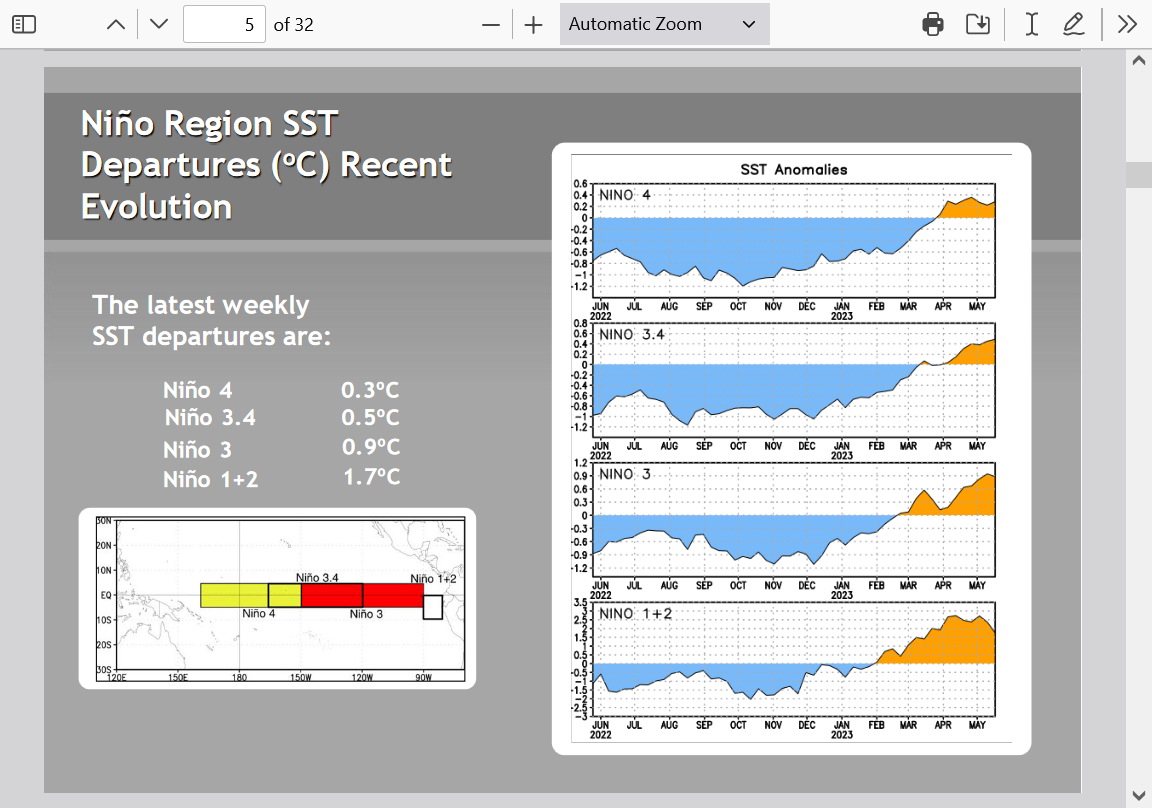
ENSO: Recent Evolution,
Current Status and Predictions
Update prepared by:
Climate Prediction Center / NCEP
22 May 2023
Nino 1+2 continue VERY warm and the warmth is spreading West into the critical Nino 3.4 used to determine the "official" ENSO state.
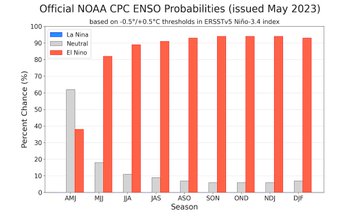
Like I've been saying all year, the ocean and atmosphere will already be acting like El Nino BEFORE NOAA declares El Nino. The Pacific Ocean is massive. NOAA has a specific definition based on one area of the Pacific to declare "El Nino". The rest of the ocean and atmosphere that also have a powerful impact don't wait around for NOAA to tell it we have an El Nino.
NOAA uses a 3 month average too. This means there is ALWAYS a lag in their formal declaring of El Nino because it takes some sustained El Nino level ocean temps in Nino 3.4 to boost a 3 month average to +.5 Deg. C.
The cold temperatures off the Coast of California/Baja are pretty interesting and deserve more study/interpretation for potential impacts when they exist with such warm water to the south and north.
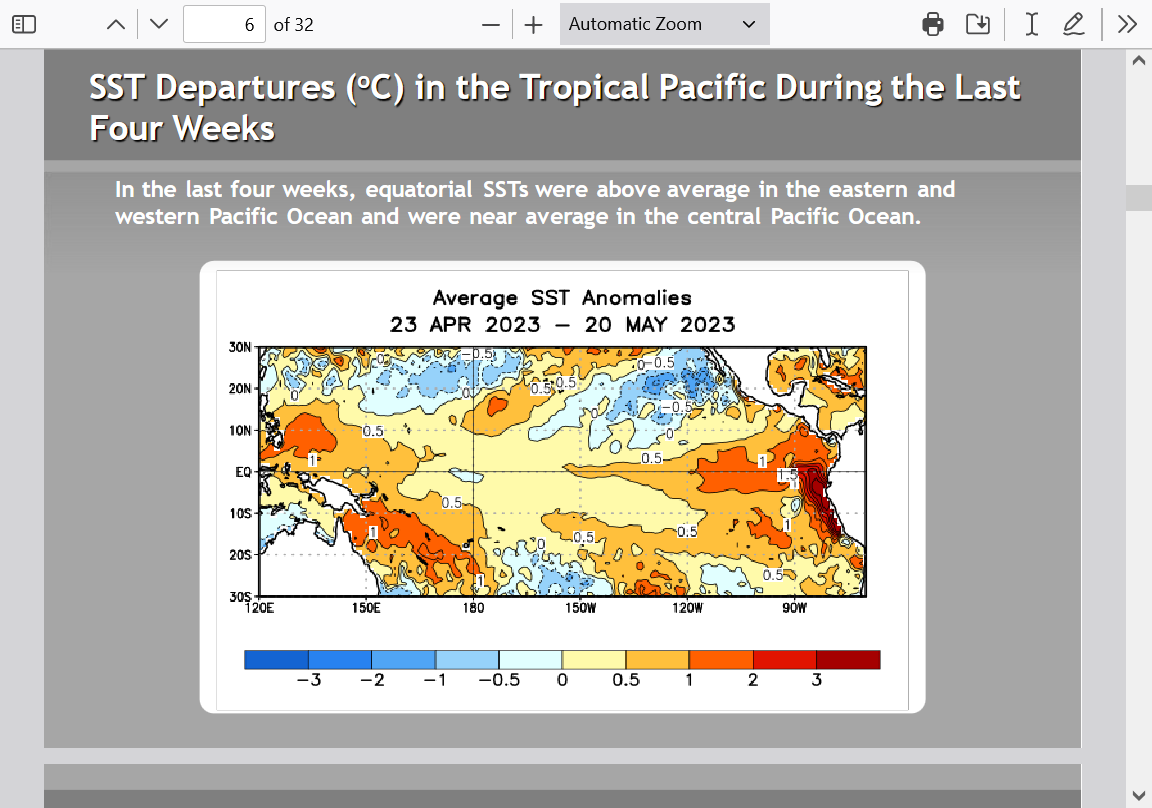
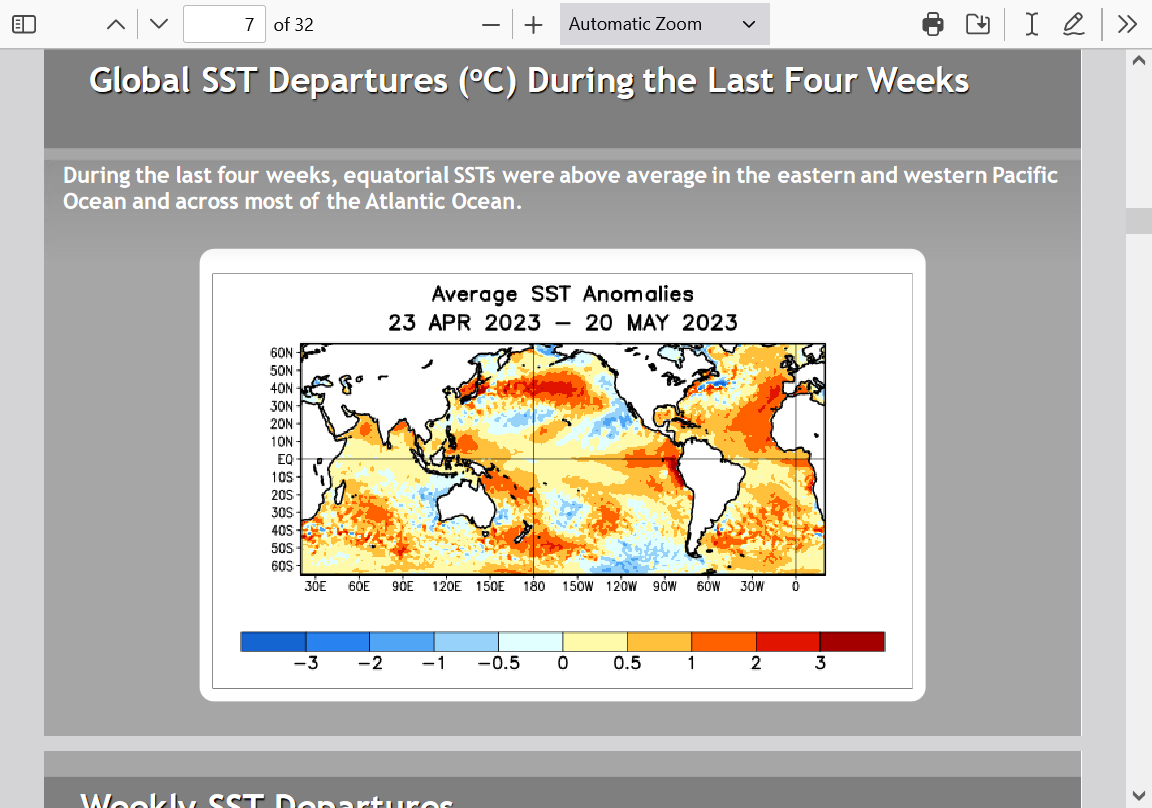
Note the biggest warming below was actually in the far Northeast Pacific
+++++++++++++
We aren't even close to "The Blob" heat in that region but many of us, especially Larry remember that feature back in 2014-16:
https://www.nps.gov/articles/theblob.htm

https://earthsky.org/earth/pacific-blob-is-changing-weather-patterns/
https://en.wikipedia.org/wiki/The_Blob_(Pacific_Ocean)
Compared to its surficial twin, it could be more powerful and last longer.
https://interestingengineering.com/science/the-blob-deep-below-seafloor-heatwaves
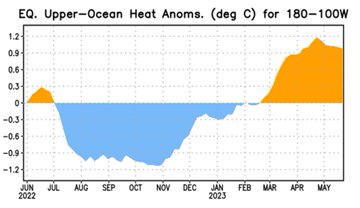
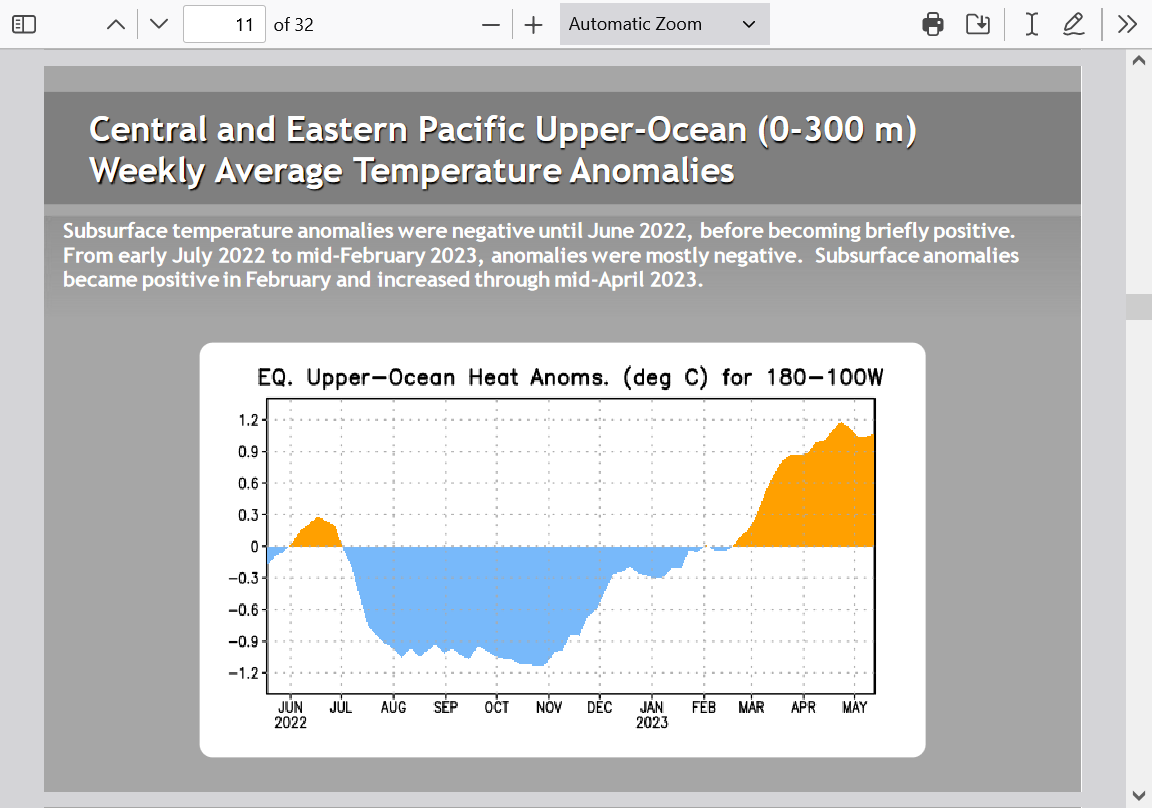
In just 6 months, upper-ocean heat anomalies have increased over 2 deg. C!
This WILL result in heat burping out of the Pacific Ocean(2/3rds of the oceans and 2/3rds of the heat in the system) into the atmosphere and global temperatures WILL increase the rest of this year and thru much of 2024.
So after a period of stalled global warming(to slight cooling) the past 7 years(mostly because of the atmosphere cooling, natural La Nina) we should get back up to the record and probably exceed it next year because of this natural El Nino. High confidence.
ENSO causes variations up and down of several years in global temps with greenhouse gas warming superimposed.
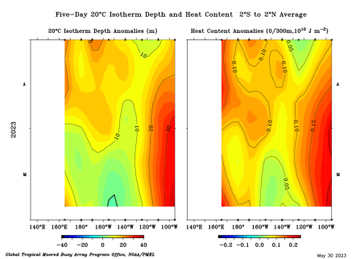
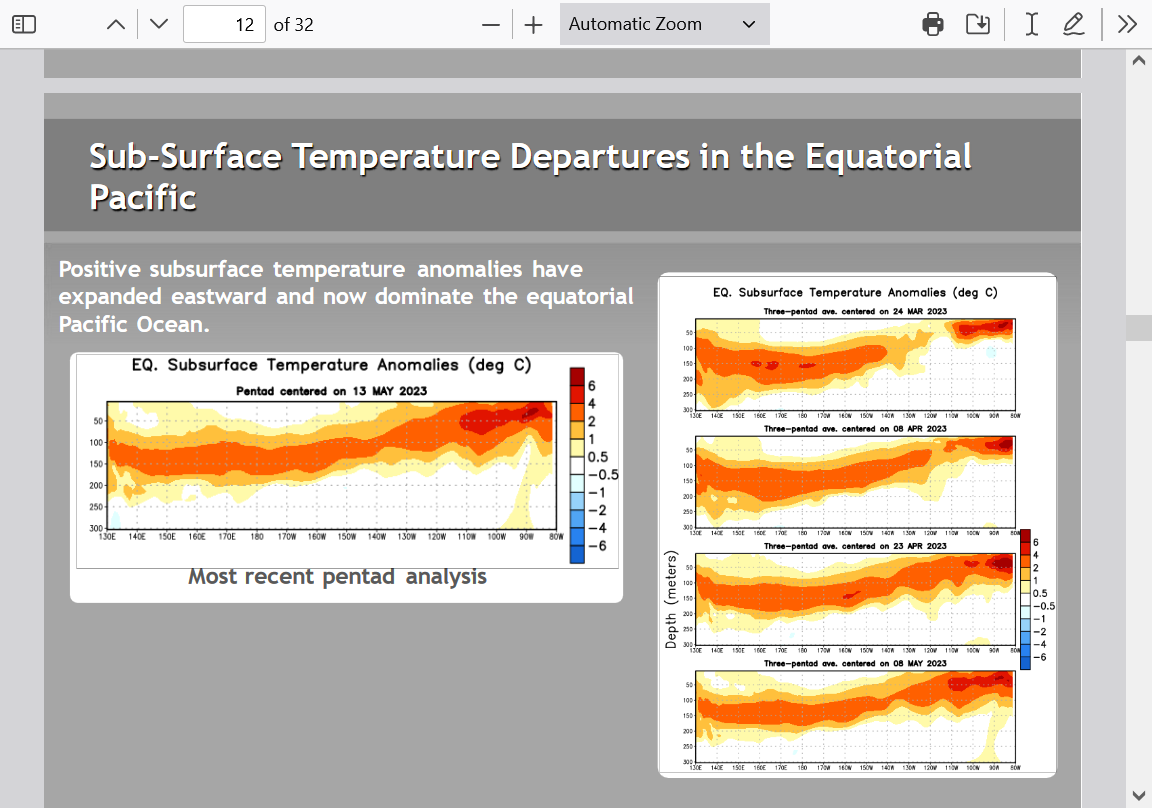
Plenty of significant warmth below that's spread across the entire Pacific.
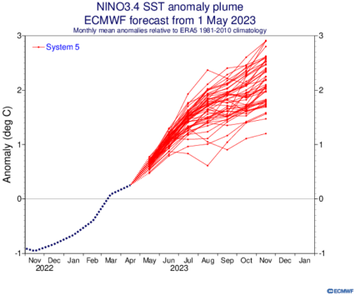
Now, the question is just HOW STRONG this upcoming El Nino will be?
Models UNDER predicted the longevity of the very long lasting La Nina.
Earlier this year, they UNDER predicted the strength of this upcoming El Nino compared to the most recent forecasts.
I feel this one will be a Super El Nino.
What do you think, Larry?
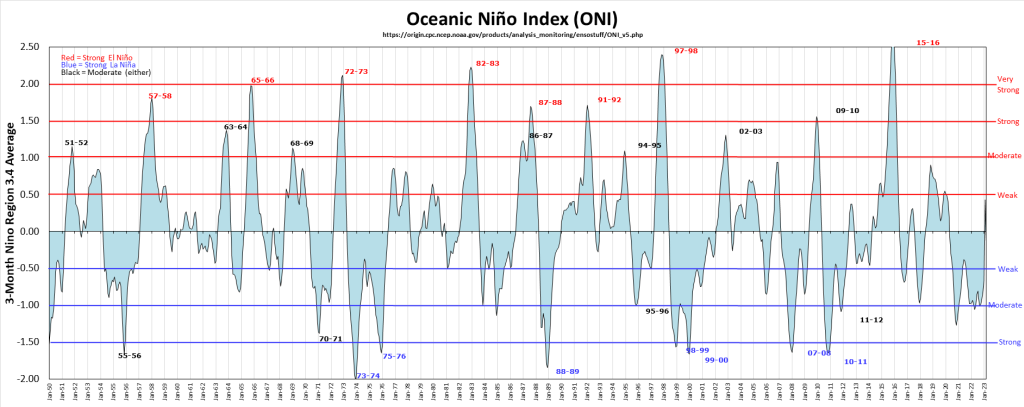
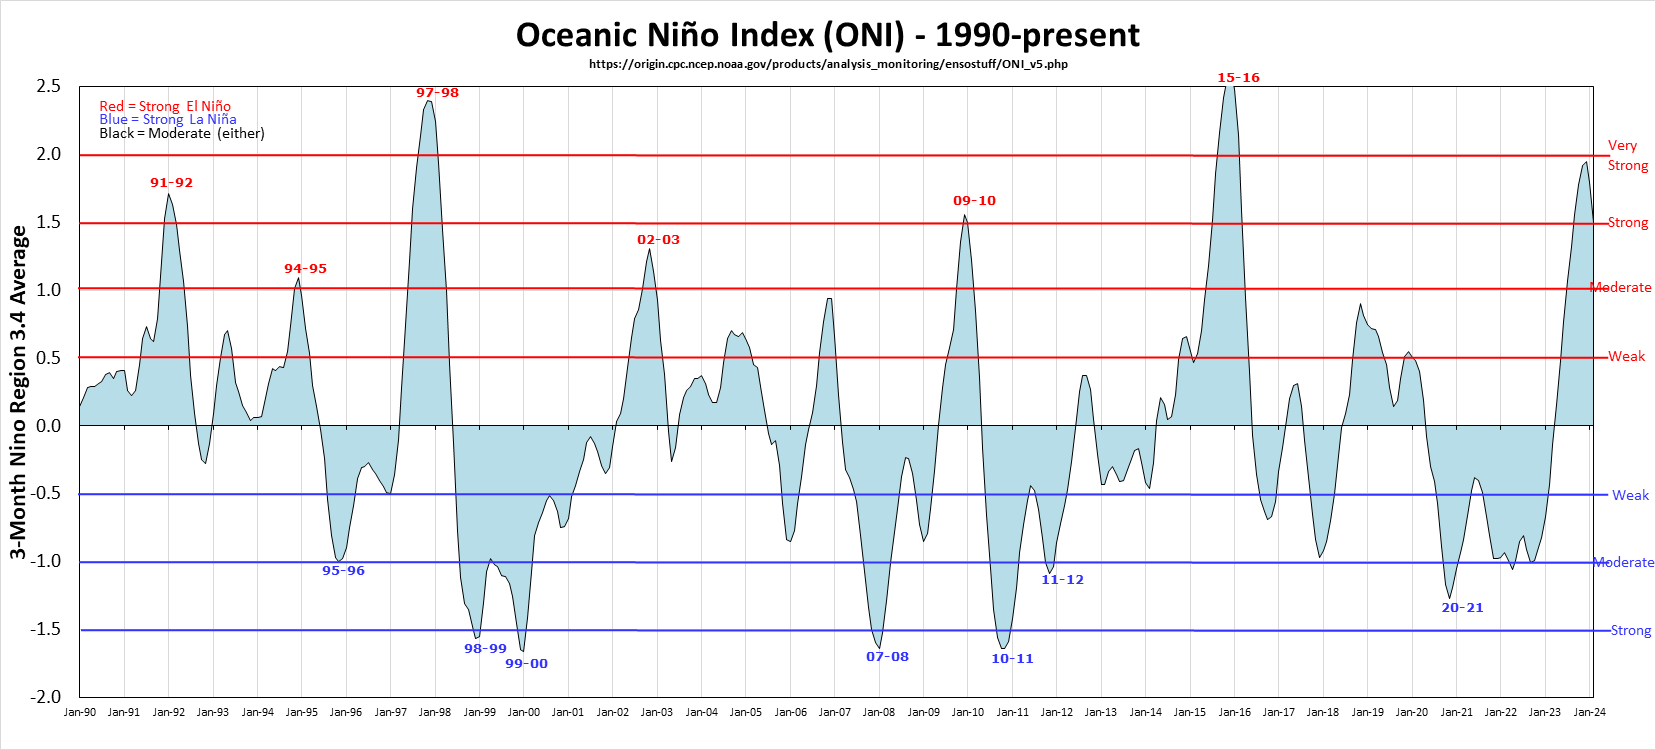
El Niño and La Niña Years and Intensities
https://ggweather.com/enso/oni.htm
| Have equaled or exceeded the threshold for at least 3 consecutive overlapping 3-month periods. | ||||||||||||||||||||||||||||||||||||||||||||||||||||||||||||||||||||||||||||||||||||||||||||||||||||||||||
| ||||||||||||||||||||||||||||||||||||||||||||||||||||||||||||||||||||||||||||||||||||||||||||||||||||||||||
Yesterday I said:
"Though today will end up the low of this stretch, the next two days will still be strong -SOIs (likely sub -25) before a further rise."
------------------------------
I was wrong about yesterday's SOI being the low of the stretch. Today's -65 was even lower than yesterday's -62! Today's -65 is the 7th lowest daily SOI on record (back to June of 1991). The only ones lower were five days in 1997-8 and one day in 2009-10 (2/5/2010). And keep in mind it is only May 24th, meaning the current Nino is just starting!
**Edit: Though nothing like the rarity now occurring, it now looks like there will be another strong -SOI dip this month with it likely centered on 5/31 near -34.
Thanks much, Larry!
Eric Snodgrass gives a wonderful, comprehensive explanation of ENSO.
Today's SOI is -21. It will rise sharply again tomorrow. The -SOI streak may or may not end tomorrow as it looks to be close. If not, it looks to end Sunday.
It will fall back at the end of the month and is progged to drop to ~~-22 on 5/31. May is projected to end up ~-14 to -15.
Looking further, I see no significant AN SLP in Darwin on the models during 6/1-7. It is looking to average NN to possibly a bit BN. Tahiti is less clear as all show BN early while some (operationals) suggest mainly BN probably lingering the whole week while ensembles suggest mainly NN returning.
So, whereas the consensus suggests no return to another lengthy strong -SOI the first week of June, it is hard to predict about where that period will end up. For now, I'm leaning fairly neutral.
Thanks much, Larry!
Which Climatic Variables Signify An El Niño?
"A month or so ago, I felt that maybe El Niño might hold off until the fall or winter. This was because of something we call in meteorology a negative PDO index. However, the Trade Winds in the Pacific are changing, the negative PDO weakening slightly, and more models have now been suggesting El Niño; may be as early as June or July."
The full May of 2023 SOI comes in at -15. How does this rank compared to other Mays since 1876? It comes in 8th lowest, which is a strong indicator for an upcoming moderate+ and a decent indicator for the chance for a strong+ El Niño in the absence of an ongoing/outgoing one as per this list:
Lowest 20 May SOIs since 1876/Nino peak
1896 -39 (oncoming strong)
1905 -34 (ongoing/oncoming mod)
1953: -26 (ongoing/oncoming weak)
1972: -24 (oncoming super)
1987: -20 (ongoing mod/oncoming strong)
1997: -19 (oncoming super)
1991: -18 (oncoming strong)
2023: -15 (???)
1897: -15 (outgoing strong)
2002: -14 (oncoming mod)
2015: -13 (ongoing weak/oncoming super)
1940: -13 (ongoing mod/oncoming strong)
1947: -12 (outgoing warm neutral)
2005: -12 (outgoing weak)
1994: -12 (oncoming mod)
1957: -12 (oncoming strong)
1951: -12 (oncoming mod)
1912: -12 (outgoing mod)
1929: -11 (oncoming weak)
1946: -10 (oncoming warm neutral)
----------------------------
I'll now take out ongoing/outgoing El Niño years:
1896 -39 (oncoming strong)
1972: -24 (oncoming super)
1997: -19 (oncoming super)
1991: -18 (oncoming strong)
2023: -15 (???)
2002: -14 (oncoming mod)
1947: -12 (outgoing warm neutral)
1994: -12 (oncoming mod)
1957: -12 (oncoming strong)
1951: -12 (oncoming mod)
1929: -11 (oncoming weak)
1946: -10 (oncoming warm neutral)
------------------
Data source:
Great work, Larry!
actually, it was very generous of you to take all that data, analyze, then summarize the results For us to make them profoundly useful In the discernment process!
thanks very much!
This fits well with all the other info telling us about the El Niño.
NOAA updated yesterday and I’ll have that when back in the office.
one thing that sticks out as making this event unique are the cold anamolies in the Pacific off the California coast At the same time as the El Niño.
this is causing the -PDO as Jean mentioned!
not sure that this has ever happened in recent years and what the weather impact will be.
however, if you want to figure out upcoming seasonal weather impacts, the temp configuration in the Pacific, that contains more than half of the heat on this planet (not counting geothermal) is the best place to start.
that cool pocket could play a role in modulating the El Niño or diverting it.
Not much time to start a new ENSO thread.
Here's the update:
 Philip Klotzbach@philklotzbach
·
#ElNino onset is likely imminent. Currently there are very warm subsurface temperature anomalies and hints of another downwelling (warming) oceanic Kelvin wave. High chance of a robust #ElNino is why CSU's forecast is for a near-normal season, despite an extremely warm Atlantic.
·
Curious about how El Nino affects the globe? Rest assured that there is an ENSO Blog post on the topic.https://climate.gov/news-features/blogs/enso/how-enso-leads-cascade-global-impacts
·
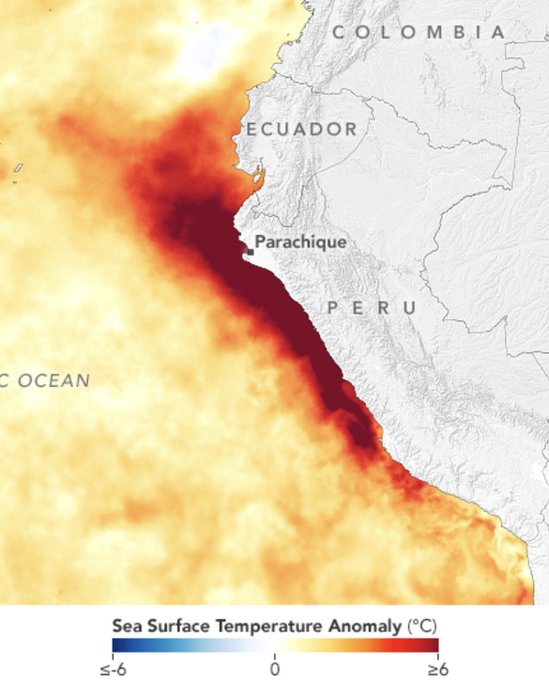
A complete shutdown of cold water ocean upwelling off the coast of Peru is the sign of a strong impending El Niño... It was along this coast that the phrase was first coined by colonial Spanish fishermen. This is a huge anomaly.
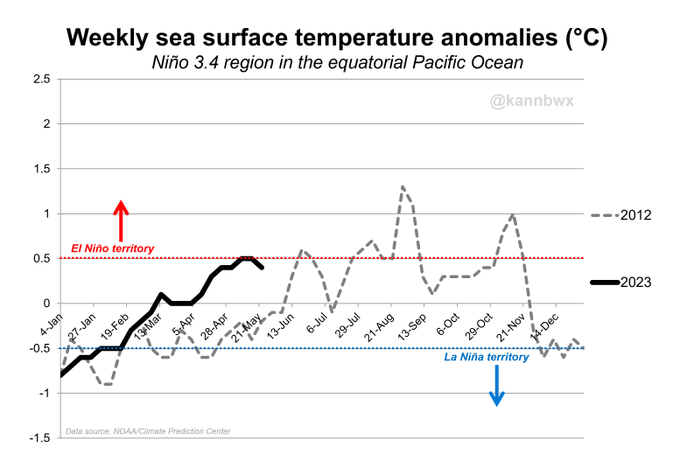
Mid-2012 featured a borderline #ElNino event, similar to the current ENSO status. El Nino is expected to eventually strengthen well beyond the 2012 levels, but the trade winds have not yet supported that move and they aren't forecast to do so through at least mid-June.
24 hour Nino 3.4 SSTa changes per Levi Cowan's CDAS graphs 6Z to 6Z:
5/29 to 5/30: +0.039
5/30 to 5/31: +0.023
5/31 to 6/1: +0.049
6/1 to 6/2: +0.009
6/2 to 6/3: +0.023
6/3 to 6/4: +0.036
6/4 to 6/5: +0.033
6/5 to 6/6: +0.084
Thanks, Larry. Great site!
We can find that data from Levi Cowan here:
https://www.tropicaltidbits.com/analysis/ocean/
Latest ENSO update from NOAA:
CPC officially declares El Niño:
https://www.cpc.ncep.noaa.gov/products/analysis_monitoring/enso_advisory/ensodisc.shtml
ENSO: Recent Evolution,
Current Status and Predictions
Similar to previous reports........just a bit warmer each week.