 Climate Dispatch
Previous monthly global temp thread:
https://www.marketforum.com/forum/topic/95856/
Waiting for this one to come in, as it's delayed for some reason and I have expectations of a rapid increase in atmospheric temperatures the rest of this year and in 2024 because of the strengthening El Nino(warm water anomalies in the E/C tropical Pacific) and warm water anomalies in the Atlantic.
These anomalies are FROM NATURAL CYCLES, with just over 1 deg. C of warming superimposed on them from global warming, otherwise known as climate change.
The long lived La Nina, featured unusually cool water anomalies in the tropical Pacific(biggest ocean storing heat) for several years, which caused a pause/slight cooling in global temps/warming. The pause is about to break. On a commodities trading price chart, the pause would be akin to a bull flag and we are about to break out to the upside in the next few months on our way to new highs for global temperatures.
++++++++++++++++++++++++++++++++
The oceans store 1,000 times more heat than the atmosphere.
They are 70% of the surface, with water having a specific heat that's 4 times more than the air. So you might not think they store that much more but the oceans are DEEP!
The atmosphere thins with decreasing pressure(less heat holding capacity) as you go up and the oceans have massively, crushing increases in pressure as you go down. Note the Titanic submarine being easily crushed under a pressure hundreds of times the pressure at the surface.
https://scholarsandrogues.com/2013/05/09/csfe-heat-capacity-air-ocean/
Using this, we can multiply the mass of the atmosphere times the specific heat of the air to calculate what the total heat capacity of the atmosphere is:

In other words, it takes about 5.95 x 10²¹ Joules to raise the temperature of the atmosphere one degree Celsius.
For ocean we need to add one step – multiplying the volume of the water by its density to get the total mass of the ocean

This shows that the heat capacity of the oceans is about 1000x larger than the heat capacity of the Earth’s atmosphere.
++++++++++++++++++
LOL GASP! I CAN HEAR 'EM, ALREADY ~ "WE'RE ALL GONNA DIE!"
HAHHAHAHAHAAAAAAAAAAA
Hey Mike,
I just saw the following posted at a wx bb. Do you think this is legit accuracywise?
https://climatereanalyzer.org/clim/t2_daily/
Thanks in advance and Happy 4th!
Hello wx
I have some questions about that data.
1Why is the world warmer July 1 to Aug. 1in the whole world?
2 Why is it from vs 2 reanalysis. Wouldn't you expect raw data?
NCEP Climate Forecast System (CFS) version 2 (April 2011 – present) and CFS Reanalysis (January 1979 – March 2011)NCEP Climate Forecast System (CFS) version 2 (April 2011 – present) and CFS Reanalysis (January 1979 – March 2011)
cutworm asked:
"Why is the world warmer July 1 to Aug. 1in the whole world?"
---------------------
Excellent question. It is because it is the N Hemisphere's warmest month. Although it is near the S Hemisphere's coldest month, the S Hemisphere when averaged out has only about half the variation of the N Hemisphere due to much less land area. So, when the two hemispheres are averaged out, the N hem's larger variation means it drives the global temp by month. So, for the same reason, January is the coldest month globally.
You took the words out of my mouth(off the keyboard), Larry!
Exactly right.
https://rwu.pressbooks.pub/webboceanography/chapter/1-1-overview-of-the-oceans/
All of this water is not distributed equally over the Earth; 61% of the Northern Hemisphere is covered by oceans, while in the Southern Hemisphere the oceans cover 81% of the surface area (Figure 1.1.1).
Regarding this source.
It looks like they have some wonderful products with just a brief glance at their stuff.
With regards to the methods used to generate their products and accuracy related to both Larry and cutworms question:
This is like the 100 trillion dollar question. Which method and which data set is the best for calculating global temperatures?
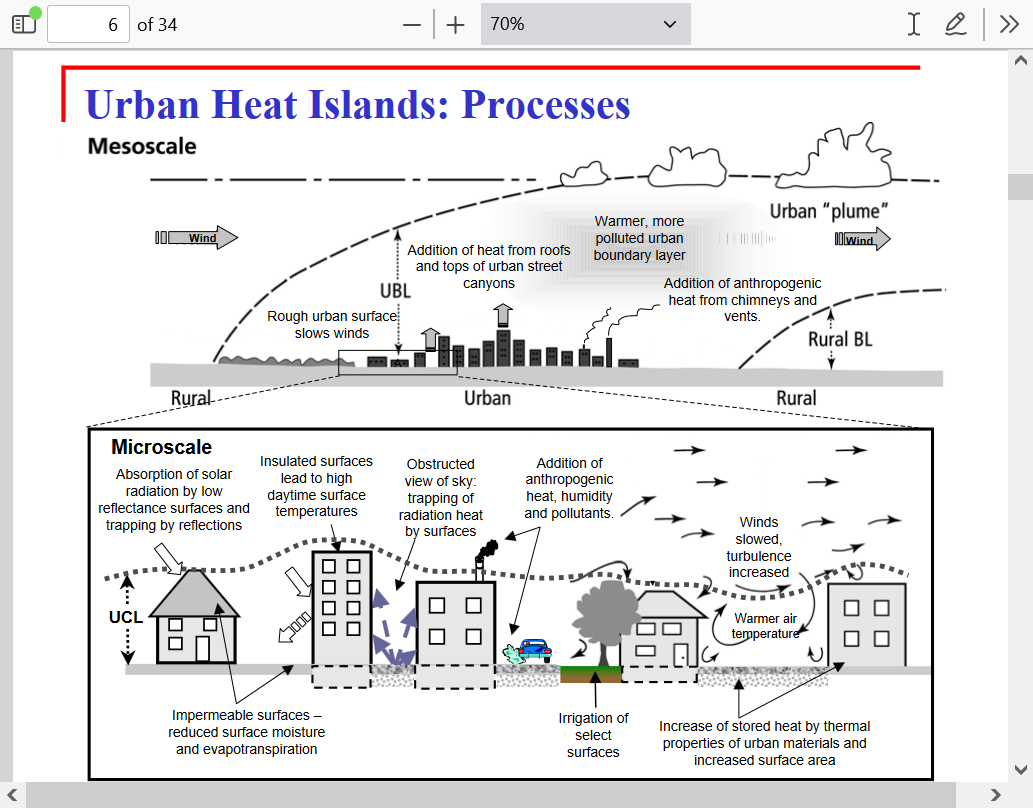
Using just raw data from surface thermometers will incorporate a big UHI(Urban Heat Island effect) for the older stations which had massive cities develop around them since those sites began measuring temperature. So there is a correction factor that is applied to data sets to attempt to offset this but its impossible to do it perfectly.
Global warming for urban areas has been much greater than global warming for rural areas.
In addition, you have large data scarce gaps where surface thermometers are very spread out. In the highest latitudes, deserts and oceans for instance.
And changes in the technology and methods.
I've always preferred the UAH satellite data which is not surface data. It's the lowest level of the troposphere, which goes up as high as 5 miles?
There's been a case to be made about that not being where the people live at the surface, which matters the most but thats a big reason for why I like it for helping determine legit greenhouse gas warming that takes out all the other kinds of warming coming from humans at the surface unrelated to the greenhouse warming.
They can also measure remote data scarce regions much better than any other source.
https://en.wikipedia.org/wiki/UAH_satellite_temperature_dataset
The UAH satellite temperature dataset, developed at the University of Alabama in Huntsville, infers the temperature of various atmospheric layers from satellite measurements of the oxygen radiance in the microwave band, using Microwave Sounding Unit temperature measurements.
https://www.uah.edu/essc/weather-products/global-temperature-report
+++++++++++++++++
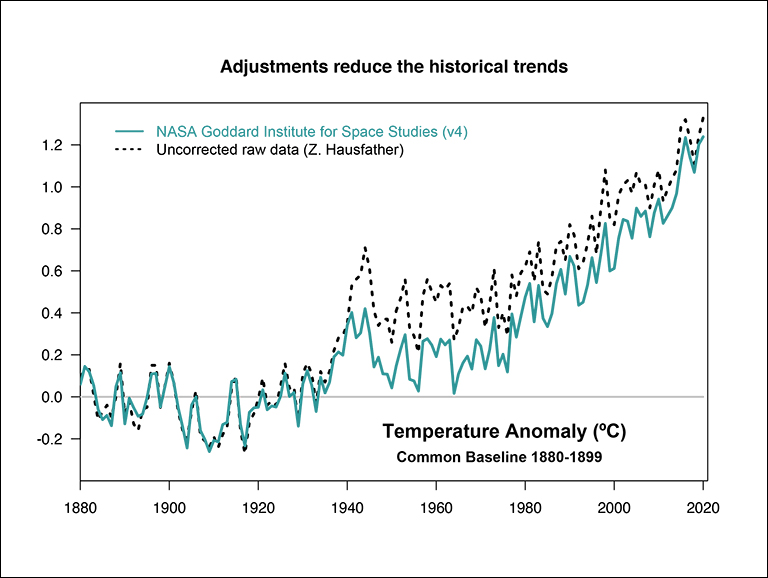
And constant adjustments that, of the hundred or so that I've seen, ALWAYS COOL THE PAST. Then, give an explanation to justify that often contradicts what they just did to make the adjustment.
Here's just 1 of the very many examples, this one from NASA. They claim to be reducing the historical trends when they did the opposite. They applied some sort of algorithm to suddenly, massively cool temperatures the greatest from the early 1940s- early 1970's. Looks like a downward correction of around .2 Deg. C for that entire, 3 decade period.
Any temperature trend line that you draw from that period to today (which has only minor downward adjustments) results in a steeper/greater temperature trend.
The rate of warming(trend line) is a huge deal, so this matters.
https://climate.nasa.gov/explore/ask-nasa-climate/3071/the-raw-truth-on-global-temperature-records/
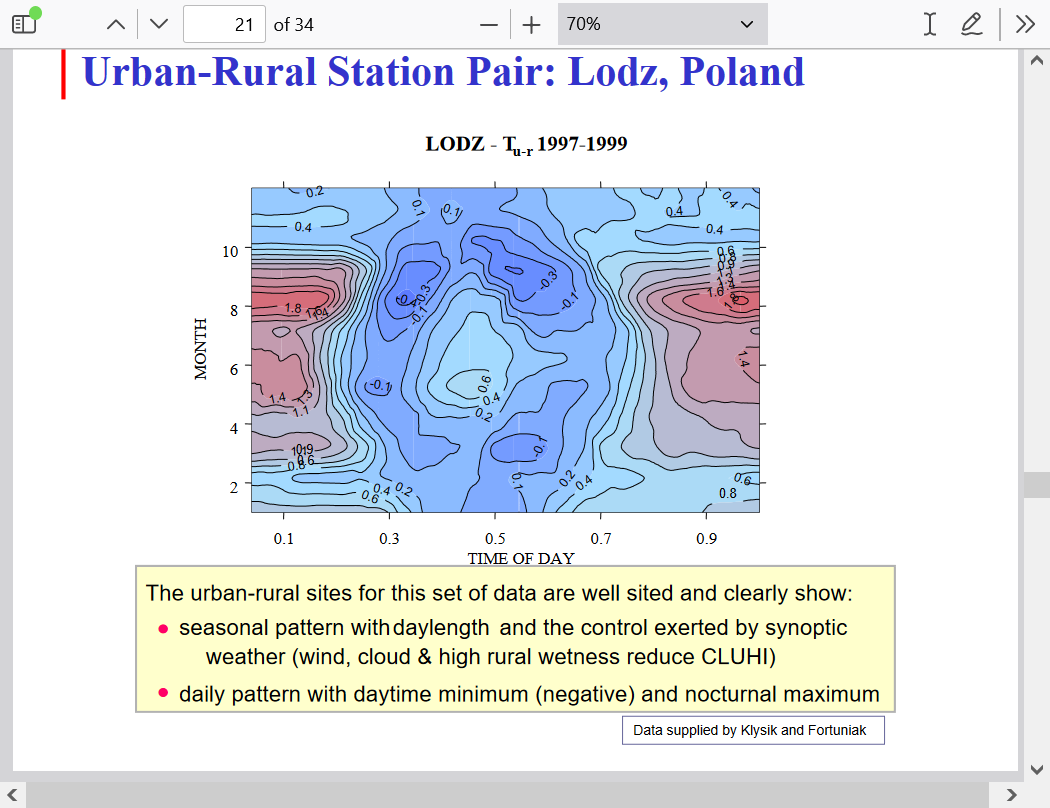
Here's a wonderful discussion on the UHI impact:
https://www.epa.gov/sites/default/files/2014-07/documents/epa_how_to_measure_a_uhi.pdf
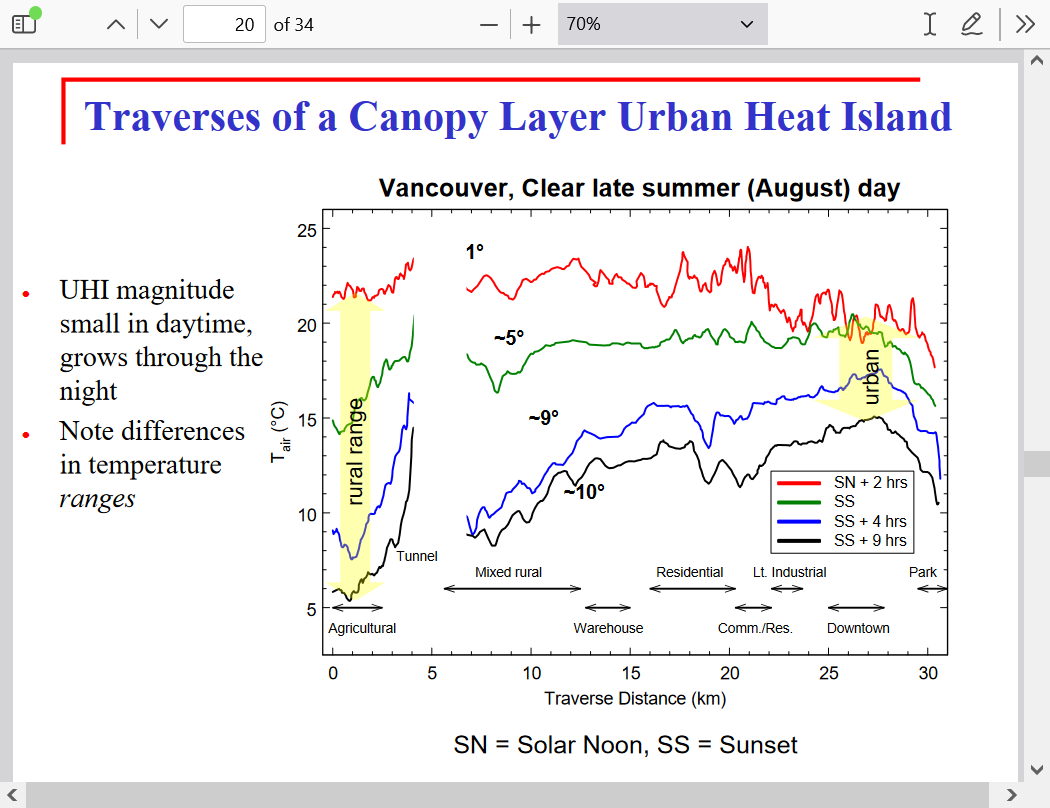
What is an Urban Heat Island?
• urban heat island—(Or heat island.) Closed isotherms
indicating an area of the surface that is relatively warm; most
commonly associated areas of human disturbance such as towns
and cities.
The physiographic analogy derives from the similarity
between the pattern of isotherms and height contours of an island
on a topographic map. Heat islands commonly also possess
“cliffs” at the urban–rural fringe and a “peak” in the most built-up
core of the city. The annual mean temperature of a large city (say
10 6 inhabitants) may be 1°–2°C warmer than before development,
and on individual calm, clear nights may be up to 12°C warmer.
The warmth extends vertically to form an urban heat dome in near
calm, and an urban heat plume in more windy conditions.
Another reason that I like the UAH data is that it makes more sense based on the physical laws/science and the actual measurements of the impact of the greenhouse gas warming from CO2 that were done which show the climate models are DOUBLING the actual warming compared to what we measured with accurate empirical data.
Yet, they just won't adjust the models to match the data. Instead, they try to adjust and manipulate data to exaggerate warming to amplify it.
Profound: SmokingGuns!! Proof with accurate 2 decade long measurement of the actual amount of radiative forcing caused by CO2 of 1 irrefutable reason for WHY global climate models continue to be too warm. Climate emergency is really about social justice and brainwashing people. Even MORE confirmation that climate models overstate atmospheric warming. Models clearly too warm yet incredibly programmed to get even HOTTER! August 2020 https://www.marketforum.com/forum/topic/57636/
RADIATIVE FORCING BY CO2 OBSERVED AT TOP OF ATMOSPHERE FROM 2002-2019
https://arxiv.org/pdf/1911.10605.pdf
"The IPCC Fifth Assessment Report predicted 0.508±0.102 Wm−2RF resulting from this CO2 increase, 42% more forcing than actually observed. The lack of quantitative long-term global OLR studies may be permitting inaccu-racies to persist in general circulation model forecasts of the effects of rising CO2 or other greenhouse gasses."
++++++++++++++
For them to not immediately dial this incredibly profound empirically measured, accurate data into climate models (instead, ignoring it and in fact, making adjustments that go farther in the WRONG direction) is evidence that climate science is incurably contaminated by politics, crony capitalism and corrupted scientists.
With regards to Larry's source/data, I'm assuming that this source appears to only be passing on tons of data which is a composite of numerous sources.
It probably suffers from some issues which plague the record related to amplifying the actual warming but I can't say how much without looking closer.
Eye balling the graph/data and checking the individual lines that show 2016 as the previous warmest for more months than any other year......... lines up close enough to reality(2016 was the warmest year in the records) to trust the crystal clear message we get for the graph today.
That message is that the global temperature anomaly is rapidly increasing right now.
It's extremely likely that the dark black line representing 2023 will stay elevated above the other lines (or just below the highest briefly) for the next 18 months.
With the oceans so warm, it's impossible to think of why that won't be the case.
+++++++++++++++
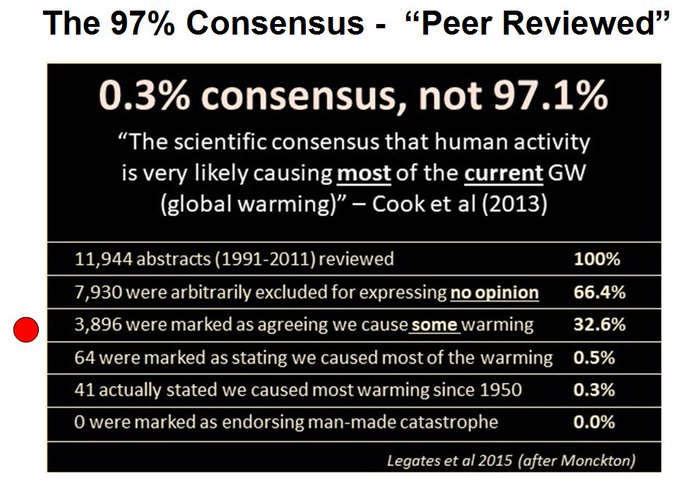
Below is an example of the worst junk science and blatant climate DISinformation. John Cook who runs this site is a very dishonest, biased man pretending to be an objective scientist.
His true objective, as a climate charlatan is to trick people with convincing sounding, deceptive interpretations of data and narratives that massively exaggerate almost every element.... into thinking that we have a major climate crisis.
In spite of many people like him out there, ampifying and exaggerating the impact of global warming, there are also many true climate deniars.
People that really don't think the planet is warming, which is really ignorant.
Not quite as ignorant but still anti science is the belief that humans are not responsible for much if any warming.
The planet has warmed by just over 1 Deg. C the past 100 years.
The clear evidence based on the atmospheric physics/chemistry of CO2 and its ability to keep surface heat from escaping to space is that the 100 parts per million increase in CO2 MUST HAVE been responsible for at least half the warming.
The Grand Solar Maximum could have warmed the oceans more than we think and caused it to store extra heat.........which comes out to heat the atmosphere, like we're seeing exactly right now.
The more active sun and stronger solar wind deflected more Galactic Cosmic Rays which act as condensation nuclei for clouds to form. This MIGHT HAVE reduced cloud cover and increased solar radiation to heat the oceans. If this happened to any extent, all it did was add to the magnitude of the greenhouse gas warming.
Also, the Clean Air Acts began enforcement in the 1970s(after 3 decades of slight cooling and increasing pollution).
Previously, increasing pollution, especially from sulfur oxides was blocking X amount of solar radiation and likely was a factor in the global cooling for 3 decades(1940s-70s)
When that pollution went away, we had solar brightening and more surface heating from the stronger sun which, at the very least added to the magnitude of the greenhouse gas warming in the 1980s/90s which were the 2 decades with the fastest warming.
Global climate models were programmed with the assumption that ALL of it in the 80's/90's was from the increase in CO2. When the warming slowed down after that and even paused for a decade+, they wouldn't change the over amplifying equations in the models.
Instead, we suddenly got all these adjustments to cool previous decades to justify the warming rate(and other tricks) instead of dialing in the new data by adjusting the mathematical equations so the models better match the data.
https://www.drroyspencer.com/2014/02/95-of-climate-models-agree-the-observations-must-be-wrong/
July 5th, 2023 by Roy W. Spencer, Ph. D.
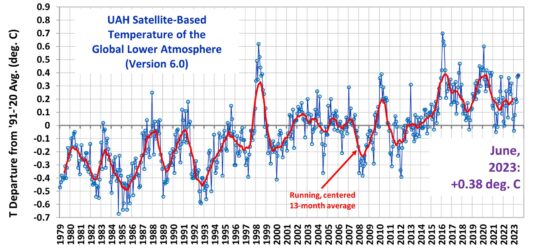
The linear warming trend since January, 1979 remains at +0.13 C/decade (+0.12 C/decade over the global-averaged oceans, and +0.18 C/decade over global-averaged land).


From NOT A LOT OF PEOPLE KNOW THAT
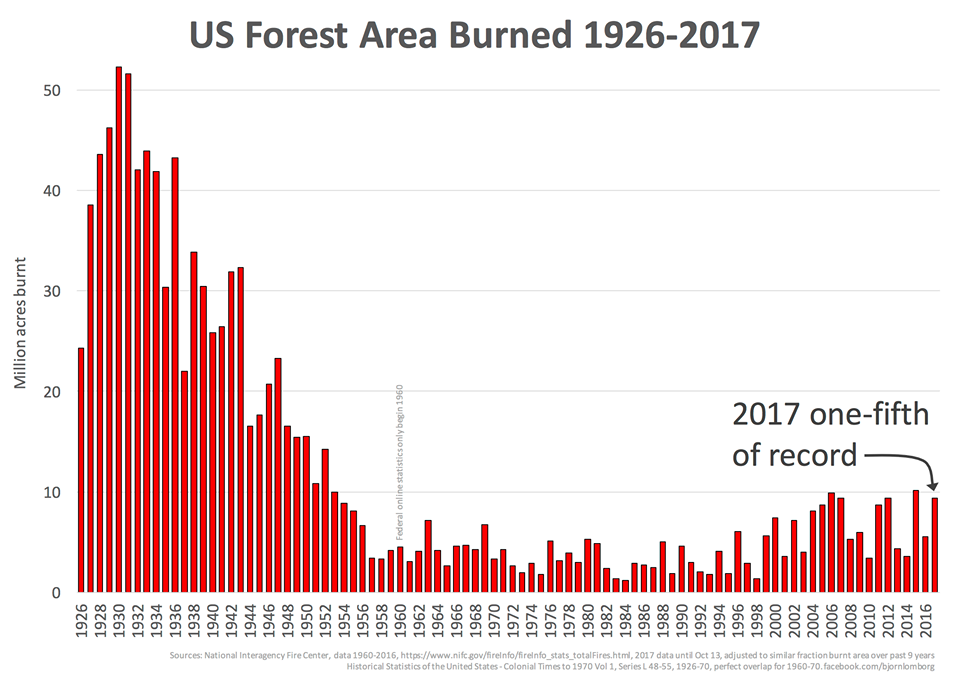
https://wattsupwiththat.com/2023/06/11/what-the-media-wont-tell-you-about-wildfires-roger-pielke-jr/
As we have come to expect from Roger, this is another thorough, well researched and objective analysis. He makes the following points:
You can read the full analysis here.
The Collapse of Climate-Related Deaths: Deaths have ‘fallen over 90% since 1920’

https://www.cfact.org/2017/10/17/fires-far-worse-last-century/
97% was a #ClimateScam. I've written some abstracts and reviewed many. Unless you read the Conclusions, you often miss important data, which is why authors complained about how their studies were graded. Plus, here's one of the many, independent studies made with the same papers.
The MSM's bs alarmism/sensationalizing of the weather the last few days, in the hottest month of the year, turning it into more climate crisis crapola.
Can you imagine if this below happened today? It's less likely because climate change and the current climate OPTIMUM is helping to PROTECT US!
The planet had a REAL climate crisis between 1876 and 1878.
50 million people died. 3% of the global population died from that real climate crisis!
https://news.climate.columbia.edu/2017/12/15/causes-great-famine-drought/


https://ui.adsabs.harvard.edu/abs/2017AGUFMGC51F..04S/abstract
The 1876-1878 Great Famine impacted multiple regions across the globe including parts of Asia, Nordeste Brazil, and northern and southern Africa, with total human fatalities exceeding 50 million people, arguably the worst environmental disaster to befall humanity.
NASA EXPLAINS THE DUST BOWL DROUGHT
https://www.nasa.gov/centers/goddard/news/topstory/2004/0319dustbowl.html
This is supposed to be a man made climate crisis for growing crops:
https://www.marketforum.com/forum/topic/86882/#87765
https://www.marketforum.com/forum/topic/87422/
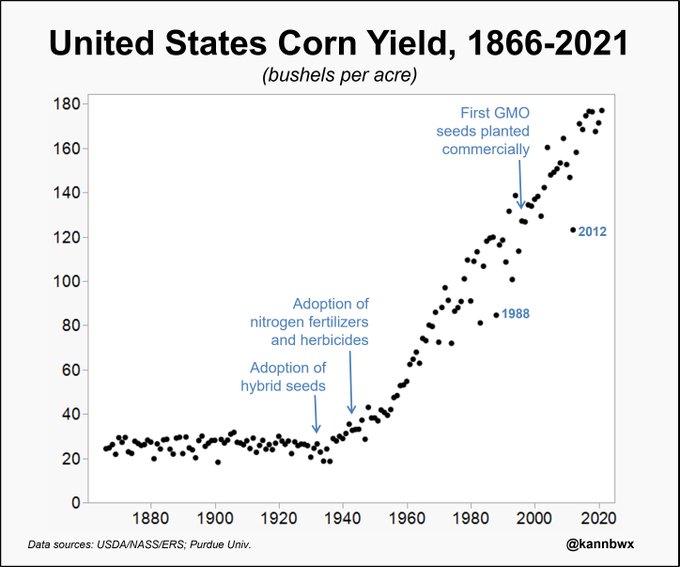
A brief history of U.S. #corn yield growth since the 1860s Notable growth in yields was seen after the adoption of modern fertilizers in the 1940s, which made drought years esp. in the 1980s stand out more than before (compare with 1930s Dust Bowl for example).
++++++++++++++++++++++++++++
And it's somehow worse than the 1930's NATURAL weather crisis(an entire decade called the Dust Bowl)?
https://www.marketforum.com/forum/topic/56668/#56673
https://www.marketforum.com/forum/topic/67004/

+++++++++++++++
https://www.marketforum.com/forum/topic/87422/#87425

https://www.marketforum.com/forum/topic/87562/#87825
The planet is greening up.
Cold still kills 15 times more humans and 200 times more life than does heat.
We are absolutely having a climate OPTIMUM for life on this planet by almost every authentic scientific definition.
The last 40 years have featured the best weather for life on this planet in more than 1,000 years, getting close to the best in the last 7,000 years. It was 2-3 deg. warmer than this in the high latitudes for much of the period between 9,000 to 5,000 years ago, with less Arctic ice and higher oceans FROM NATURE.
That's why that 4,000 year period has ALWAYS been referred to as the Holocene Climate OPTIMUM. We aren't even that warm yet and it's supposed to be a climate CRISIS!!
Crony capitalism, political agenda, sensationalizing media (for ratings and ideologies) and corrupted science have colluded with most global governments (China/Russia/India want no part of it-with China increasing beneficial CO2 faster than everybody else's cuts) to manufacture a FAKE climate crisis for greedy self serving interests. Literally hundreds of trillions for the taking. Biggest scientific fraud in history by a couple orders of magnitude.
++++++++++++++++++++
Holocene Climate Optimum
Warmer than this by 2-3 deg. C in the higher latitudes between 9,000-5,000 years ago.
https://en.wikipedia.org/wiki/Holocene_climatic_optimum
Of 140 sites across the western Arctic, there is clear evidence for conditions that were warmer than now at 120 sites. At 16 sites for which quantitative estimates have been obtained, local temperatures were on average 1.6±0.8 °C higher during the optimum than now. Northwestern North America reached peak warmth first, from 11,000 to 9,000 years ago, but the Laurentide Ice Sheet still chilled eastern Canada. Northeastern North America experienced peak warming 4,000 years later. Along the Arctic Coastal Plain in Alaska, there are indications of summer temperatures 2–3 °C warmer than now.[10] Research indicates that the Arctic had less sea ice than now.[11]
In the southwestern Iberian Peninsula, forest cover reached its peak between 9,760 and 7,360 years BP as a result of high moisture availability and warm temperatures during the HCO.[12]
As a result of rising sea levels and decay of ice sheets in the Northern Hemisphere, the East Asian Summer Monsoon rain belt expanded to the northwest, penetrating deep into the Asian interior.[13] Current desert regions of Central Asia were extensively forested because of higher rainfall, and the warm temperate forest belts in China and Japan were extended northwards.[14] In the Yarlung Tsangpo valley of southern Tibet, precipitation was up to twice as high as it is today during the middle Holocene.[15] Pollen records from Lake Tai in Jiangsu, China shed light on increased summer precipitation and a warmer and wetter overall climate in the region.[16] In the Korean Peninsula, arboreal pollen records the HCO as occurring from 8,900 to 4,400 BP, with its core period being 7,600 to 4,800 BP.[17] Sea levels in the Sea of Japan were 2-6 metres higher than in the present, with sea surface temperatures being 1-2 °C higher. The East Korea Warm Current reached as far as Primorye and pushed cold water off of the cooler Primorsky Current to the northeast. The Tsushima Current warmed the northern shores of Hokkaido penetrated into the Sea of Okhotsk
++++++++++++++++
I have many hundreds of links just like this that provide absolute proof.
Every year, the climate crisis bs peaks in the Summer because its the hottest time of year.
All we've done is superimpose 1 deg. of warming on the planet, which adds 7% more moisture(drought and wildfires have NOT increased) and massively greened up the planet by rescuing it from near CO2 starvation. At 420 parts per million, we are still less than half the optimal level for life, which is close to 900 ppm.
Same physical laws of the atmosphere. Same weather systems. Heavier high end rains(by 7% in some events), oceans rising at 1 inch/decade.
Slight increase for some hurricanes. 50% DECREASE for violent tornadoes because most of the warming is happening in the coldest places, which reduced the temp contrast and intensity of many high/mid latitude storms.
20%+ faster growth in most plants, including crops. 50% faster growth in many trees because woody stemmed plants benefit the most. Forests harvested 15-20 years ago for lumber, have shockingly regrown twice as fast as they did before climate change.
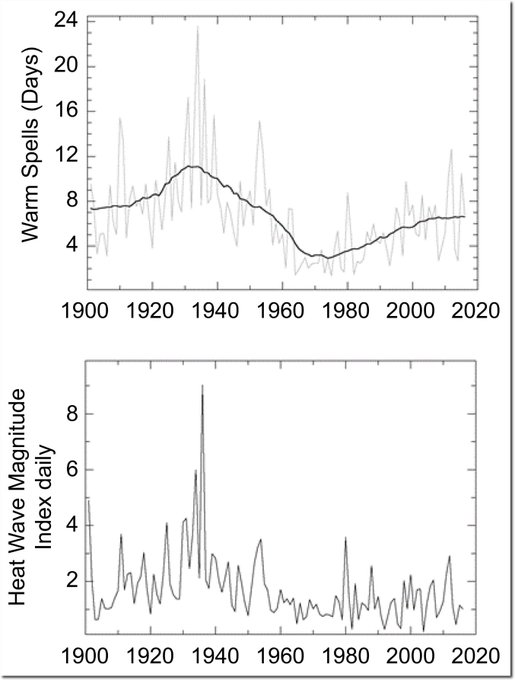
Speaking of heat, almost half of the all time hottest temperatures for each individual state were set in the 1930's AND STILL STAND in 2023.
https://en.wikipedia.org/wiki/U.S._state_and_territory_temperature_extremes
Since this graph above was made, in the last 20 years (since 2000) the following states have made their all time record highs: CO, SD, SC, OR and WA.
++++++++++++++++++++++++++++++
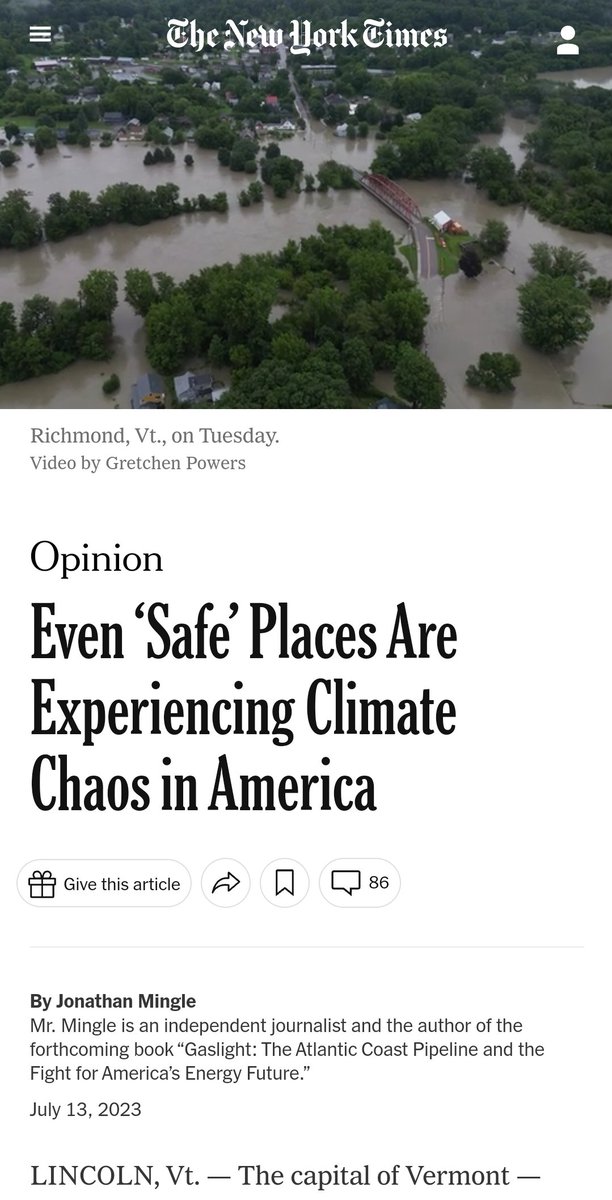
The past week continued to shatter heat records. The Fourth of July was the hottest day on Earth in as many as 125,000 years, as the global average temperature reached 62.92 degrees Fahrenheit, according to data from the University of Maine’s Climate Change Institute.
+++++++++++++++++
“It is certainly plausible that the past couple days and past week were the warmest days globally in 120,000 years,” University of Pennsylvania climate scientist Michael Mann said. He cited a 2021 study that says Earth is the warmest since the last age ended, and said Earth likely hasn’t been as warm dating all the way to the ice age before that some 120,000 years ago.
+++++++++
Michael Mann, the most dishonest climate scientist that I know of!
The National Oceanic and Atmospheric Administration on Thursday issued a note of caution about the Maine tool’s findings, saying it could not confirm data that results in part from computer modeling, saying it wasn’t a good substitute for observations.
+++++++++++++++
I would say that it's just a matter of time before we do set the record for the last 1,000 years (probably by next year) and this particular data set was heavily weighted towards some sources that are biased warm.
Scientists don’t understand and haven’t delved much into daily fluctuations, said Princeton University climate scientist Gabriel Vecchi. Much more meaningful to them are global data over months, years and especially decades.
“The fact that we haven’t had a year colder than the 20th century average since the Ford administration (1976) is much more relevant,” Vecchi said.
++++++++++++
This is true
Kathleen Hall Jamieson, director of the Annenberg Public Policy Center at the University of Pennsylvania, said immediacy of daily records is important.
“Tell me that yesterday was the hottest day on record and I can relate the claim to ways in which yesterday’s heat constrained my behavior,” she said. “I can’t do the same with monthly or yearly data. ... We experience the world hour-by-hour, day-by-day, not in monthly or yearly averages.”
++++++++
1 deg warmer is messing up her life? Ask all the other life forms on the planet, that die at a rate 200 times greater from cold vs heat and you'll get a completely different answer to that. There would be universal aggrement by all life to have even MORE CO2 not LESS.
15 times more humans still die from cold than from heat. Used to be 20 times before climate change.
Discussions about how official the records are aren’t as important as the public getting the message “that Earth is warming and humans are responsible,” said Max Boykoff, a University of Colorado environmental studies professor who tracks media coverage of climate change.
“The issue of climate change doesn’t often get its 15 minutes of fame. When it does, it’s usually tied to something abstract like a scientific report or a meeting of politicians that most people can’t relate to,” said George Mason University climate communications professor Ed Maibach.
++++++++++++++
Does this guy ever read/watch the news??? ABC Nightly News sensationalizes the weather on more than half of their shows and refers to climate change as the cause whenever its from heat, excessive precip, severe weather, hurricanes, wildfires and even extreme cold.
“Feeling the heat — and breathing the wildfire smoke, as so many of us in the Eastern U.S. and Canada have been doing for the past month — is a tangible shared public experience that can be used to focus the public conversation,” he said
++++++++++
I debunked that one here:
https://www.marketforum.com/forum/topic/96802/
How about some authentic climate science on the next page!
For the Medieval Warm Period(1,000 years ago) compared to today below:
Red balloons showed it was warmer.
Blue was colder than today(in that study)
Green was wetter/more precip
Yellow was drier
https://wattsupwiththat.com/2017/01/03/documenting-the-global-extent-of-the-medieval-warm-period/

If you go to the link below, you can hit those individual balloons and get each individual study:
+++++++++++++
Over 100 studies from the Medieval Warm Period, most of which show the planet was this warm or warmer 1,000 years ago. It was also this warm 2,000 years ago during the Roman Warm Period and also just over 3,000 years ago, during the Minoan Warm period. Medieval Warm Period Project: http://www.co2science.org/data/mwp/mwpp.php
 Where did the data from the bar graphs above come from so that we know that this is the authentic science vs the one that the MSM and dems describe with the fake climate crisis(where they can't show the data to prove)? List of Scientists Whose Work We Cite: http://www.co2science.org/data/mwp/scientists.php List of Research Institutions Associated With the Work We Cite http://www.co2science.org/data/mwp/institutions.php +++++++++++++++ If they want to state that it's the warmest in 1,000 years, I agree with that. But its clearly NOT warmer than 9,500 to 5,500 years ago (during the Holocene climate OPTIMUM in the high latitudes(which is where the greatest warming is today). https://en.wikipedia.org/wiki/Holocene_climatic_optimum | ||
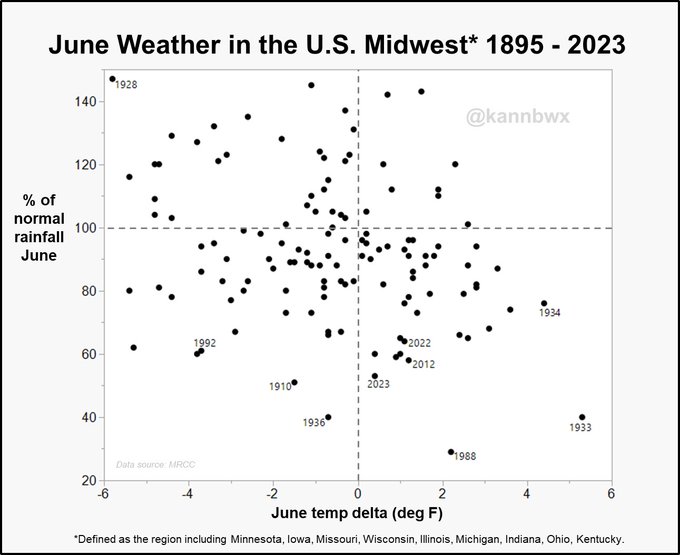
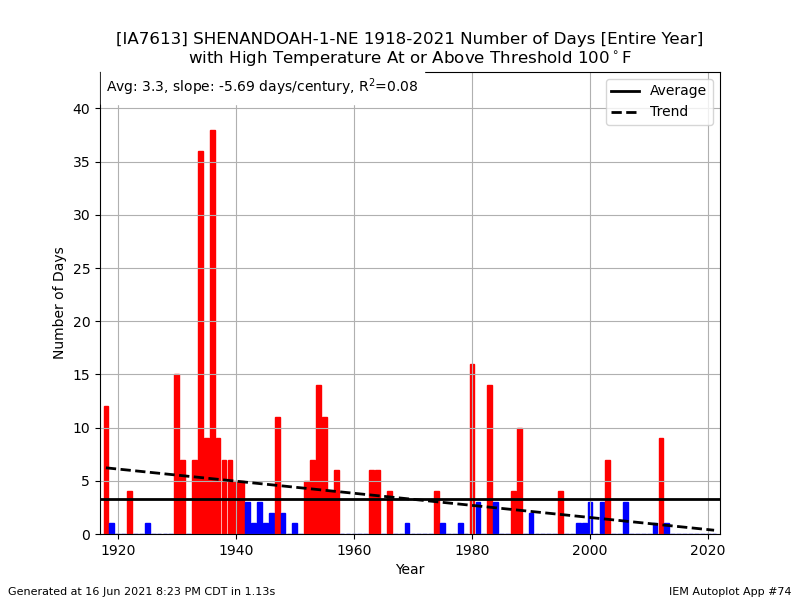
This wast just for the US Midwest
https://www.marketforum.com/forum/topic/97032/#97087
metmike: Note that the HOTTEST Junes were 1933, then 1934.
The driest Junes were 1988, 1933 and 1936.
The hottest/driest July's were in the 1930's with 1936 standing out easily as #1.
+++++++++++++
I found this post/meme pretty funny!
Mentally ill people often believe their imaginary world is real, and everyone else is crazy.#ClimateScam
https://www.foxnews.com/politics/kerry-blasted-fretting-climate-change-effects-ukraine-war
Top British climate official says moving too quickly to green energy will 'simply impoverish people'
Energy transition is a hoax
Started by metmike - April 15, 2023, 5:50 p.m.
https://www.marketforum.com/forum/topic/94557/
There Is No Energy Transition, Just Energy Addition
https://wattsupwiththat.com/2023/03/12/there-is-no-energy-transition-just-energy-addition/
While wind and solar power are taking a larger piece out of a growing world primary energy pie, fossil fuels are expected to have more absolute growth through 2050.

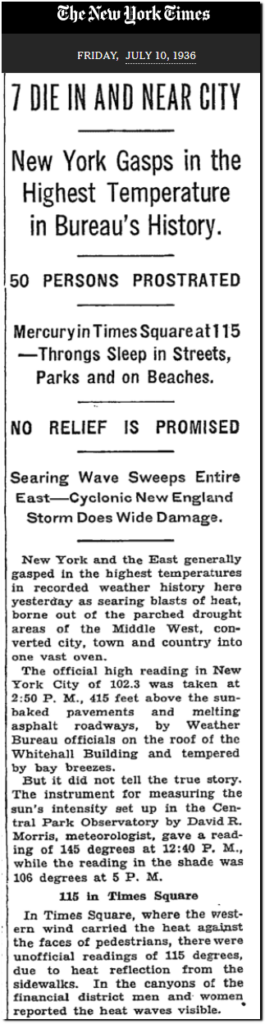
metmike: There was no air conditioning in 1936!!!
https://realclimatescience.com/2023/07/july-9-1936-hottest-day-on-record-in-new-york-city-3/
Posted on July 10, 2023 by tonyheller
“7 DIE IN AND NEAR CITY
New York Gasps in the Highest Temperature in Bureau’s History.
50 PERSONS PROSTRATED
Mercury in Times Square at 115 —Throngs Sleep in Streets, Parks and on Beaches.
NO RELIEF IS PROMISED
Searing Wave Sweeps Entire East—Cyclonic New England Storm Does Wide Damage.
New York and the East generally gasped in the highest temperatures in recorded weather history here yesterday as searing blasts of heat, borne out of the parched drought areas of the Middle West, con- verted city, town and country into one vast oven.
‘The official high reading in New York City of 102.3 was taken at 2:50 P. M., 415 feet above the sun- baked pavements and melting asphalt roadways, by Weather Bureau officials on the roof of the Whitehall Building and tempered by bay breezes.
But it did not tell the true story. The instrument for measuring the sun’s intensity set up in the Central Park Observatory by David R. Morris, meteorologist, gave a reading of 145 degrees at 12:40 P, M., while the reading in the shade was 106 degrees at 5 P. M.
115 in Times Square
In Times Square, where the western wind carried the heat against the faces of pedestrians, there were unofficial readings of 115 degrees, due to heat reflection from the sidewalks. In the canyons of the financial district men and: women. reported the heat waves visible”
This is what professors teach nowadays.
 Prof. Eliot Jacobson@EliotJacobson
The 7 hottest days on Earth in the last 100,000+ years all happened in the last week: July 6 ~ 17.23°C / 63.01°F July 7 ~ 17.20°C / 62.96°F July 4 ~ 17.18°C / 62.93°F July 5 ~ 17.18°C / 62.92°F July 8 ~ 17.17°C / 62.90°F July 10 ~ 17.12°C / 62.81°F July 9 ~ 17.11°C / 62.79°F
+++++++++
As a reminder, metmike is an environmentalist! I realize many of these people really believe we have a climate crisis that's destroying the planet but the MSM, that used to have responsible, honest journalists that vet information have turned into sensationalizing alarmists fighting to stay relevant using anything to get attention in this new age which is seeing them die out.
Others, have found the new technology of communications great to control the way that people think..........telling them what they want to read/hear and telling them what you want them to think.
And people, that don't have hours to fact check.............just go to their favorite source telling them the things they already believe in.
The real environmental crisis's/insects dying-dead zones-aquifers drying up-plastics in the ocean-landfills/trash-over consumption of natural resources-REAL pollution in the air/soil/water-WIND TURBINES (metmike is a PRACTICING environmentalist): April 2019
The fake climate crisis, causes geniuses to lose their minds and turn into babbling fools because they are blinded with emotional, political nonsense:
https://www.livescience.com/59693-could-earth-turn-into-venus.html
Earth could turn into a hothouse planet like Venus, with boiling oceans and acid rain, if humans don't curb irreversible climate change, physicist Stephen Hawking claimed in a recent interview.
"We are close to the tipping point, where global warming becomes irreversible. Trump's action could push the Earth over the brink, to become like Venus, with a temperature of 250 degrees [Celsius], and raining sulfuric acid," he told BBC News, referring to the president's decision to pull the U.S. out of the Paris climate deal.
LOL I CAN'T EVEN STAMD TO LOOK AT JOHN KERRY ~ MUCH LESS LISTEN TO HIM!
WHAT A FREAK OF NATURE HE IS! *NO PUN INTENDED*
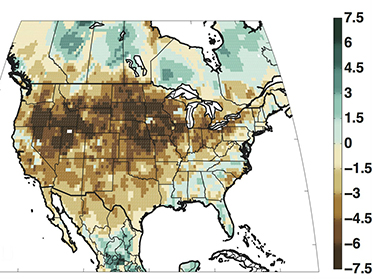
Climate DispatchRemember the Horrible June Texas Heat Wave? We now have the statistics and it was no big deal in either climate or weather terms. In fact, much of the northern third of the state was cooler than average! Big Climate would have you think this was Texas' hottest summer ever. Not even close. https://mikesmithenterprisesblog.com/2023/07/remember-horrible-june-texas-heat-wave.html
It was so awful that an Amazon worker nearly collapsed.


metmike: Below were the temperatures for the entire country compared to average for the month of June. 4+ times as many people live in the blue shaded areas than the brown/orange shaded areas.
https://www.cpc.ncep.noaa.gov/products/tanal/temp_analyses.php
Let's take a step back from the ledge: "climate chaos" is not a thing. Replace the hyperbole with "extreme weather" - and that's neither new nor escapable. We can forecast the weather, prepare for emergencies, and mitigate the potential impacts. However, NY Times climate coverage has (recently) become indistinguishable from "doomerism" and exacerbating anxiety among its readers. It is not rational or healthy, but apparently, it's a business decision to reorient the paper's focus to stoking climate change fear rather than educating the public on mitigating the impacts of extreme weather.
·
There is no evidence that there is more extreme weather now than in the past. Even the IPCC admitted this in their previous reports. People have just been conditioned to look for bad weather and associate it with “Global Warning” by the constant mainstream narrative in this… Show more
https://www.youtube.com/watch?v=fhiV5owv53M
"on climate at today's House hearing: - 'You want to spend $1.6 quadrillion on a problem that doesn't exist.' - Climate scientists 'are grifting like you are."
+++++++++++++++++
John Kerry gets exposed as a climate crisis fraud.
I'm even MORE interested in seeing what the July global temperature was. For sure it spiked higher. I use the satellite data for reasons mentioned above which is not surface data but the bottom of the atmosphere. Regardless these simultaneous marine heat waves are off the charts and I'm still not convinced of most of the explanations, especially the alarmists that 100% of the time, blame every extreme on climate change.
That one actually makes the least sense in some ways to a completely objective scientist. The planet took 100 years to warm 1 Deg. C, so its an extremely gradual process.
That 1 deg. C of warming is superimposed on oceans and atmosphere. CO2 is well mixed in the global atmosphere. It doesn't collect in pockets and warm those places more. Higher latitudes and deserts have amplified warming because the air is drier and water vapor(the dominant green house gas) plays less of a role. The oceans store heat and it comes out in events like El Nino.
But El Nino and heat coming out of oceans are NATURAL events. These current marine heat waves are extreme natural events. There's no physical explaination for why greenhouse gas warming collected in just those spots and is suddenly coming out amplified by the amount of heat that went in for just those locations when the places seeing amplified warming are all the driest locations(the complete opposite of marine locations which are the wettest locations). Marine locations are the most humid and water vapor is much more dominant as the greenhouse gas with CO2 much less.
I'll repeat this once again:
https://cliffmass.blogspot.com/2016/03/the-golden-rule-of-climate-extremes.html
The GoldenRule
Considering the substantial confusion in the media about this critical issue, let me provide the GOLDENRULE OF CLIMATE EXTREMES. Here it is:
The more extreme a climate or weather record is, the greater the contribution of natural variability.
Or to put it a different way, the larger or more unusual an extreme, the higher proportion of the extreme is due to natural variability.
+++++++++++++++
Despite this, I'm not ignoring elements of alarmist discussions that have good information. This guy is a really smart super alarmist that spouts off so much anti science stuff that it makes my head hurt..............but some of his stuff(that he misinterprets from extreme bias) communicates solid data like this below.
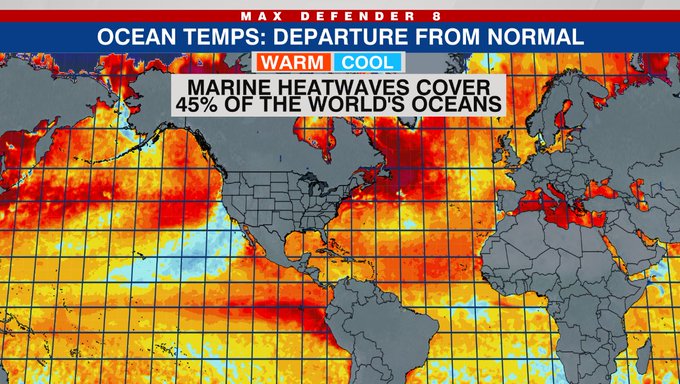
An astonishing 45% of global oceans are experiencing a marine heatwave right now (90th percentile of sea sfc temp in a given area). What is the normal extent of marine heatwaves around the globe? Just 10% coverage. It's been stunning summer. More on MHW http://marineheatwaves.org/all-about-mhws.html
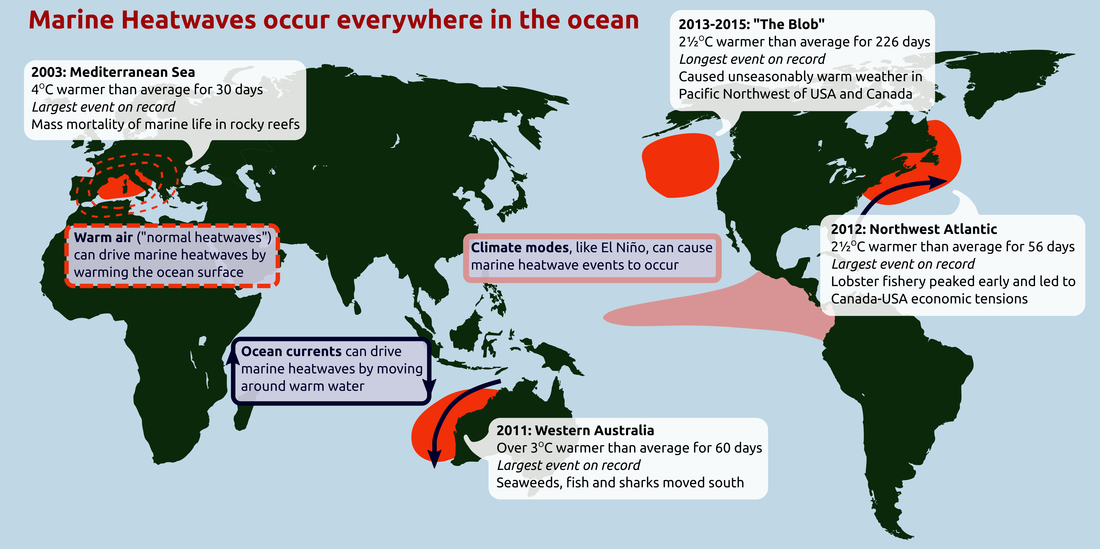
How do we measure marine heatwaves?We use a recently developed definition of marine heatwaves (Hobday et al. 2016). A marine heatwave is defined a when seawater temperatures exceed a seasonally-varying threshold (usually the 90th percentile) for at least 5 consecutive days. Successive heatwaves with gaps of 2 days or less are considered part of the same event.Hobday, A. J. et al. (2016), A hierarchical approach to defining marine heatwaves, Prog. Ocean., 141, pp. 227-238, 10.1016/j.pocean.2015.12.014 | 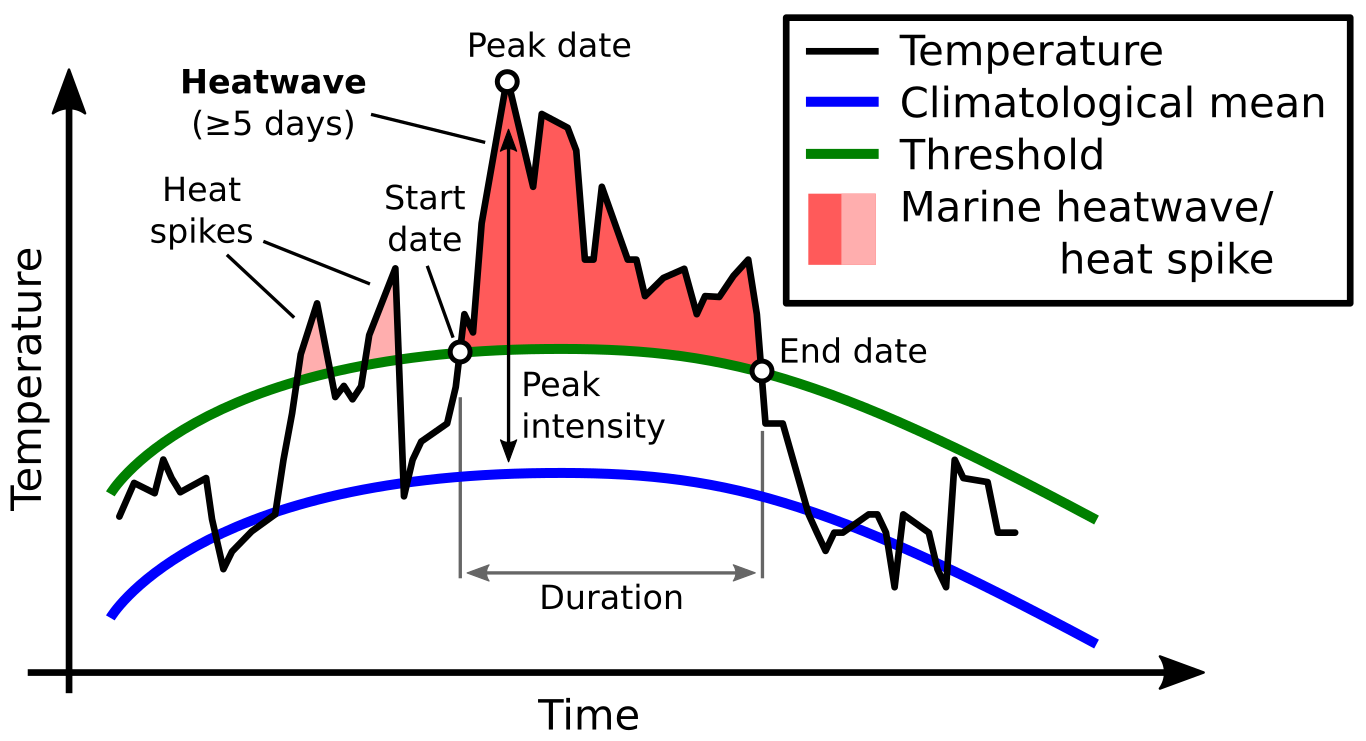 |
+++++++++++++++++
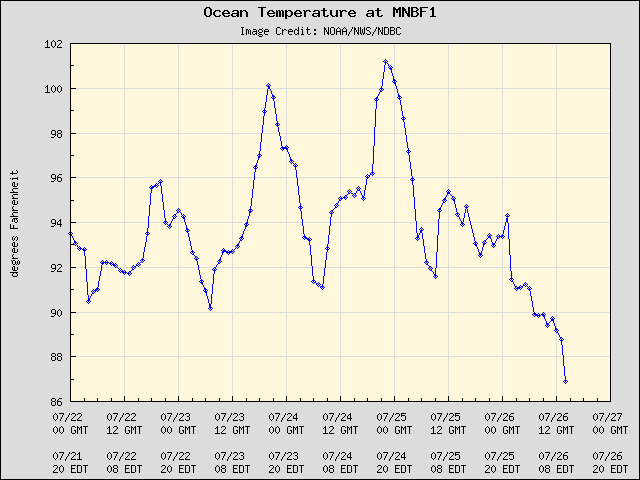
Jeff doesn't realize it but the information he provided actually shows that these marine heat wave spikes are from natural variation and not climate change. Otherwise, his last graph would not feature the temperature coming right back down to the previous temperature range after the marine heat wave spike was over.
The same thing applies in the oceans as in the atmosphere. They are both fluids that abide by the same physical laws, although its the atmosphere which is directly impacted by greenhouse gas warming from the physics of CO2, water and other gases.
https://en.wikipedia.org/wiki/Fluid_mechanics
It's extremely difficult for the atmosphere/air to warm the oceans/water because the short wave heat radiation doesn't penetrate and the heat capacity of air is so much less than water. However, the water can warm the atmosphere much more rapidly, as we will see with global air temperatures the rest of this year.......making new highs because of the oceans that warmed the air. The sun's much more powerful short wave radiation is a couple of orders of magnitude greater in heating the water because it can penetrade the water.
A great example was the diurnal temperature change with the very warm temp in Florida. The spikes up and down followed the sun. The wind and tides might be moving the water around but it was the power of the penetrating sun's short wave radiation that generated the heat for those spikes higher NOT climate change.
https://www.marketforum.com/forum/topic/97607/#97612
Larry and I have a good thread going about using authentic data here:
Record warmest water temp?
https://www.marketforum.com/forum/topic/97607/
I will use this thread for my fake climate crisis screeds (-:
Even after this reading has clearly been shown to not meet the standards, the MSM, including the weather channel continue to hype it.