I found this website a while back and it's rather amusing.
The entire point is to catalog as many climate crisis related extinction and world ending predictions as possible, along with their 'expiration date' and see how many have come true.
So far, none have come true, and the website gets updated fairly regularly.
Thanks, MM!
Despite them over forecasting and greatly exaggerating gloom and doom, they've managed to use it to generate tens of trillions of dollars the last 2 decades based on a justification of "saving the planet".
https://wattsupwiththat.com/2023/06/08/climate-anxiety-doomsday-cult-or-mental-illness/
Finally a real expert telling us the truth about Covid19: Greta on CNN. Scaring and converting children into the climate crisis cult. Eco-anxiety in children. Greta controlled as the United Nation's climate activist puppet. Failedpredictions of the UN and past climate crisis religion high priests, like Al Gore. Showing the truth with actual data/observations vs telling people to listen to the fake science. May 2020. https://www.marketforum.com/forum/topic/52100/
All these wild predictions that are busting.
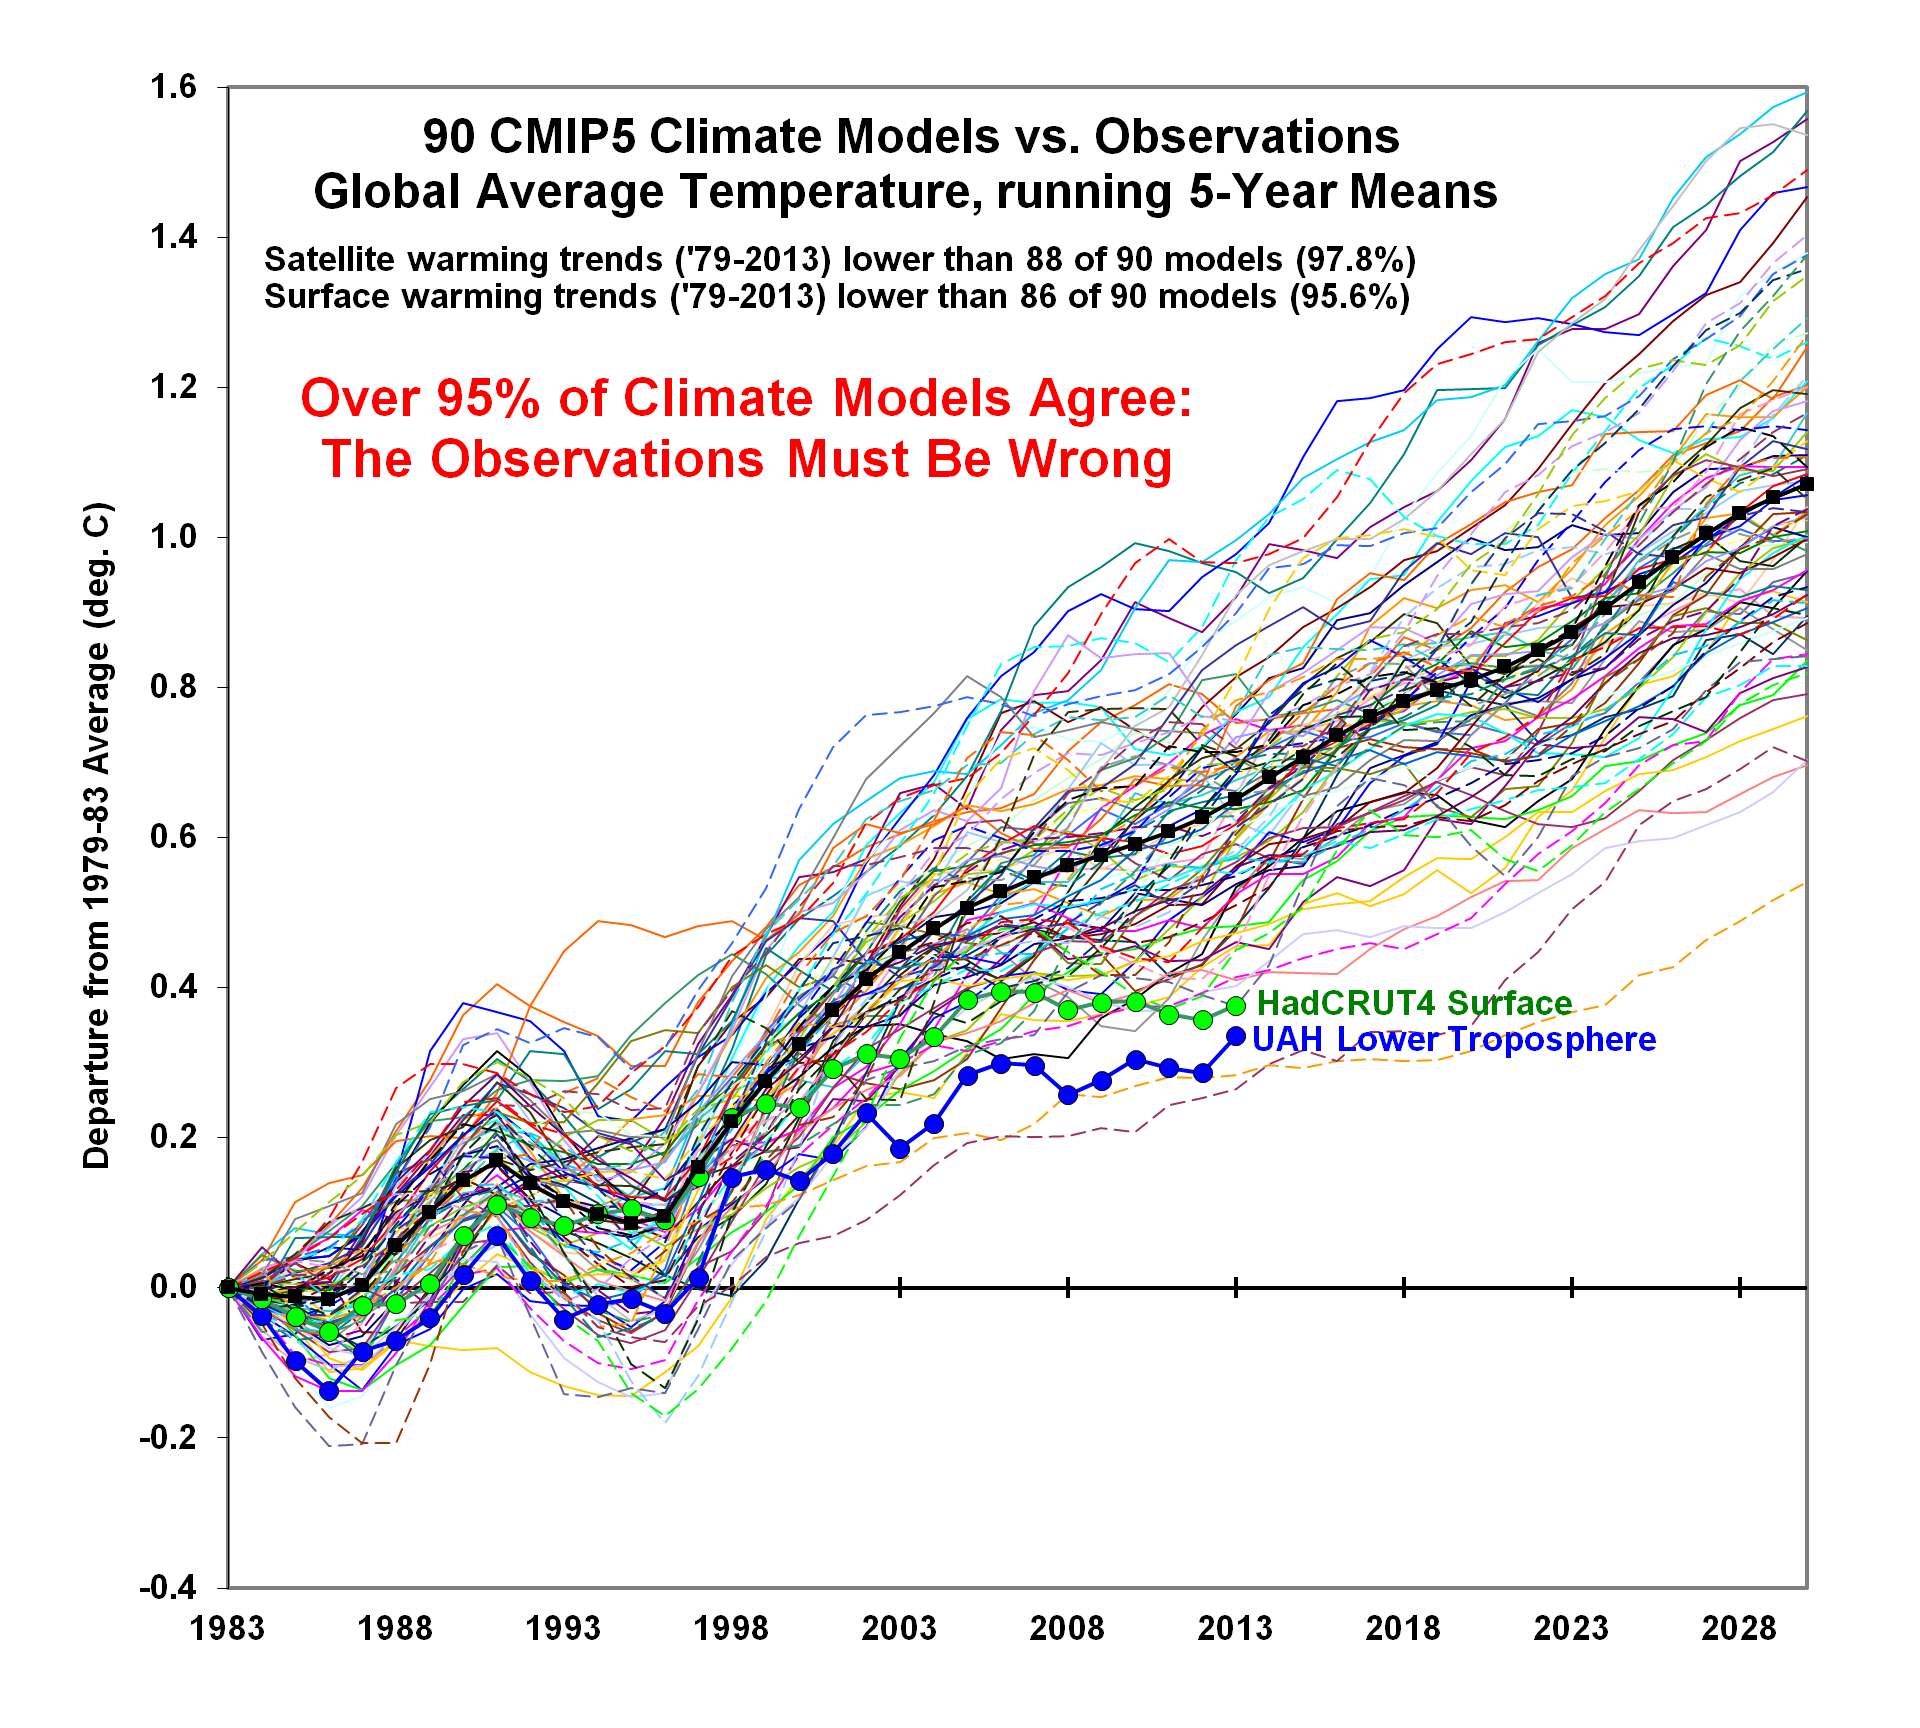
This is the one that will actually verify closely between now and 2100 but they refuse to pass it on because climate science is politics.
Global climate models are not based on authentic science. They've picked equations that amplify greenhouse gas warming by 42% MORE THAN the measured reality(empirical data/observations.
The projections below are from a VEGETATION model.
https://earthobservatory.nasa.gov/images/146296/global-green-up-slows-warming
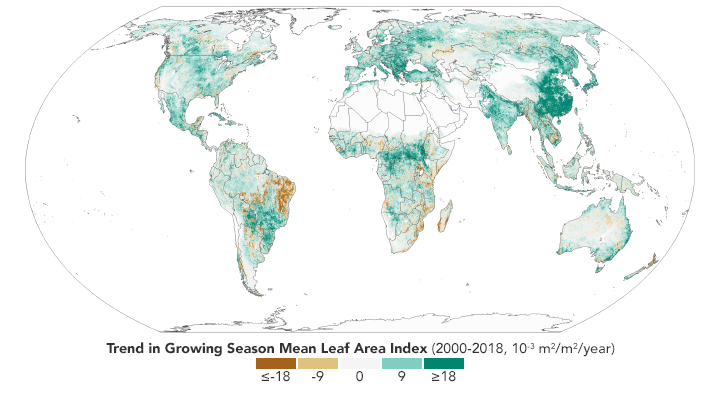
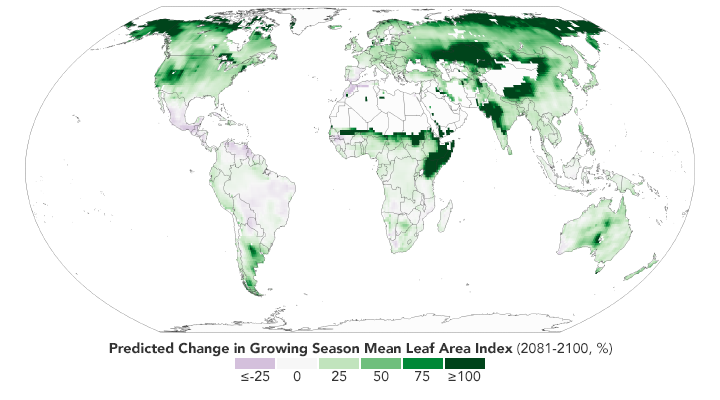
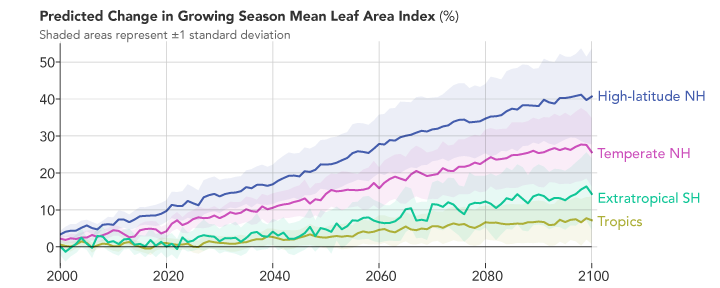
https://www.nature.com/articles/s43017-019-0001-x
"Vegetation models suggest that CO2 fertilization is the main driver of greening on the global scale"
+++++++++++++++++++++
https://www.drroyspencer.com/2014/02/95-of-climate-models-agree-the-observations-must-be-wrong/
 +++++++++++++
| Profound: SmokingGuns!! Proof with accurate 2 decade long measurement of the actual amount of radiative forcing caused by CO2 of 1 irrefutable reason for WHY global climate models continue to be too warm. Climate emergency is really about social justice and brainwashing people. Even MORE confirmation that climate models overstate atmospheric warming. Models clearly too warm yet incredibly programmed to get even HOTTER! August 2020 https://www.marketforum.com/forum/topic/57636/ RADIATIVE FORCING BY CO2 OBSERVED AT TOP OF ATMOSPHERE FROM 2002-2019 https://arxiv.org/pdf/1911.10605.pdf "The IPCC Fifth Assessment Report predicted 0.508±0.102 Wm−2RF resulting from this CO2 increase, 42% more forcing than actually observed. The lack of quantitative long-term global OLR studies may be permitting inaccu-racies to persist in general circulation model forecasts of the effects of rising CO2 or other greenhouse gasses." ++++++++++++++ For them to not immediately dial this incredibly profound empirically measured, accurate data into climate models (instead, ignoring it and in fact, making adjustments that go farther in the WRONG direction) is evidence that climate science is incurably contaminated by politics, crony capitalism, exaggerating media and corrupted scientists. |
The trickery of The Lancet’s Figure A is revealed by the CO2 Coalition’s revision in Figure B. Note that the X axis at the bottom in Figure A is in increments of 50 on the left (cold) side and in increments of 10 on the right (hot) side. This five-fold difference in scaling serves to exaggerate the number of deaths due to heat and minimize the cold-related deaths. This is technically correct, but intellectually wrong.
From The Lancet (Figure A):

From the CO2 Coalition (Figure B):

The effect of the miscalibration is readily seen by comparing the two graphs. The bars for heat deaths are much longer in Figure A than in Figure B, whose X axis is calibrated the same for both cold and heat deaths.
So, The Lancet misuses a chart – when rightly employed, a tool for clarifying information – to obfuscate the fact that cold is significantly more dangerous than heat. This chicanery by a supposedly premier medical journal is not acceptable in any scientific journal.
Sleep well; global warming is saving lives.
Gregory Wrightstone is a geologist; executive director of the CO2 Coalition, Arlington, VA; and author of Inconvenient Facts: The Science That Al Gore Doesn’t Want You to Know.
I just saw the watts up with that post about the lancet article the other night. Indeed very dishonest.
I am NOT defending what the lancet did, but they can rebuke any criticism they receive by saying "technically, we aren't lying about the data", but by manipulating the scales on each side of the 0 axis they are forcing the data to be displayed in a way that misleads the common reader who won't pay attention to axis scales.
Exactly,
This field is dominated by entities and gatekeepers dedicated to manufacturing narratives which perpetrate a political climate crisis narrative.
whatever they need to do to bamboozle the most people possible to maximize extraction of monetary and control resources for self serving enrichment.
that absolutely includes hiding all the benefits of the current climate optimum on our massively greening planet.
Many 100s of trillions the next decade.
this has corrupted these entities.
You and me can’t stop them but we only need to be proud of representing the truth And nobody can control our minds…..unless we let them.
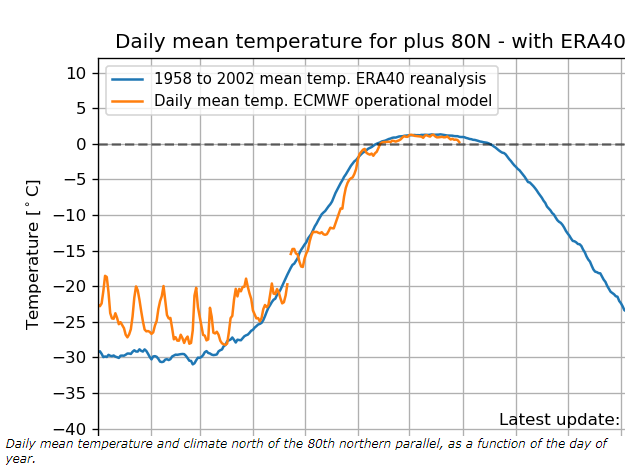
Temperatures at the North Pole are dropping down close to freezing about two weeks early. This may turn out to be the shortest summer on record at the North Pole, after the coldest May on record. #ClimateScam https://ocean.dmi.dk/arctic/meant80n.uk.php
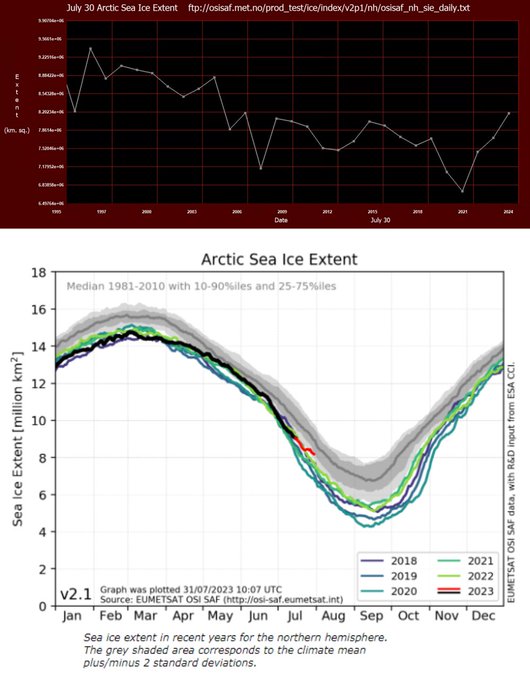
July 30 Arctic sea ice extent is the highest in seventeen years, and about the same as 1995. The Arctic melting #ClimateScam is collapsing. https://ocean.dmi.dk/arctic/icecover.uk.php
ftp://osisaf.met.no/prod_test/ice/index/v2p1/nh/osisaf_nh_sie_daily.txt
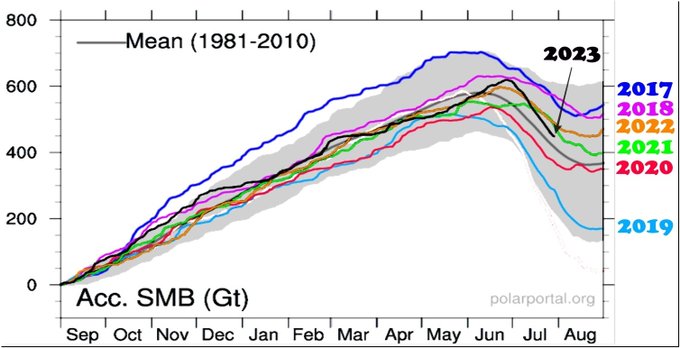
Over the past eleven months, the surface of the Greenland ice sheet has gained 450 billion tons of ice. This is the fifth year out of the last seven which ice gain has been above the 1981-2010 average. #ClimateScam http://polarportal.dk/en/greenland/surface-conditions/
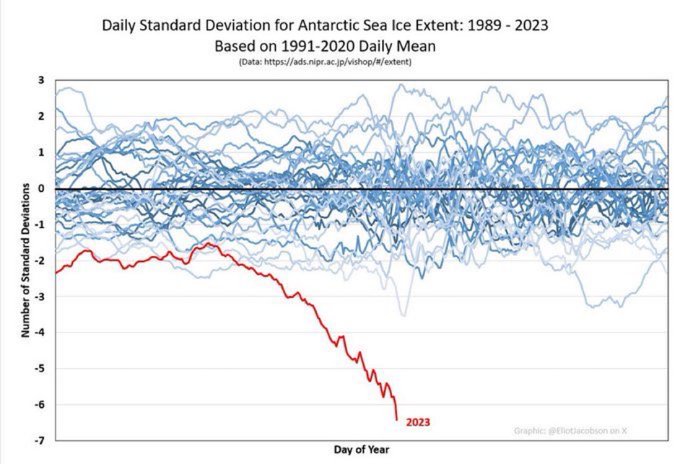
When scientifically illiterate people try to inappropriately normalize non-Gaussian distributed data you get brilliance like this:
++++++++++++++++++++++++++
Eric Feigl-Ding@DrEricDingAntarctic Sea Ice — look at that crash. Number explainer: for those who need a crash course in statistics—anything lower than X Standard Deviations means there is Y likelihood it deviated from normal sea ice levels by chance: -3 SD = 0.27% chance -4 SD = 0.0063% chance -5 SD = 0.000057% chance -6 SD = 0.0000002% chance Antarctic Sea Ice is now at -6.5 SD ==> 0.00000001% chance… or 1 in 10 BILLION chance this is a normal deviation. HT
#climate
#ClimateCatastrophe
#ClimateCrisis
#climatechange
metmike: These are supposed to be smart people telling us nonsense. As if a very slow warming of 1 deg. C over the past 100 years(was being stored and collecting in a few places) and suddenly comes out all at once in huge warm spurts. Every year, in all the places that we have expected, extreme warm anomolies.......THAT'S exactly where they report that climate change is causing it. please note that for 34 years, climate change DIDN'T cause this Record low ice.
In fact, Antarctic ice just set a new record high less than a decade ago……during climate change.
https://www.nasa.gov/content/goddard/antarctic-sea-ice-reaches-new-record-maximum
It's the complete opposite of what this guy claims!
+++++++++++++++++++++++++++++
It really boils down to this, once again(Cliff Mass can be counted on as an elite source for using objective, authentic science)
https://cliffmass.blogspot.com/2016/03/the-golden-rule-of-climate-extremes.html
The GoldenRule
Considering the substantial confusion in the media about this critical issue, let me provide the GOLDENRULE OF CLIMATE EXTREMES. Here it is:
The more extreme a climate or weather record is, the greater the contribution of natural variability.
Or to put it a different way, the larger or more unusual an extreme, the higher proportion of the extreme is due to natural variability.
Summers have been trending hotter since at least the 1940s, and especially the past decade. Even before July has ended, global average temperature this summer has already surpassed that of summer 2019 — the previous record — by nearly a quarter of a degree Celsius.
Kim Cobb, a climate scientist at Brown University who was not involved in the report, called the new July temperature record “eye-popping,” but warned that it will be broken again.
“It is scary to remember that in another decade, this will be viewed as a relatively cool year, most likely,” she said, adding, “if people don’t like what they’re seeing this summer, they will be in for quite a shock at the higher warming levels we’re heading for.”
Petteri Taalas, secretary-general of the WMO, said July’s extreme weather reveals “the harsh reality of climate change.”
Summers have been trending hotter since at least the 1940s, and especially the past decade. Even before July has ended, global average temperature this summer has already surpassed that of summer 2019 — the previous record — by nearly a quarter of a degree Celsius.
++++++++++++
How convenient to start their graph in 1941.

The Dust Bowl for almost an entire decade of the 1930's was the worse climate disaster in U.S. history BEFORE climate change. The current climate OPTIMUM is actually helping to protect us from another Dust Bowl.

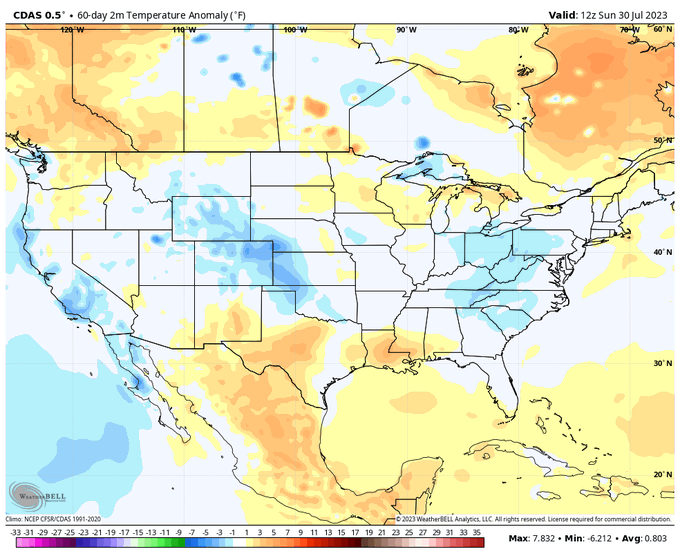
These were the temperatures thru yesterday for July 2023:
https://www.marketforum.com/forum/reply_post/97589/
https://www.wunderground.com/cat6/North-Americas-Most-Intense-Heat-Wave-July-and-August-1936
These were the temperature anomalies for July 1936.

Greatest climate crisis in history 1876-1878. 50 million died, 3% of the global population.

1876-1878 was shortly after the Little Ice Age ended with the global temperature 1 deg. C cooler than this and CO2 at 130 parts per million less than this.
Climate and the Global Famine of 1876–78
https://journals.ametsoc.org/view/journals/clim/31/23/jcli-d-18-0159.1.xml
During the late nineteenth century, a series of famines affected vast parts of Asia, causing mortality on a scale that would be unthinkable today (Davis 2001). Of these, the so-called Global Famine lasting from 1876 to 1878 was the most severe and widespread in at least the past 150 years (Hasell and Roser 2018; Gráda 2009; Davis 2001). The Global Famine inflicted acute distress upon populations in diverse parts of South and East Asia, Brazil, and Africa, with total human fatalities likely exceeding 50 million. These famines were associated with prolonged droughts in India, China, Egypt, Morocco, Ethiopia, southern Africa, Brazil, Colombia, and Venezuela (Davis 2001; Clarke 1878; Hunter 1877). Historical documentation indicates famine-related mortality between 12.2 and 29.3 million in India, between 19.5 and 30 million in China, and ~2 million in Brazil (Davis 2001), amounting to ~3% of the global population at the time. It was arguably the worst environmental disaster to ever befall humanity
++++++++++++++++++++++
These people continue to be completely denying that the current regime is a climate OPTIMUM for life and climate change is PROTECTING US.
They cherry pick every extreme and call it a climate crisis.
In June, it was cool in Phoenix but hot in Texas………..so all the reporters went to Texas to tell us about how hot it was and impossible without the climate crisis.
In July, the heat moved to Phoenix………so all the reporters moved their stories to Phoenix.
Wherever the heat goes, that’s where they report from and they use it to tell us the planet is on fire.
No……….just the usual natural variations in weather that have always happened, while they cherry pick the expected extremes and call them a crisis.
Today’s fake climate crisis is a picnic compared to much worse weather/climate events in the past BEFORE CO2 went up.
Speaking of picnics.
It was warmer than this in the higher latitudes of North America between 9,000 to 5,000 years ago by 2 deg. C (that’s a bit less than Hansen’s 1 million years). There was less Arctic sea ice. CO2 levels were lower. Thousands of years before the Industrial Age.
That’s why it’s called the Holocene climate OPTIMUM……BECAUSE it was so warm…..the way most life prefers it.
https://en.wikipedia.org/wiki/Holocene_climatic_optimum
 Wide Awake Media@wideawake_media
Multi-millionaire climate grifter, John Kerry, goes into full climate apocalypse mode: "Ten million people are dying every year around the world because of extreme heat. It’s getting hotter. There are going to be more intensive weather events… So as that happens, as people see their farms—you know, the crops—ripped away, or their homes destroyed, you watch the pressure grow." Except, it’s not the climate that’s ripping people’s farms away—that's being done by globalist sponsored climate totalitarians like John Kerry and (until recently) Mark Rutte, who are using the "human-induced climate change" lie as a trojan horse to wipe out independent farmers, with the ultimate goal of establishing total central control of the global food supply.
Source: https://youtube.com/watch?v=4B4ekDJKUxQ
For more content like this, visit: https://wide-awake-media.com#ClimateScam #ClimateCult #NetZero
++++++++++++++++
Speaking of predictions at the top and John Kerry:
Bernie's Tweets@BernieSpofforth
JOHN KERRY - There will be no ice left by 2014. Except …July 27th 2023 The Arctic sea ice extent is the highest in nineteen years, and in the normal range since 1981. Your fear is his profit!
The American Storm@BigJoeBastardi
Joe Biden declaring a climate emergency is completely baseless and would be based on ignorance, both his and the American people. Summer so far has been normal for much of the nation with an exceptional heat wave in one area over the last month. Congress should block any attempt
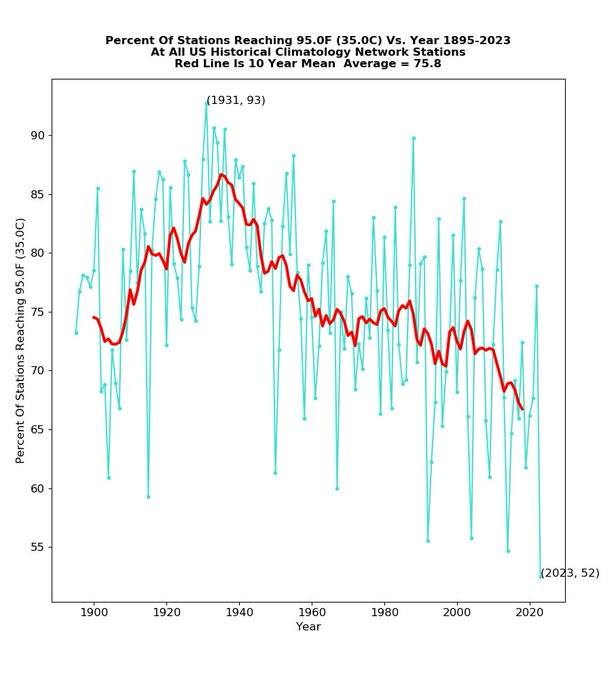
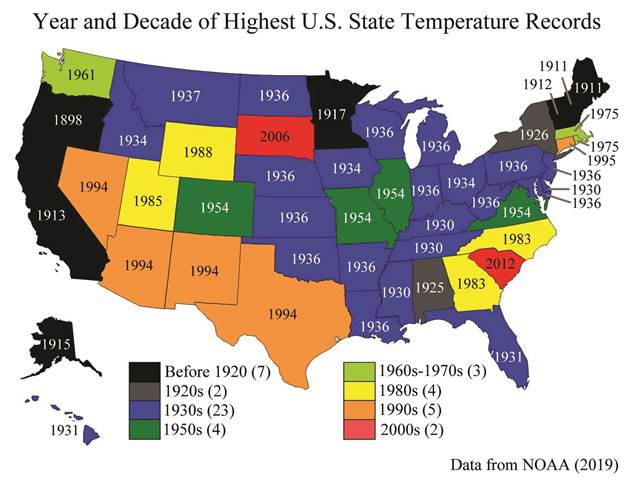
The percent of the US to have reached 95F (35C) so far this year continues at a record low 52%, down from 93% in 1931. #ClimateScam
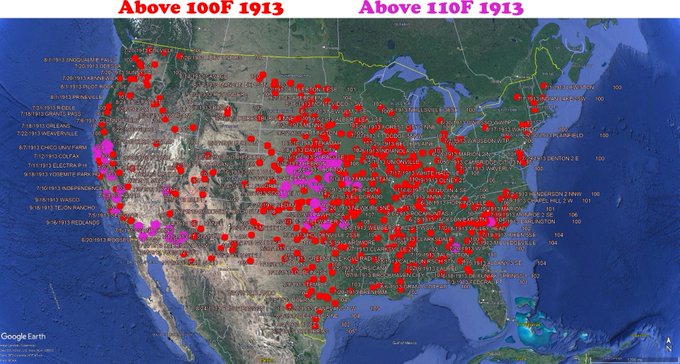
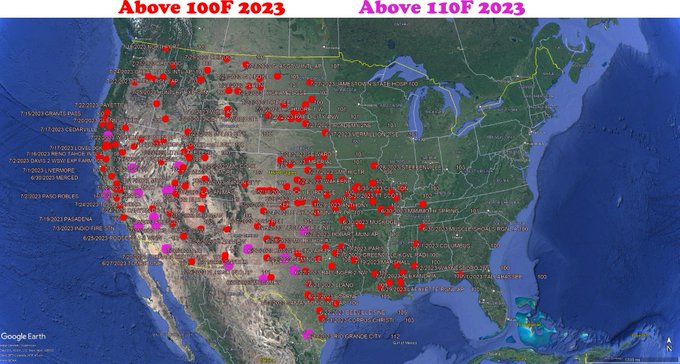
The US was much hotter in 1913 (left) than 2023 (right). 1913 was 86% of industrial era atmospheric CO2 ago. So much for claims of emissions-driven heat. https://realclimatescience.com/2023/07/hottest-temperature-ever/
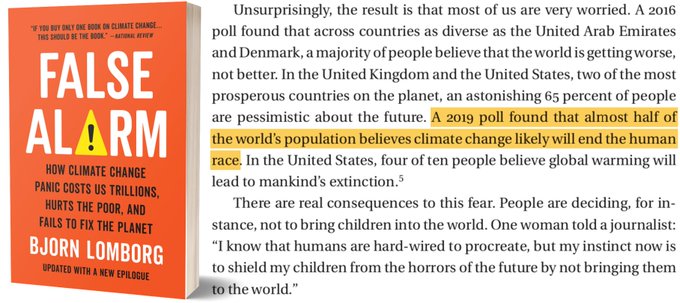
Half the world now believe that humanity will go extinct from climate change The reality? The UN expects the average person by 2100 to earn 450% of today’s income. Climate will reduce that to 434%. Problem, not end-of-world Learn more in "False Alarm": https://basicbooks.com/titles/bjorn-lomborg/false-alarm/9781541647480/
++++++++++++++++++++
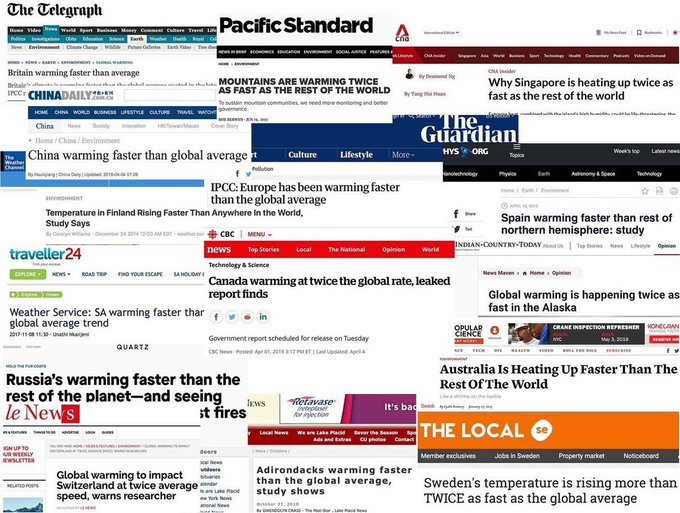
Every place on earth is warming faster than everywhere else. #ClimateScam
“Every record has been destroyed or falsified, every book rewritten, every picture has been repainted, every statue and street building has been renamed .... Nothing exists except an endless present in which the Party is always right.” - George Orwell 1984#ClimateScam Show more


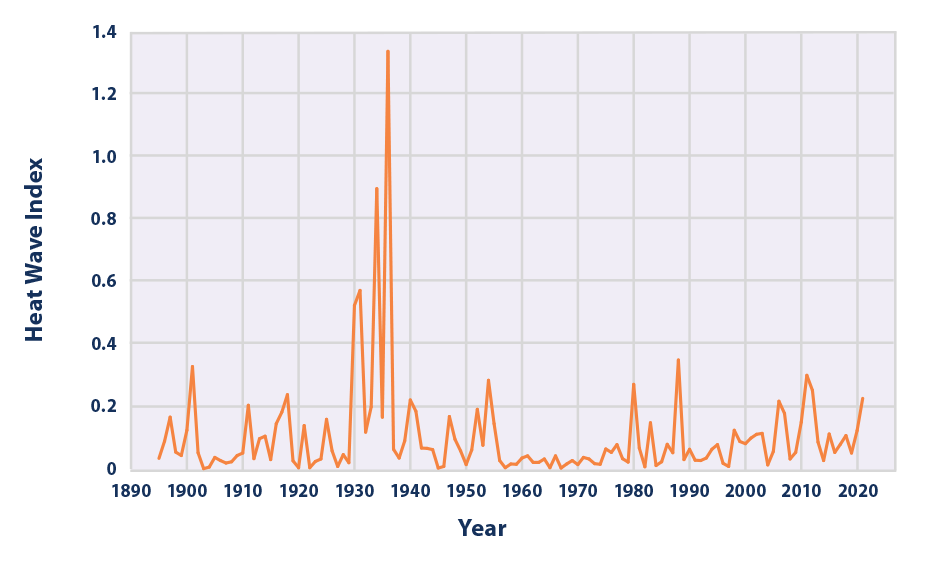
I busted the EPA fiddling with the data to make it seem hotter a couple of years ago:
https://www.marketforum.com/forum/topic/71468/#71522
EPA BEFORE (Data source: Kunkel, 2016)
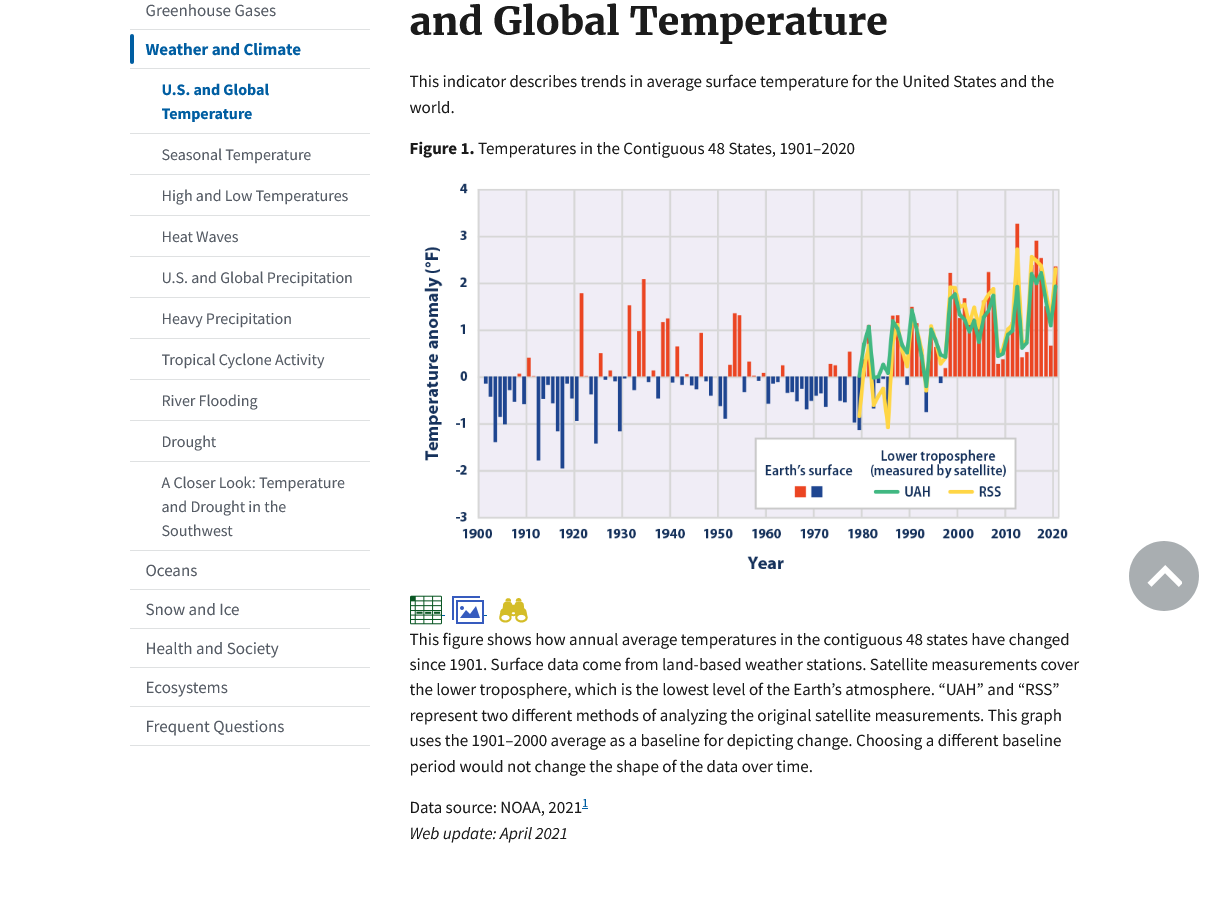
This indicator describes trends in unusually hot and cold temperatures across the United States.

+++++++++++++++++++++++++++++++++++++++
EPA AFTER Data source: NOAA, 2021Web update: April 2021
August 3, 2021: Holy Cow! They got busted and took down the graphic!!!! Luckily I copied it above before they could remove it!!!
Instead, they added back the original correct one from the front page and moved it to a different page, figure 3 so that it doesn't show up immediately like before.
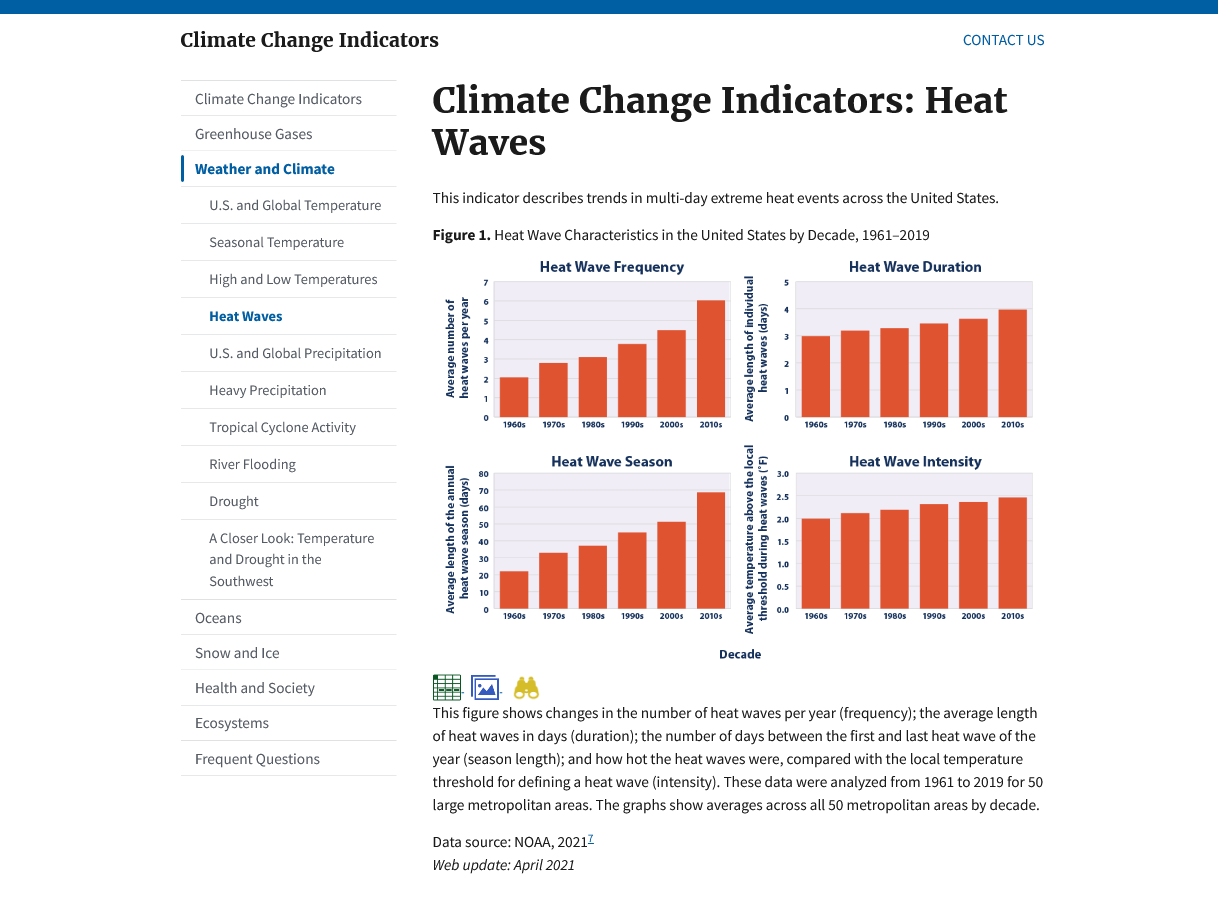
Now on the front page, they only start with the 1960's, when there was global cooling so they don't have to show the 1930's anymore!!!
https://www.epa.gov/climate-indicators/climate-change-indicators-heat-waves
What a bunch of dishonest scientists!
Fortunately, I copied and saved the previous ones shown above.
This is what they have now on the front page.
It starts with the 1960's!!!!
EPA latest
·
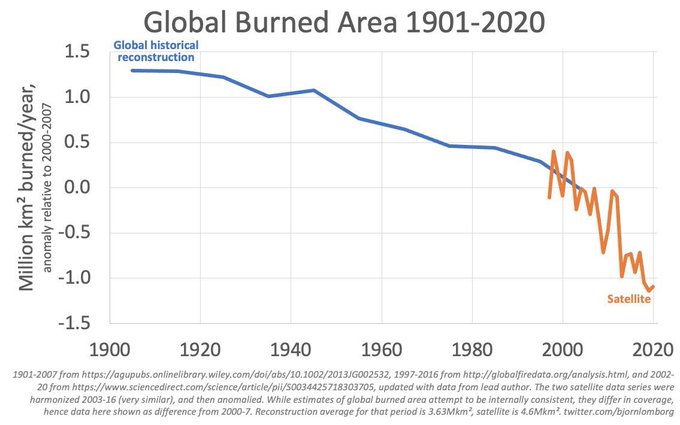
Do we live in a world on fire? For more than two decades, satellites have recorded fires across the planet’s surface. The data are unequivocal: Since the early 2000s, when 3% of the world’s land caught fire, the area burned annually has trended downward.
metmike: Here's a great graph. It's the complete opposite of what they tell us!
CNN
Published 12:30 PM EDT, Fri August 4, 2023
https://www.cnn.com/2023/08/04/world/greta-thunberg-edinburgh-intl-scli-climate/index.html
++++++++++++++
+++++++++++++++
+++++++++++++++++++
https://wattsupwiththat.com/2023/06/21/today-we-died/
Five years ago today.

++++++++++++++++++++
https://en.wikipedia.org/wiki/Greta_Thunberg

+++++++++++++++++++++++
One can't deny her sincerity but the obvious use of her as a tool/puppet to use as part of a dishonest marketing scheme to dumb down gullible young people is offensive to science savvy people that cherish education and the truth.
Constantly spouting easily debunked anti science narratives in the name of a flawed understanding of environmentalism, a fake climate crisis and her main objective......global Marxism.
To an educated person, she is a laughing stock and buffoon.
She is being enabled and empowered by powerful sources that are using her for their objectives.
For instance, how many science ignorant teenagers have testified to the US Congress and spoken in front of the United Nations about a topic they are dumber than a box of rocks on?
At least the rocks aren't predicting the end of humanity and that we are destroying a planet because of the beneficial gas greening it up and causing the best weather/climate for life in at least 1,000 years during a scientific climate optimum for life (-: