HI--there --Gold might see 2392ish bases cash where it can form top ---and see how mkt reacts!
Hi Fays, we welcome you and your views here very much.
HI, FAYS.
AM I REMEMBERING CORRECTLY, IN THINKING YOU WERE HERE, QUITE A FEW YEARS AGO?
ON GOLD... I AGREE WITH YOU... IMO, POLITICS WILL BE "BEHIND THE WHEEL", ON WHERE GOLD IS HEADED.
if holds 2303/2285//2222** where if it holds on mid of june and China Taiwan -- can change but --right now
Previous Gold thread:
Gold
37 responses |
Started by cutworm - Nov. 29, 2023, 8:14 p.m. https://www.marketforum.com/forum/topic/100943/
+++++++++++
Charts below are not perfect. Can we challenge/take out the May high??
fays, your 2392-ish target was ~ the April 20 high! Failing at that level would leave a potential head and shoulders formation.
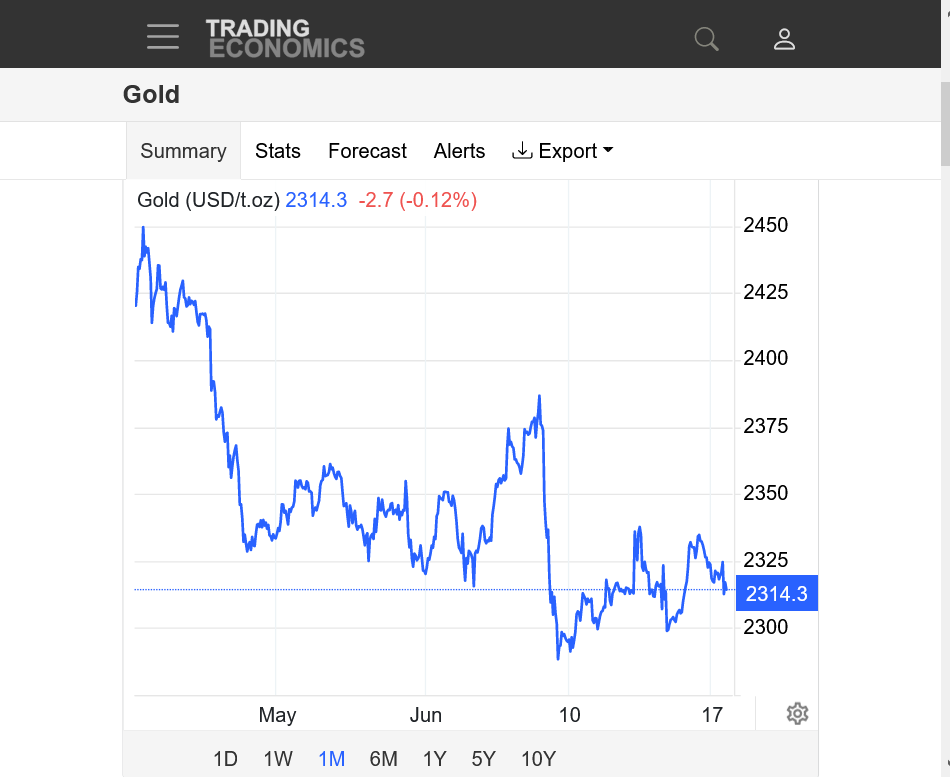
1. 1 week-short term uptrend resumes?
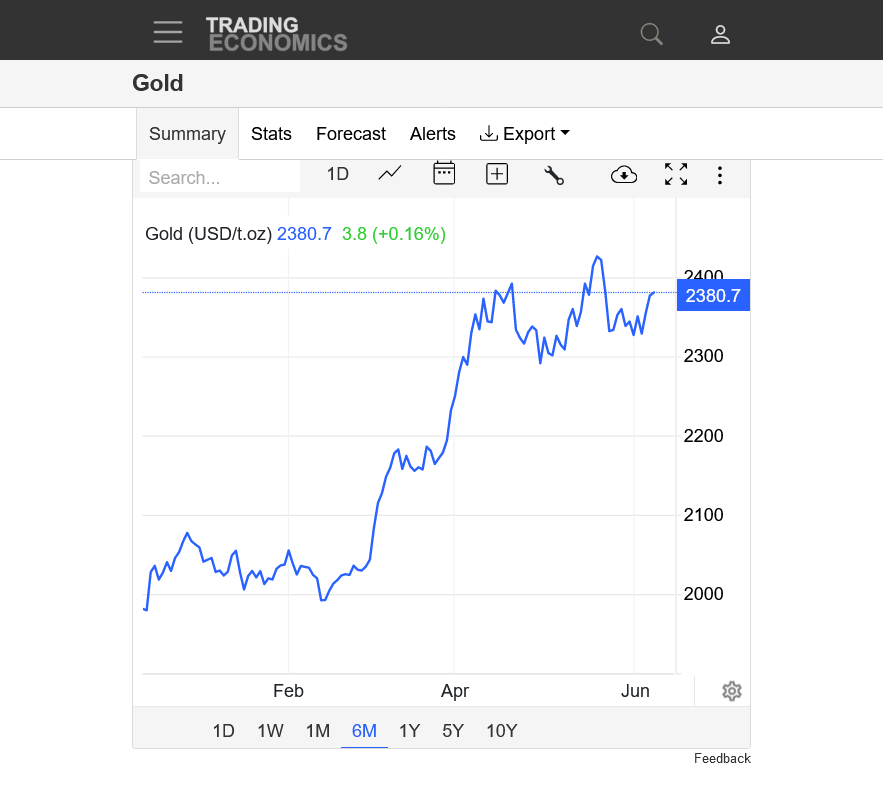
2. 1 month-upside break out from bullish flag/pennant formation after the 2450 top/May 20, then 2315 low on June 4.
3. 6 months-potential head and shoulders formation-if fays is correct and this rally fails at the high of the right shoulder. Left shoulder is 2392-ish high on April 19. Head is May 20 spike top. 2392-ish is a reasonable target for right shoulder top
4. 1 year-major uptrend still alive. Is this a pause? If this is a head and shoulder top, then 2290 on April 30 is the neckline and we have a ways to go to violate that MAJOR support.
5. 10 years-major break out in February 2024, above previous all time highs from August 2020.
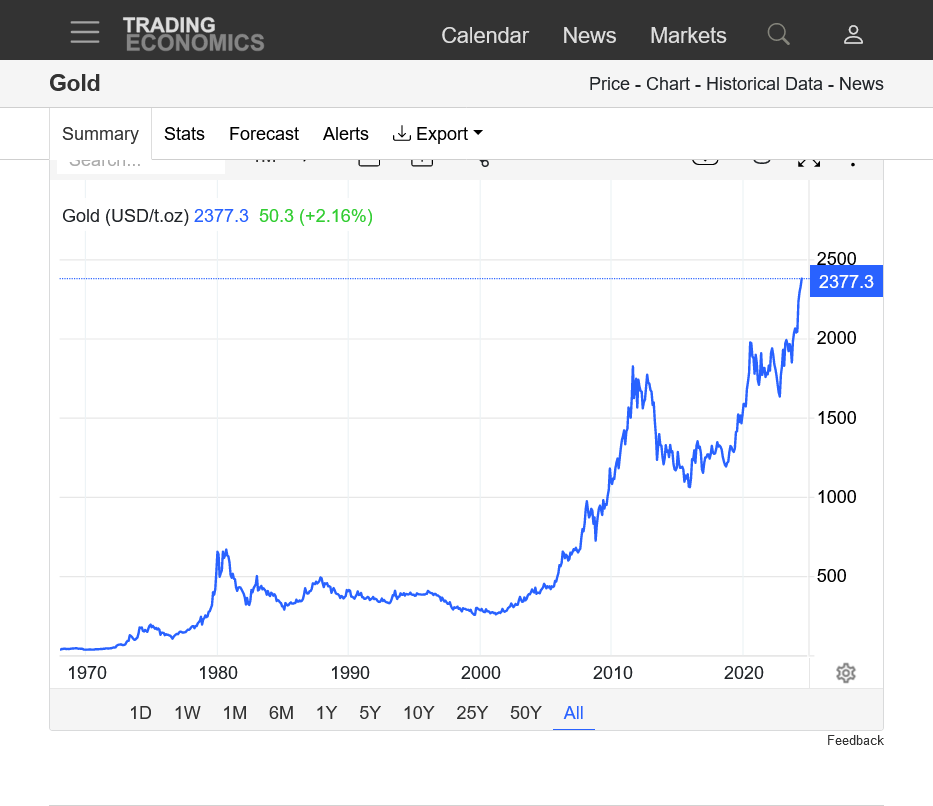
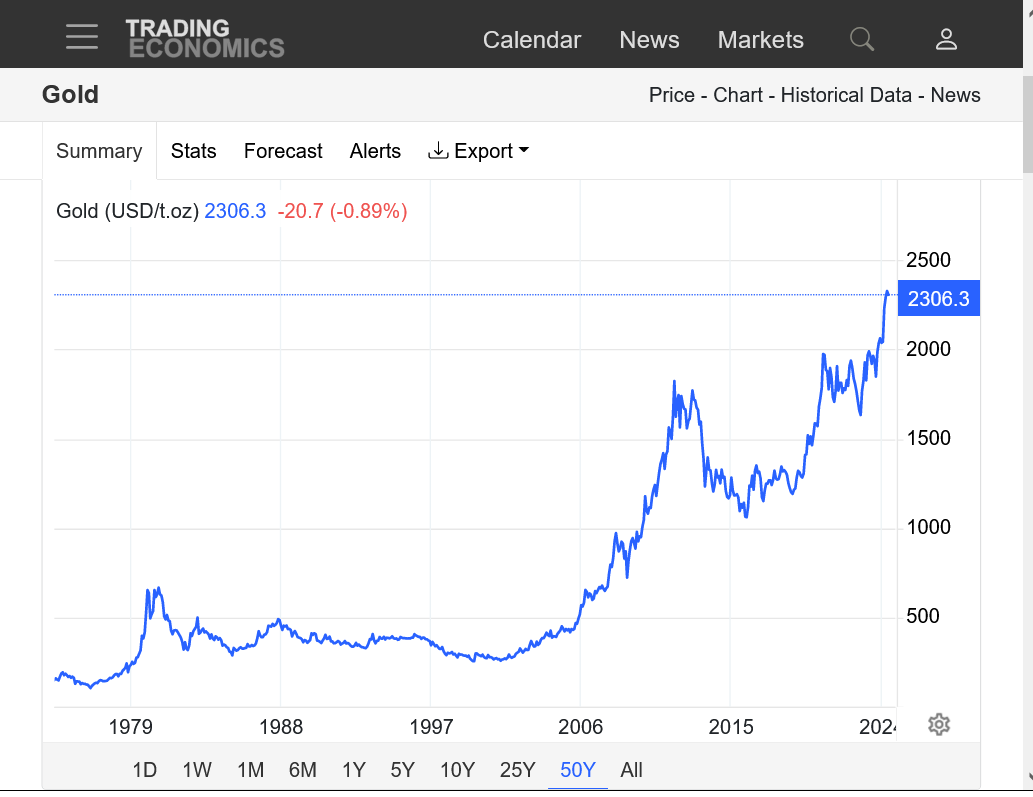
6. 55 years-previous high=1825 in August 2011. Accelerating uptrend?
https://tradingeconomics.com/commodity/gold


BTW, this is no way a prediction from me. I have no idea where gold is going. Just discussing potential chart patterns/formations based on fays projection.
https://www.investopedia.com/terms/h/head-shoulders.asp

This is the 6 month chart for gold that looks similar to the above's left shoulder, head and potentially building the right shoulder right now:
https://tradingeconomics.com/commodity/gold
This long term chart pattern is still valid. As I posted in November:
"On the monthly continuous chart there is a cup with high handle pattern. Starts with the Sept 2011 bar. Finishing the cup Aug of 2020. From then till now a handle.
The handle is a quad top. (4 highs at nearly the same price. WD Gann said the more times a top is hit the more likely to push through."
Gold (Globex) Monthly Commodity Futures Price Chart : COMEX (tradingcharts.com)
I agree with that, cutworm.
We have a ways to go downward to violate the long term uptrend!
I’m somebody that mostly trades very short term based on weather.
things that grow and energies.
Weather is a fundamental.
technical patterns are sometimes helpful but I like to think that the price signature on charts in weather markets is the market reacting AFTER it finds out about the updated weather forecast, not the other way around.
Those with the earliest and best weather forecasts are in the market before the reaction.
Those that are not on top of the weather, watch the market and think that it reacted BEFORE the weather.
NO!
It reacted before THEY knew about the weather. It reacted when the early birds with fresh weather information positioned to catch market worms!
one can look at historical price charts and weather patterns and find some huge correlations AND causations.
They appear to occur simultaneously. One might wonder which one came first, like the chicken or the egg joke.
The weather usually did, although there are numerous other factors and set ups, especially when strong weather patterns completely flip during key time frames And cause the market to completely reverse direction after a significant high or low from the OLD weather pattern.
This is tjc’s favorite trade.
Why am I posting this on a gold thread, a market never traded and discussing charts going back decades???
Because this is incredibly fascinating, fun and analytically challenging And free ……..unless your trade is on the wrong side (-:
MetMike and Forum
Grain market, in my humble opinion, totally ignored weather in favor of wheat harvest (must go down to confiscate as much as possible from wheat farmer) and is now ripe for buying. Corn did its best to shrug off wheat, but all grains lower, some really in tank. I do not see a crop that has been planted in ideal conditions, nor do i see one about to have ideal growing conditions. Will it take to July 4 to discern the unfavorable start? Maybe.
Probably start lower Sunday night, but long calls may be warranted in a bottoming grain market.
Mike said
"It reacted when the early birds with fresh weather information positioned to catch market worms!"
I hope the birds don't get the market worms, they're my cousins!!!
Cutworm
LOL
Good one, cutWORM!
And much thanks for the $200 to help pay our yearly domain fee.
Real good call last week, fays!
Gold was close to your 2392ish high late last week, then it collapsed!€£
Potential head and shoulders top if we fail to hold this support/lows/neckline from the end of last week:
https://tradingeconomics.com/commodity/gold
1. 50 years-uptrend going parabolic
2. 1 year-there's the head and shoulders pattern mentioned last week BEFORE we formed the right shoulder.
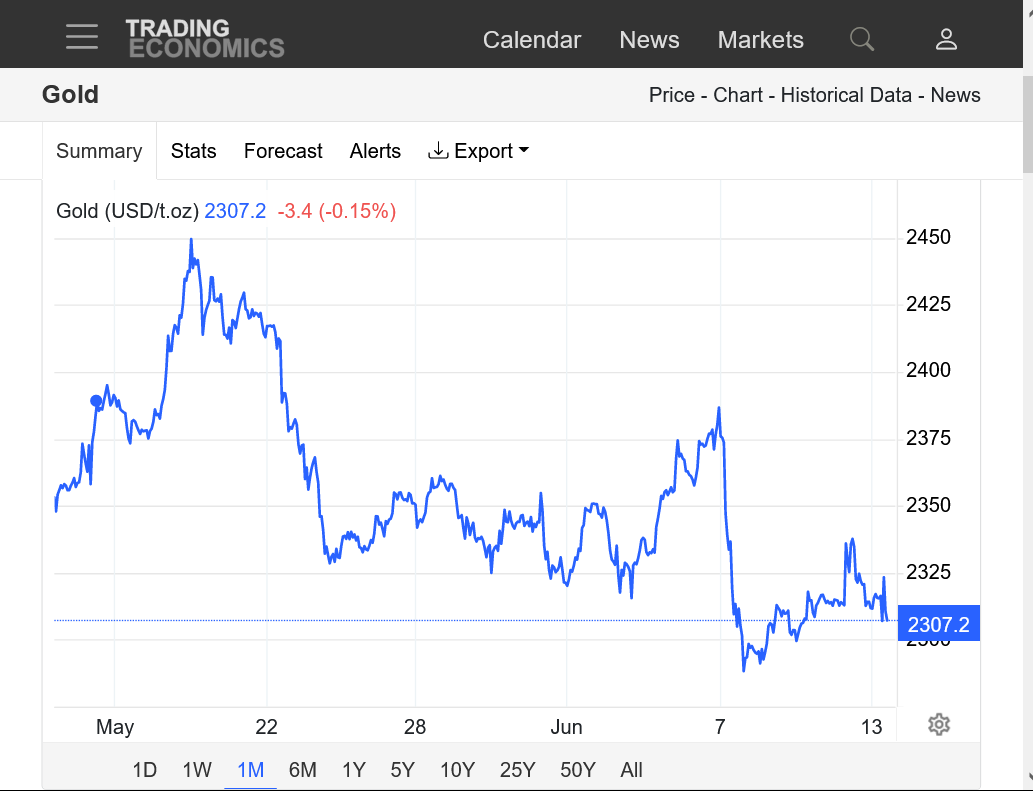
3. 1 month-head and right shoulder. Neckline is the low/support just below 2290
4. 1 week-closer look. There's a tremendous amount of speculative longs that are very vulnerable if technical indicators start flashing sell signs!!!

mercury and sun energy in to play on Friday in to Monday silver might find bottom near or around 27 ish if fails to break 3005
Silver appears to have put in a MAJOR top at the end of May!
1. 50 years-2011-1980 tops
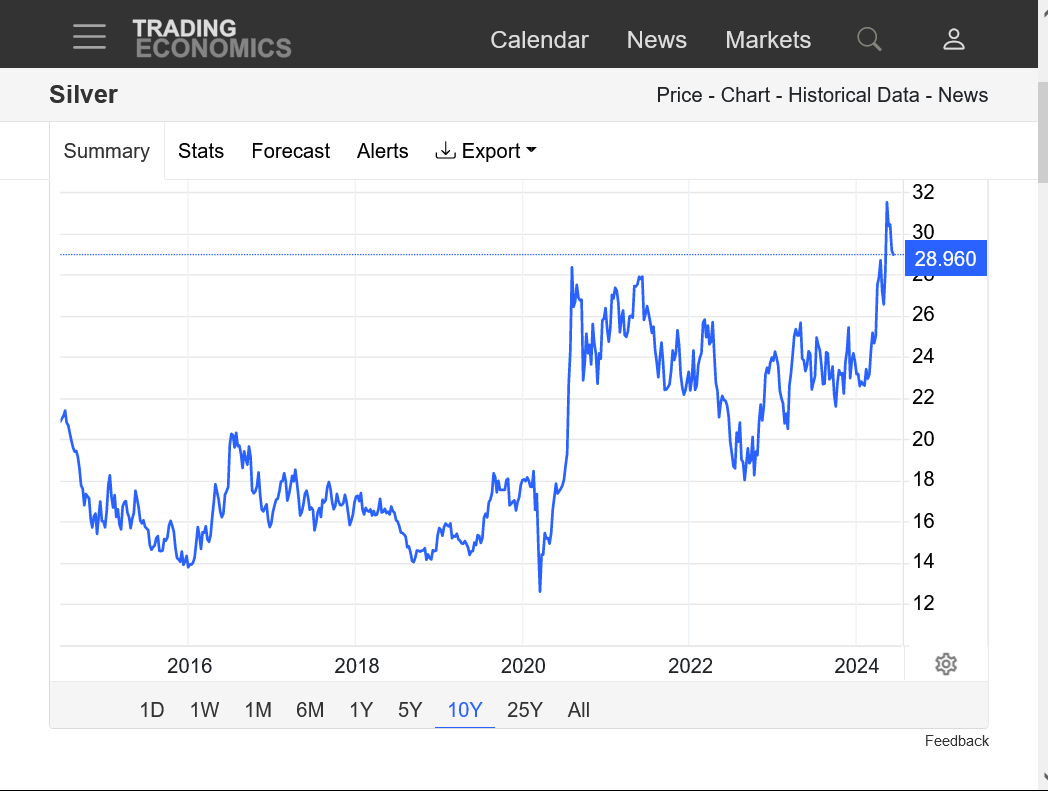
2. 10 years-2020 upside break out
3. 5 years-prices after the upside break out
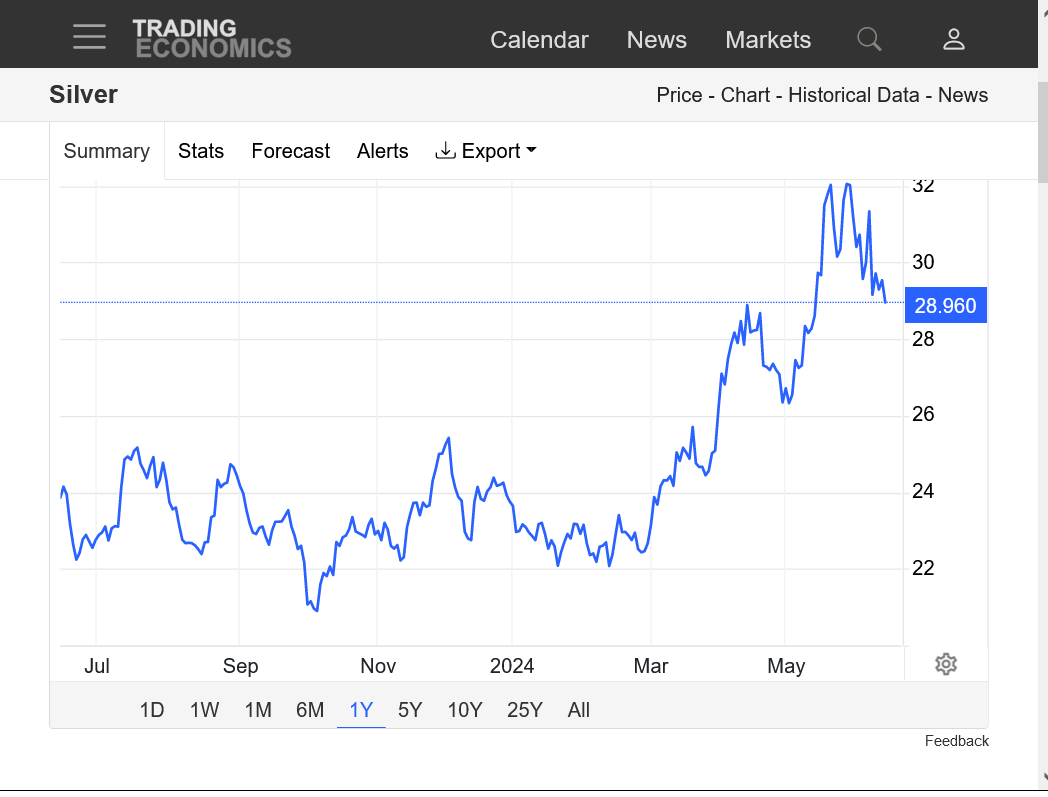
4. 1 year-There's that DOUBLE TOP
5. 1 month-Closer look at the double top. Massive failure on 3rd try to even get close to testing $32, then failure on test of $30.
6. 1 week-NEW LOWs for this move today
https://tradingeconomics.com/commodity/silver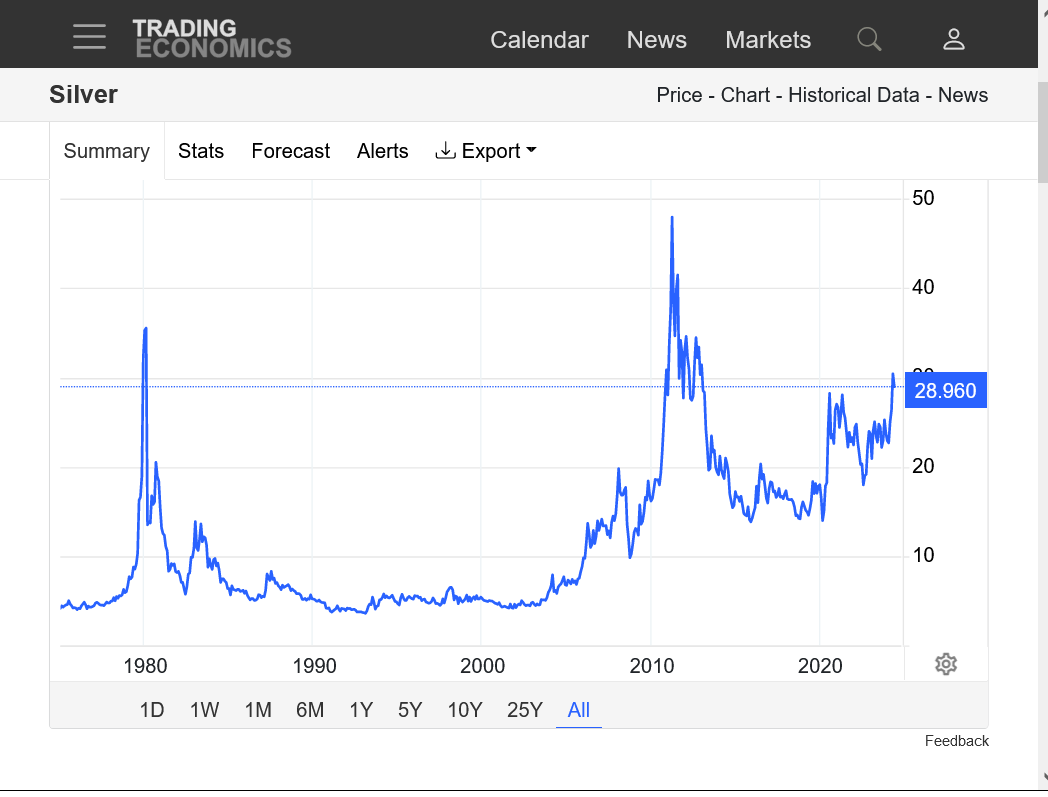


fays,
If you're using astrology to predict markets........good LUCK with that.
We welcome your astrology views with your other wonderful sharing here.
As a scientist, I'll challenge you to show me how astrology works to predict anything.........other than planetary movements.
There certainly are a ton of books on it. My impression is the authors make all their money selling the books not using their own astrology principles.
https://www.biblio.com/book/trading-sync-commodities-introducing-astrology-your/d/1413853624
I did spend a great deal of time studying this, especially with regards to predicting earthquakes and was invited to speak at dozens of meetings/organizations in 1990 about it because I was chief meteorologist at WEHT-TV in Evansville and everybody was panicking about the BIG ONE coming based on Iben Browning's astrology/fake earthquake prediction.
++++++++++++
Please don't let this small difference in opinion alter your wonderful posting.Your threads this month have greatly stimulated our trading discussions!
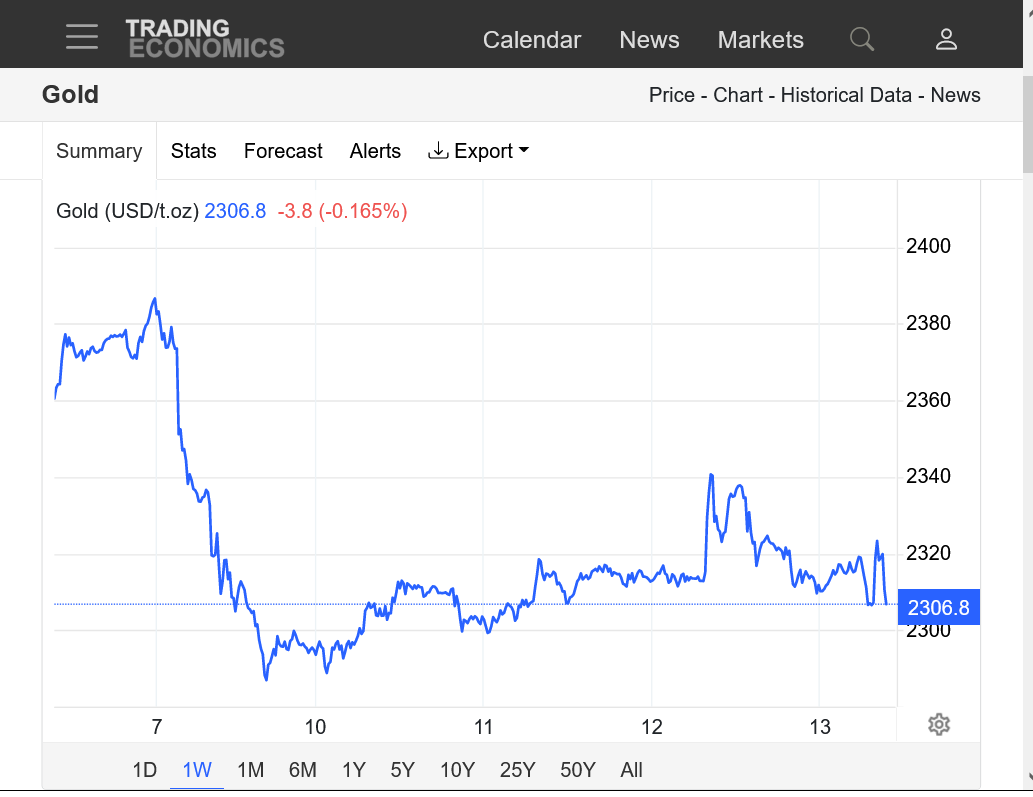
Gold held a test of 2300 yesterday and is threatening a weekly reversal up with today’s very strong day, potentially flipping some indicators from sell to buy.
Actually, this seems almost assured with silver following But not as strong recently
https://www.youtube.com/watch?v=qvp9LPTVDZ0 11 MINUTES
https://www.youtube.com/watch?v=mM71_ifeNDk 18 MINUTES
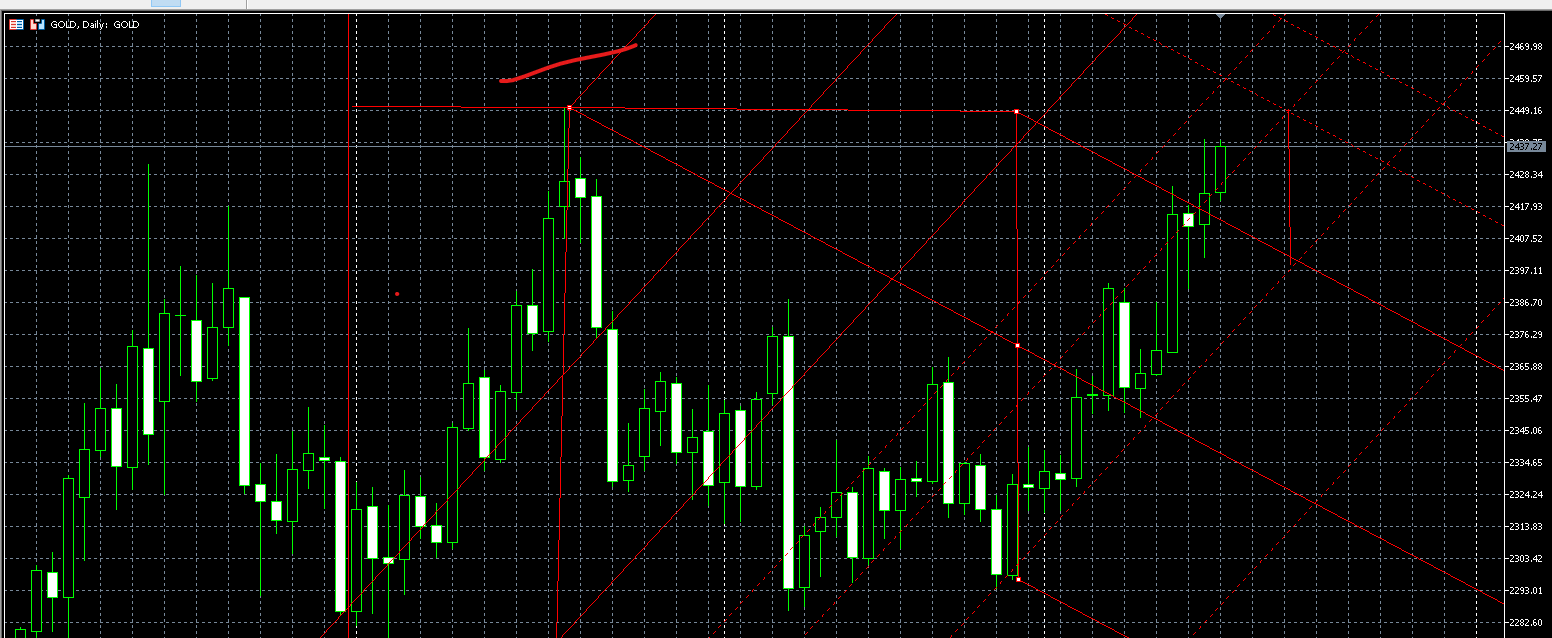
Gold is having convergence between a downtrending line off the May 20 high and the uptrending line from the June 7 low.
A large triangle formation that will either break the downtrend or break the very short term uptrend, usually by the time it hits the apex/where they meet.
Similar chart below(not predicting the same direction this time!
https://www.mcoscillator.com/learning_center/kb/chart_interpretation/trend_line_touch_points/


Thanks, fays!
Interesting place for Gold! Previous analysis is still valid with potential head and shoulders top. With regard to the role of astrology, I insist this to be "happenstance"
https://tradingeconomics.com/commodity/gold
Well defined left and right shoulder with head in between. Strong neckline support holding so far.
Violating the support, confirms the formation/pattern.
Violating resistance NEGATES the head and shoulders pattern!bove
It can still be other things, like a DOUBLE TOP if the previous top is tested and fails.
Above that resistance and its a BULL FLAG.
In fact, violating this short term DOWN trendline, drawn from the peak to the top of the right shoulder makes a breaking out to the upside more likely.


23
Spike down an hour ago looks related to some sort of news!
https://tradingeconomics.com/commodity/gold
1. 1 day
2. 1 year


Thanks, fays!

Thanks, fays,
gold is potentially breaking out to the upside of a bull flag.
some strong resistance here.
I’ll have charts on Friday when back in the office.
now waiting for the break dn of COT report so get a clue about the next leg up/dn !
thanks much, fays!
Sorry for the delay in charts.
Added: You make a great point about the COT. In many markets its a great indicator regarding the mentality of certain traders that control the price and when the market becomes very unbalanced to one side.
In some markets, the commercials can often represent those that use value/price to base their positions on. Strong hands, so to speak. In many markets, gold I assume is one, the speculators, especially big specs position is a key. If they are historically EXTREME, it can be a warning sign for a correction for the market to obtain more balance. It can tell us if large specs want to be long,/buy more or want to cover longs at a certain price. Interpretation is a science in itself but often, it provides a footprint that can help us/you to track the psychological frame of mind of impactful traders.
++++++++++++++++++++
As mentioned earlier this month, gold is poised for an upside breakout from a bull flag and that signal could be verified later today when gold begins trading for this week. I've not followed gold for much of my trading life but know it can trade strongly off of news.
Considered the close on Friday, just below life of contract highs and the news yesterday of an attempted assassination of Trump, I wonder if gold might not have an upside break out?
The questions to ask with regards to the impact of this event on the price of gold are 2 fold.
1. Is Trump being president bullish or bearish gold? The assassination attempt will give him the presidency.
2. Is the CHAOS associated with the assassination attempt bullish or bearish gold? We know that political and financial uncertainty can be bullish gold, because people flock to as a safe haven. However, despite an assassination attempt being as chaotic as it gets, it also, greatly reduced the uncertainty of the presidential election, which means LESS uncertainty about the future. The market will be confident of a Trump presidency now!
3. Always important to watch how a market reacts to news at key points. A life of contract high is as key of a point as there is. An assassination attempt is as big of news as there is.
4. As useful as charts are in helping us to predict where a market it going, we should all face the stone cold fact that fundamentals are still the main driving force of most markets. A fundamentals shift, will drive the price charts. For people not "in the know" about the fundamentals shift early in the game, they will see it on the price charts AFTER those in the know about fundamentals but still see it in time to jump on board and make money(or reduce risk).
5. Markets that trade weather, do so because weather is THE key price driver from the supply side for crops growing in the ground. Good weather = big supplies. Bad weather = small supplies. For natural gas its the demand side. Extreme cold/heat = increased demand, Mild temps = reduced demand of NG.
+++++++++++++++
Charts and analysis below:
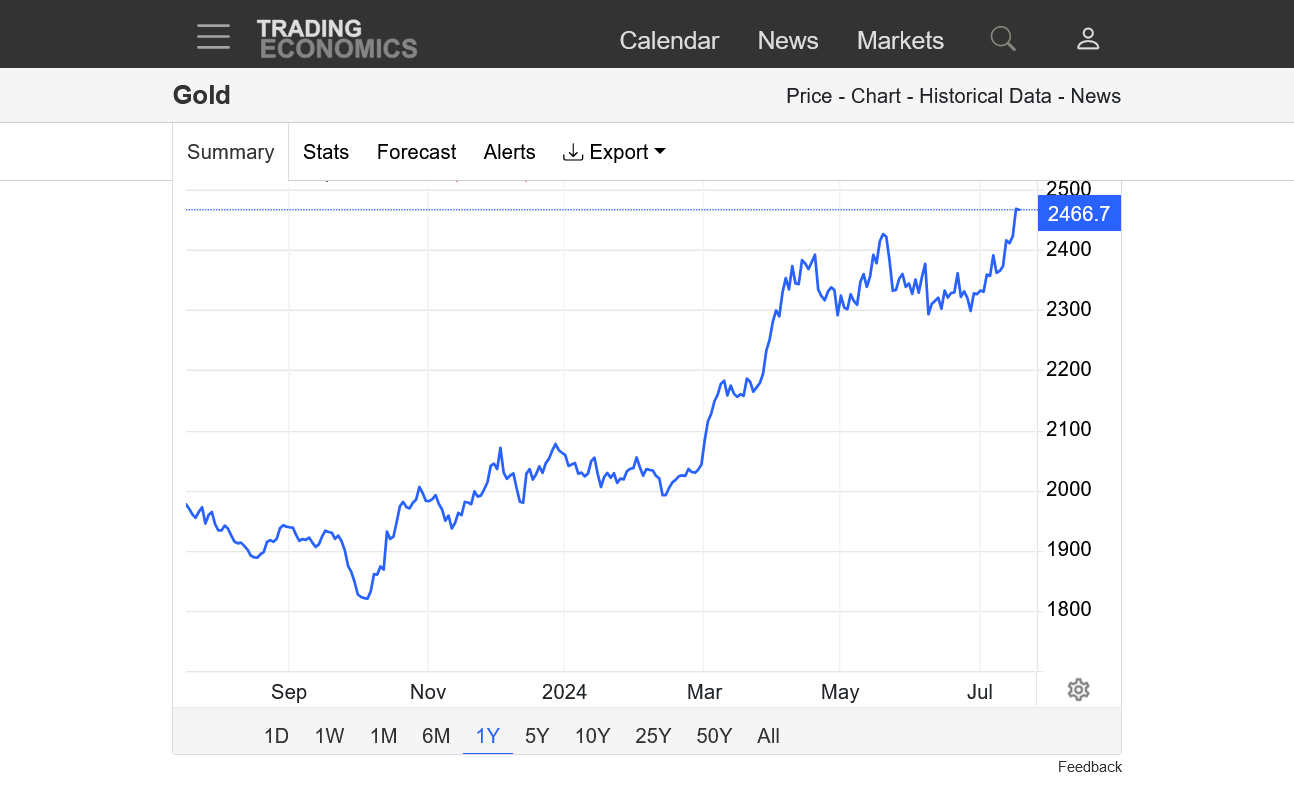
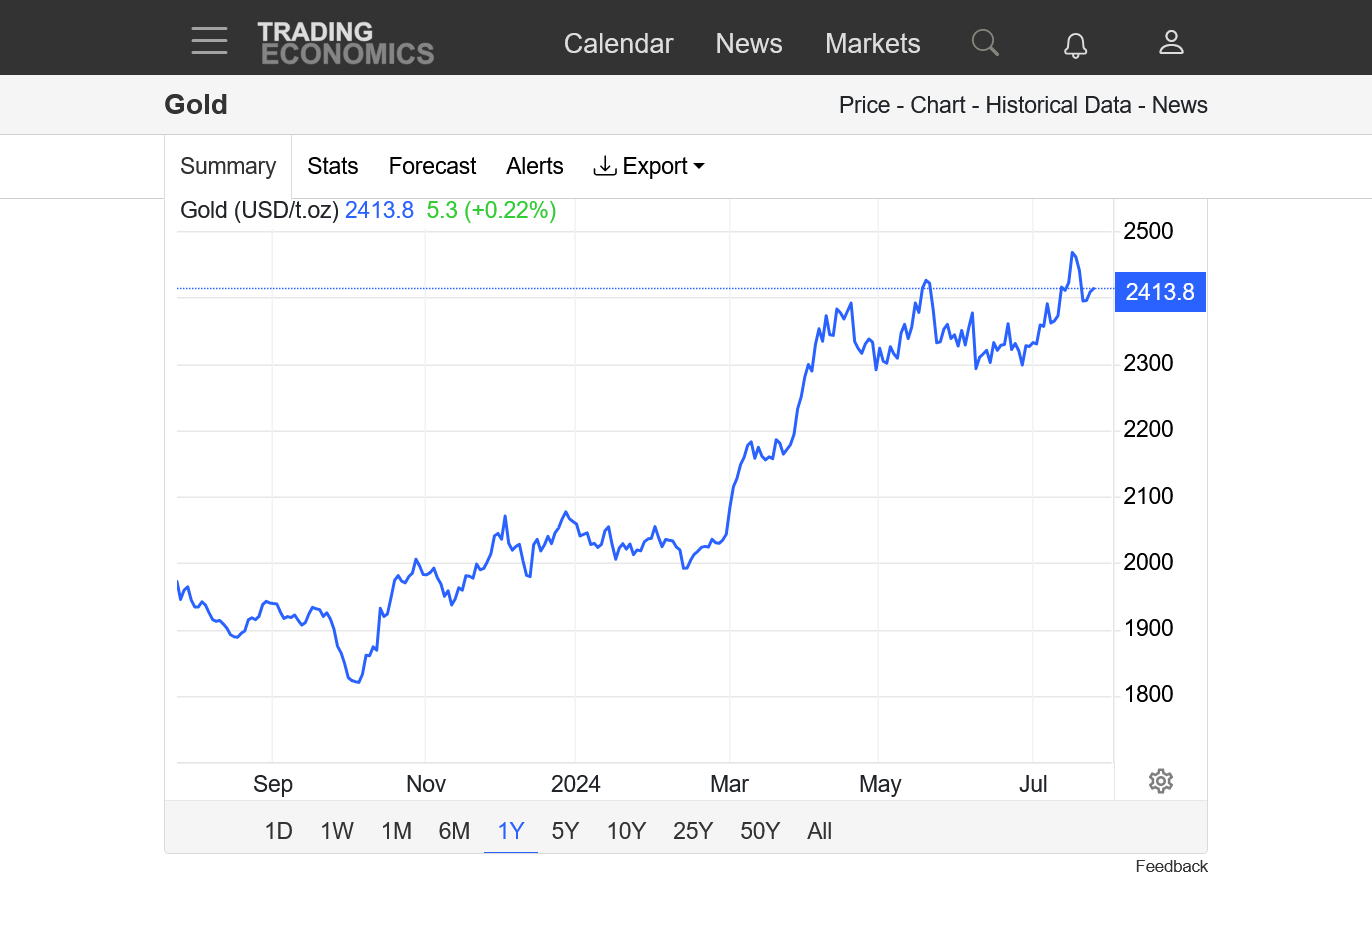
1. 1 year-gold testing life of contract high from May 2024. Will we have a powerful upside breakout this week? Or will this powerful resistance hold?? Odds greatly favor new highs, even if momentum appears to be waning. I don't predict the price and future of the gold market but we can still do a comprehensive assessment based on authentic facts and chart patterns.
2. 55 years-Incredible, unsustainable, parabolic curved long term(uptrend getting steeper and steeper). Markets can never continue the parabolic move, which eventually collapses with a buying exhaustion at the top. Usually when the bullish news is still getting more bullish...........but everybody that wants to be long is already long and the traders trying to pick the top/shorting.......cry uncle. However, picking a parabolic move top or bottom is almost impossible for the average trader(I use weather in weather markets) and the financial risks of being wrong are EXTREME because you are trading AGAINST AN EXTREME MOVE. This is why I always say that top/bottom picking, while fun and challenging(and my favorite weather trade) can be very hazardous to your account. The top for the gold market could come this week if prices get above contract highs(from May 2024) but reverse strongly downward and put in a double top formation or a buying exhaustion formation if we gap higher tonight but close below Friday's lows. However, the more likely scenario, based on the parabolic uptrend............IS NEW HIGHS. (trend is your friend).
https://tradingeconomics.com/commodity/gold


Wednesday, 22 May 2024 09:15 AM
MIKE SAID: "However, despite an assassination attempt being as chaotic as it gets, it also, greatly reduced the uncertainty of the presidential election, which means LESS uncertainty about the future. "
I SAY: "NEVER, NEVER LET YOUR GUARD DOWN." UNCERTAINTY WON'T LESSEN....EVEN IF THEY SUCCEED IN THEIR QUEST TO: "GET TRUMP"
HOW COME MADONNA WAS ALLOWED HER VIOLENT RHETORIC, IN D.C., WHEN TRUMP WON IN 2016?
SOME LIBERALS BELIEVE THAT "ELIMINATING" TRUMP WOULD BE THE BEST THING THAT EVER HAPPENED TO THIS COUNTRY. JUST AS THERE ARE SOME CONSERVATIVES THAT BELIEVE THE SAME WAY, ABOUT "ELIMINATING" BIDEN.
THIS HAS ALL, IMO... TURNED INTO AN ETERNAL FLAME.
Gold and Crude seem unfazed by the assassination attempt and INCREASED likelihood of Trump being president.
The reality is that nothing has fundamentally changed.
If Trump was killed..........that would be a totally different deal that MAXIMIZED CHAOS.
Thank God that was avoided by around an inch!
Gold on the verge of confirming an upside break out ABOVE life of contract highs in May. Interesting that its struggling at this level, with lost momentum.......for the moment. Tough resistance. I don't trade gold or predict the price.
Gold clearing resistance with upside break out. That’s the signal/technical formation at the moment. There is a trading set up to sell, if the market trades BACK BELOW RESISTANCE WITH A STOP ABOVE THE HIGHS.
Not my trade or a recommendation.….just a trading set up that has a decent historical track record of success.
The signal currently is still long.
Gains on top of the upside break out to all time highs in Gold! Breaking out of the BULL FLAG seen below.
https://tradingeconomics.com/commodity/gold
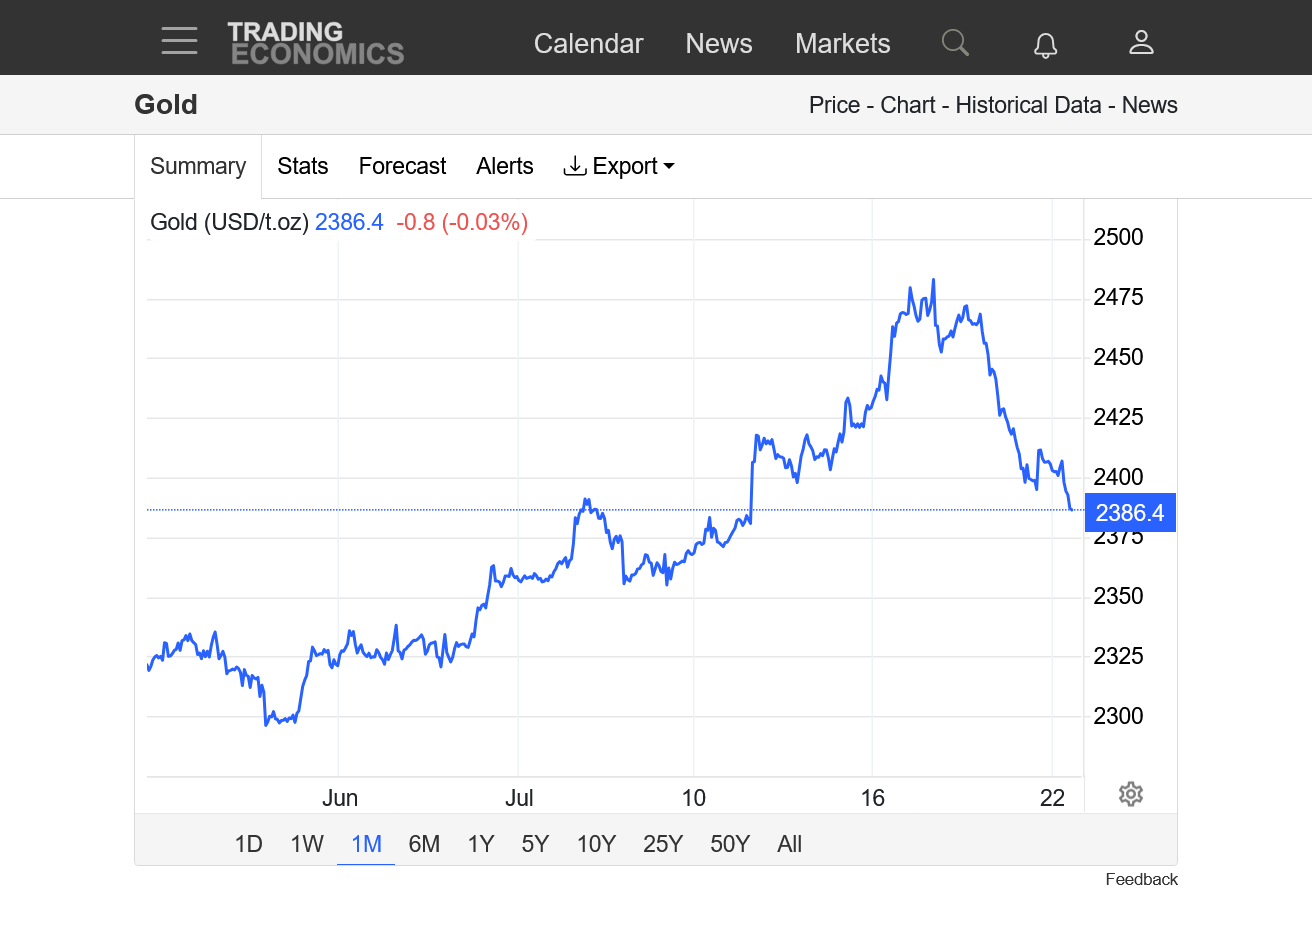
if weekly close 2412 is very important --!! then weekly shooting star -- and Silver and other metals unable to break pervious high ----waiting for the Weekly close -- now see how it unfolds!
Agree, fays.
silver failed at the old highs.
gold could have a reversal down for the week.
short term sell signals.for some programs.
Gold continues to have the potential, weekly downside reversal signal.
Life of contracts highs and weekly close lower but the close is important.
https://tradingeconomics.com/commodity/gold


2368 and 2335 important now
Thanks, fays.
Last weeks noted sell signal being reinforced here.
I would pick numerous level of support below, defined by previous highs/lows but the key level of rock solid support is 2300, seen on the 2nd chart going back the last 1 year.
Main resistance was last weeks high with minor resistance seen with peaks in the small waves on the chart below.

Gold just slightly below the May high/above the April high, still but holding ground around that previous resistance that is now acting as short term support.
https://tradingeconomics.com/commodity/gold
copper dropped for9 consecutive days --now silver -- next in line Gold !!?
Could be fays!
Gold continues very weak. MEGA support at just below 2300-ish. This level was tested and held 3 separate times. If nothing else, there will be a ton of sell stops just below that. COT showed a huge, large spec long position increase. Very expected with gold. This is extra fuel for an increase in the magnitude of corrections against that position.
https://tradingeconomics.com/commodity/gold
1. 1 month
2. 1 year
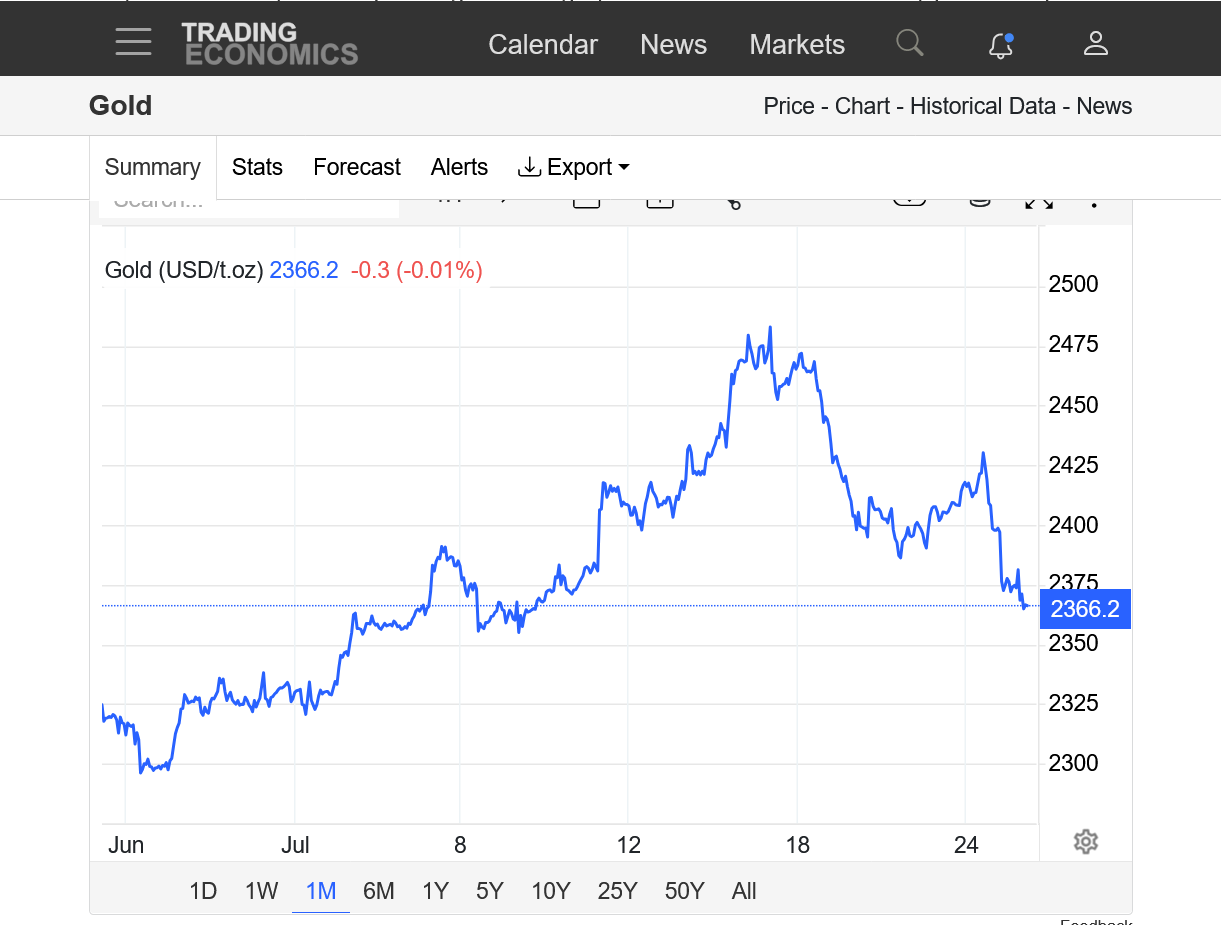

That mega support held on July 25, in fact we failed to get down that far.
gold has been surging up ever since.
Now threatening all time highs!!

