BUBBLE!
The price has greatly exceeded true valuations.
Manifestation by bullish market SPECULATORS has taken over price determination.
The market can decide that anything is worth, whatever value the market agrees is the value of it.
If everybody buying and selling WANT it to be worth more and more and they all agree to pay that price……it IS worth whatever the market decides it’s worth, despite its true value outside the trading/investing world.
A bag of Doo Doo is worth $5,000 if you have 1000 buyers that will pay that much and nobody will sell it for less than that.
Thats an exaggeration of the point but what usually happens with bubbles, is the exaggerated exuberance feeding on itself with the positive feedback causing the exponential, unsustainable price increase …..eventually dries up.
Then, you have a huge vacuum between the over inflated market price and the TRUE intrinsic value outside of the market.
Without the excessively aggressive, speculative buyers, the market crashes towards a lower price where excessive selling (after the buying exhaustion)can meet fresh buying from investors buying based on true valuation.
MIKE.... YA MEAN LIKE THE DOT - COM BUBBLE? THAT WAS A DOOOOOZY
Thanks much, Jean.
Since you started this thread, we've had another good one discussing the stock market here.
Sp 500 diamonds for ever--
28 responses |
Started by fays - June 7, 2024, 2:27 p.m.
https://www.marketforum.com/forum/topic/104700/
Much more detail on this bubble at that thread.
+++++++++++++++++++++++
I'll just repeat that trying to pick the exact top in a bubble is almost impossible for most people.
Extreme prices in markets that are rooted in supply/demand fundamentals/valuations, like energies or grains are very brief and more predictable because VALUE matters to consumers/commercial that are incentivized by true value.
If the price of corn went to $10 because the market ran out of corn, farmers would plant more corn to replenish supplies.
If the price dropped to $2, farmers would plant LESS corn.
Same with natural gas production/supply. Demand would also be altered and that would impact the price at extremes to REIGN THE PRICE EXTREME IN.
THE CURE FOR HIGH/LOW PRICES = HIGH/LOW PRICES.
Not so with the stock market, especially indices which aren't tied to fundamentals (like most commodities are) that cause huge players from 1 side to come out of the woodwork at points of extreme over/under valuation to substantively alter the extreme fundamental and get the market back into balance.......and the market MUST FOLLOW THEIR LEAD BECAUSE THE MARKET CARES ABOUT TRUE VALUATIONS.
With the stock/financial/economic markets, no such dynamic exists to dampen out extreme bubbles. The laws of diminishing returns that exist in most realms DON'T apply the same way.
https://www.investopedia.com/terms/b/bubble.asp
7 famous market bubbles
https://www.atomos.co.uk/knowledge-hub/insights/7-famous-market-bubbles
https://www.investopedia.com/articles/stocks/10/5-steps-of-a-bubble.asp
Economic bubble
https://en.wikipedia.org/wiki/Economic_bubble
An economic bubble (also called a speculative bubble or a financial bubble) is a period when current asset prices greatly exceed their intrinsic valuation, being the valuation that the underlying long-term fundamentals justify. Bubbles can be caused by overly optimistic projections about the scale and sustainability of growth (e.g. dot-com bubble), and/or by the belief that intrinsic valuation is no longer relevant when making an investment (e.g. Tulip mania). They have appeared in most asset classes, including equities (e.g. Roaring Twenties), commodities (e.g. Uranium bubble), real estate (e.g. 2000s US housing bubble), and even esoteric assets (e.g. Cryptocurrency bubble). Bubbles usually form as a result of either excess liquidity in markets, and/or changed investor psychology. Large multi-asset bubbles (e.g. 1980s Japanese asset bubble and the 2020–21 Everything bubble), are attributed to central banking liquidity (e.g. overuse of the Fed put).
In the early stages of a bubble, many investors do not recognise the bubble for what it is. People notice the prices are going up and often think it is justified. Therefore bubbles are often conclusively identified only in retrospect, after the bubble has already popped and prices have crashed
Is the current stock market a bubble?
With near certainty it is a bubble!
In extremely overvalued markets like this that are bubbles that are still going up, by definition you still have more SPECULATORS throwing their money at the market with reckless abandon that overwhelm all other elements and cause the 1 best to use identifier of a bubble.........the parabolic slope of the move up in the later stages.
Here it is with the latest SP chart.
Note the steepening UNSUSTAINABLE SLOPE of the move up. This is launching the price into the stratosphere and putting more and more distance between the price and valuation.
Does anybody really think that the Intrinsic/true value of the stocks in the stock market are worth 5+ times what they were 14 years ago?
Are those companies making 5 times more?
Is people's income 5 times more?
Is our GDP 5 times more?
The stock market has long ago departed from being a tool rooted in intrinsic value but instead is a massive, speculative bubble.
Eventually, all bubbles pop.......but they can go on as long as the IRRATIONAL EXUBERANCE AND SELF FULFILLING SPECULATIVE MONEY FEEDS THEM.
This one could go on for another X amount of time. Or it could end suddenly today with a black swan event..........like the assassination of president/likely president.
When the bubble ends, the correction is brutal and is correlated with how extreme the bubble was.
Since we know these companies in the stock market have intrinsic value, the stock market is not going to 0 but based on the OVER valued nature, a correction of 50% is possible really fast, and it would only have us closer to the true value.
That's not a prediction.......but its unlikely, that in 2030, this bubble will NOT be popped at some point with a brutal correction. Its conceivable that the market could take another 10 years to recover the losses from the top?
Speculators/investors that buy at the top of the bubble could take an extremely long time to just break even.
I'm not predicting, just telling you what the EXTREME RISKS ARE WHEN YOU BUY SOMETHING IN A VERY MATURE BUBBLE!
1. 50 YEARS
2. 10 YEARS-COVID CRASH Feb/Mar 2020. Bull flag/pennant/wedge 2022.
https://tradingeconomics.com/united-states/stock-market


https://www.statista.com/statistics/1175227/s-and-p-500-major-crashes-change/

https://www.youtube.com/watch?v=vu7XokdpCRg
+++++++++++++
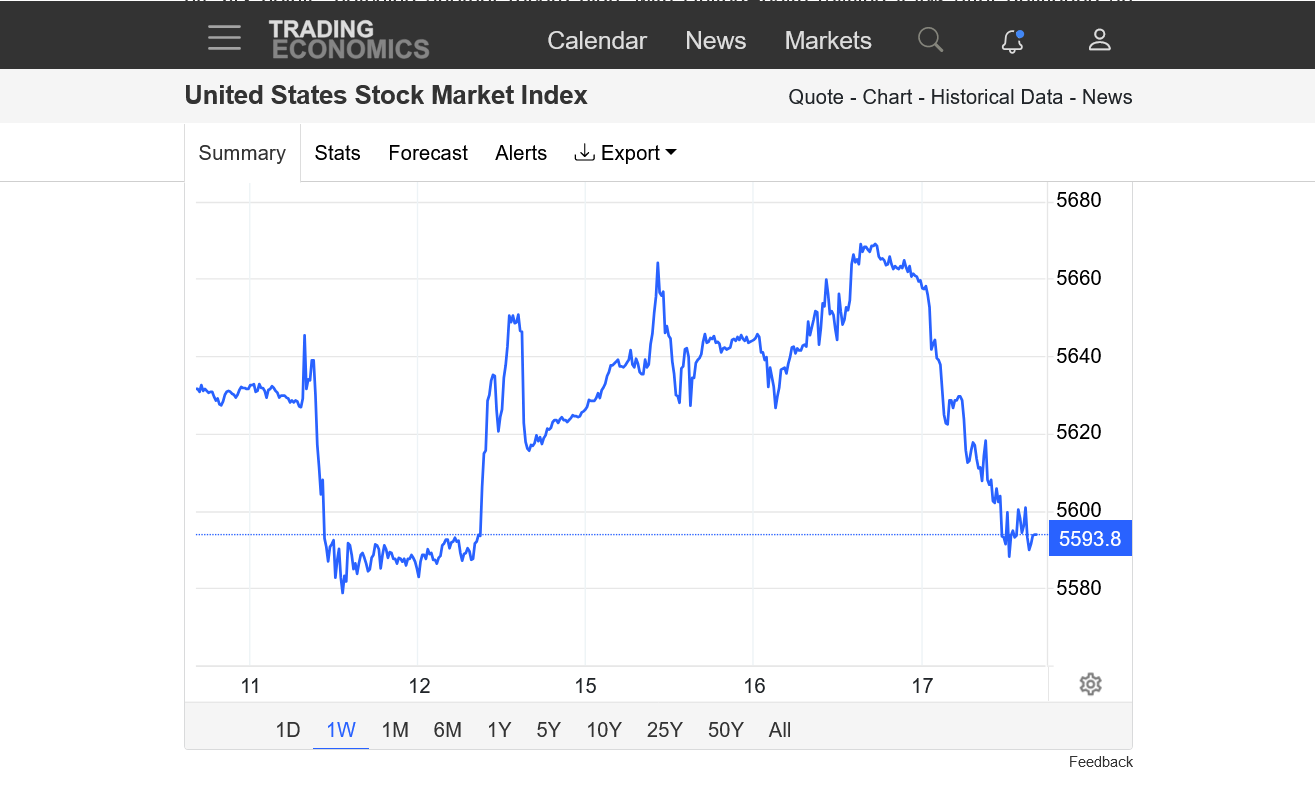
New all time highs followed by reversal lower today:
1. 1 month chart below.
2. 1 week
Selling signals are flashing on the screens for some short term traders.
However, top picking, historically has been damaging to account balances.
https://tradingeconomics.com/united-states/stock-market

Follow thru from the short term selling signal mentioned yesterday/Wednesday afternoon.
https://tradingeconomics.com/united-states/stock-market


I WASN'T REFERRING TO THE MARKETS, JUST THAT INDIVIDUAL STOCK. LOL
IT'S STILL HANGIN' IN THERE. https://www.barchart.com/stocks/quotes/IMMR
Sorry about that, Jean!
THAT VERTICAL CLIMB IN THE MARKETS, PUT ME IN MIND OF COCOA. IT'S TRYIN' TO RECOVER. LOL
IT'S DOWNWARD GAP GOT FILLED, TODAY. TIME WILL TELL
https://www.barchart.com/stocks/quotes/IMMR/interactive-chart
Jean,
I’ll have a closer look at this stock when at my laptop later today.
The filled gap higher can be a technical formation that suggests a buying exhaustion in many markets.
so I looked at this one closer.
The price yesterday closed near the high and though the gap was filled, the bottom of the gap served as strong support.
more importantly, I decided to see how this stock has traded historically and it’s just an insane pattern.
more later rhis morning.
LOL IT JUST BARELY CLOSED THAT GAP. BEIN' AS HOW IT FACED THE WEEKEND, IT JUST MAY TAKE ANOTHER STAB AT THAT "GAP"...SOON. THAT SHOULD BE THE DECIDING FACTOR, IMO. THERE'S A METHOD TO ITS' MADNESS....SOMEWHERE.
thanks, jean!
I know nothing about this industry and nothing about this stock, so I'm not a good source to predict where the price is going.
The price charts are interesting though.
https://www.barchart.com/stocks/quotes/IMMR/interactive-chart
1. 1 year: Looks like it could be taking off to much higher prices........on face value based only on recent months. There are several significant price reactions. In February, a 2 day, island gap higher with RECORD VOLUME, followed by prices returning the previous range. Then another high volume, gap higher in March, with a bit of follow thru then drifting lower to the top of the gap as support THAT HAS HELD since then. The March gap was never filled, so it was an UPSIDE BREAK AWAY GAP. This was followed by higher prices since then that have almost doubled from 1 year ago. This last gap, after this move up is positioned to be a BUYING EXHAUSTION GAP because it came after a sustained move up. If it was another upside break away gap formation, it stays open. Going strictly from technical analysis that is.......but there are no rules that are not constantly violated by prices charts or else trading/investing would be easy. Filling the gap means the extreme buying enthusiasm which caused the gap died out.........potential exhaustion of new buyers on new bullish news. In this case, after filling the gap, we closed near the high of the daily bar. This could mean that buyers returned that same day and still see this stock as bullish. Only future daily trading bars will tell. Not sure what the red and green bars denote for volume but the green bars seem to be bullish indicators, red bars bearish. The last several bars have been RED bars despite the spike higher.........not a good sign.
2. 10 years: This stock has had a history of high volume price spikes higher that were always temporary and it returned to the previous price range OR EVEN LOWER. Are we in the midst of another one? Those past reactions look like they might be news driven and temporary. One should also consider where the general stock market has gone during these 10 years with its increasingly steep move up. This stock has been an underperformer vs the general market but i'm not familiar with this particular industry and how it compares.

