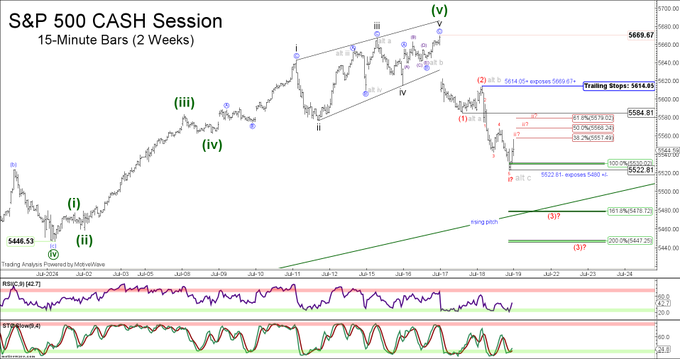
Hi sp 500 topping out 5372/5404 or 5441 and dn she goes or 5584 last death kiss Good bye area !! mine is 5372/5404 and MOC will decide near term topping out area here !! ReAct 2 mkt Condition$!
Thanks, fays!
I‘ll try to have some charts this weekend.
Like Jean, I remember a fays from the old forum days and assume that’s you.
If not for that, i thought your first post on gold was going to be selling something.
yes == Fays and now on s&p 500 Wednesday Fomc and top out area around that time!!
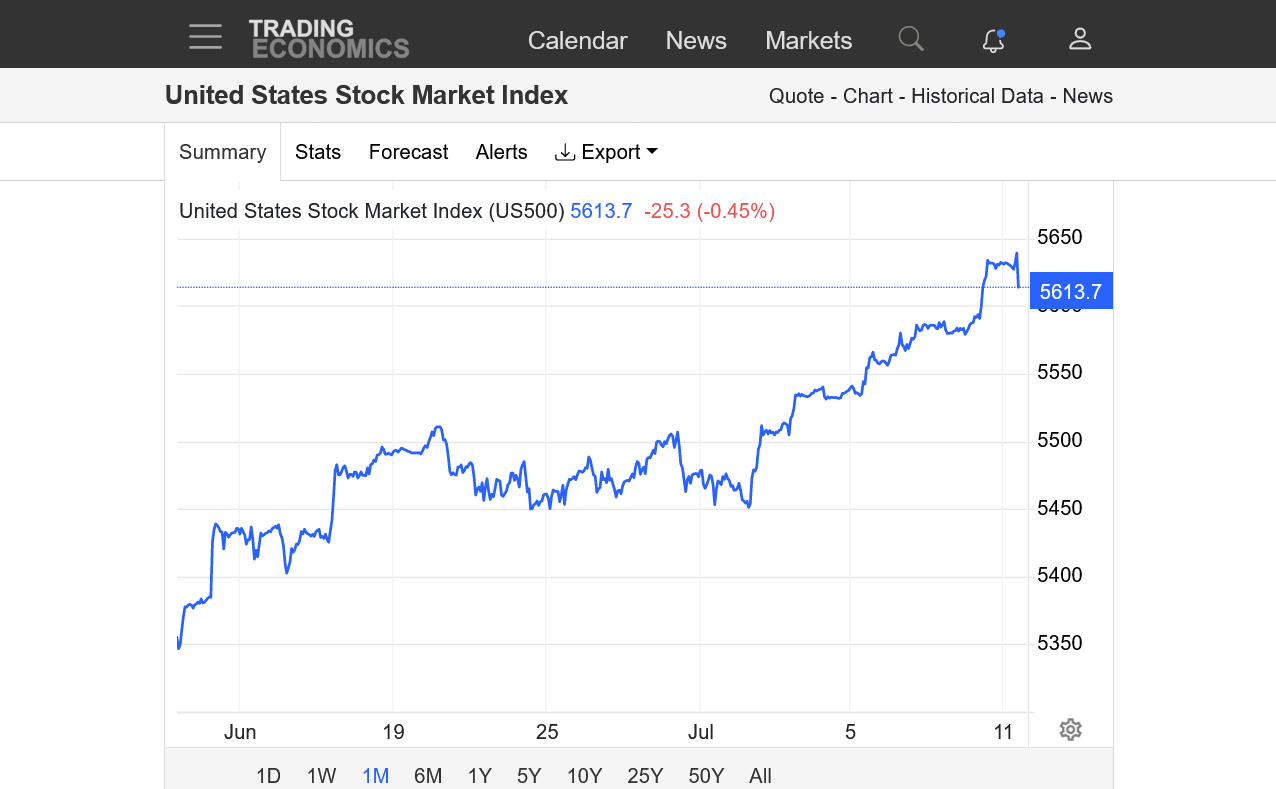
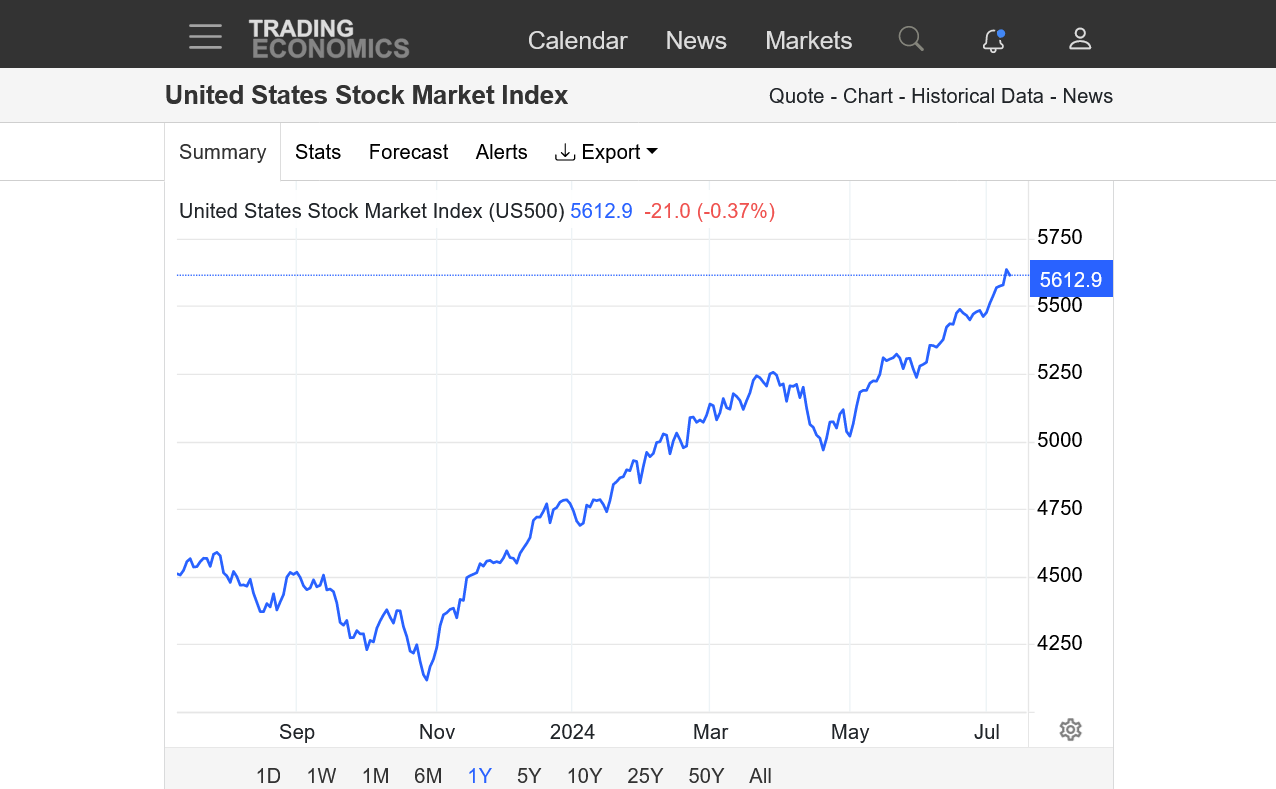
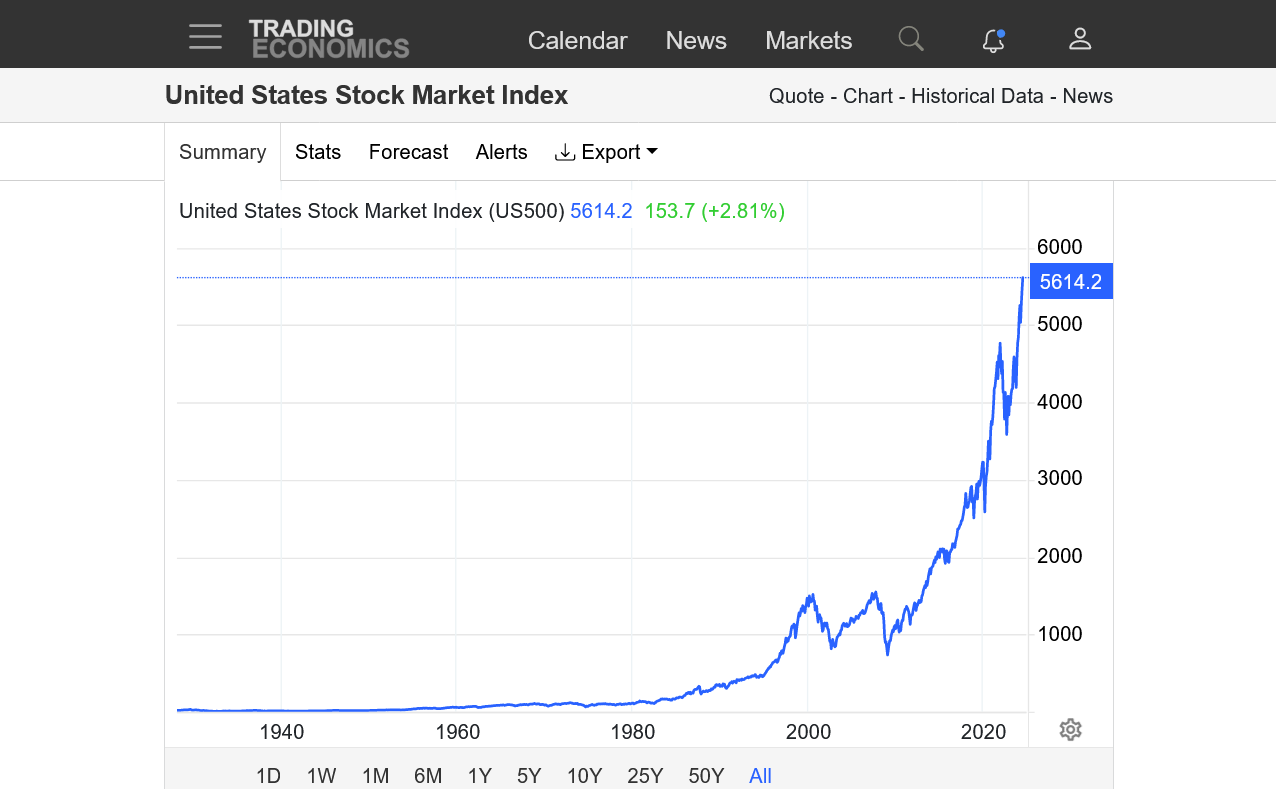
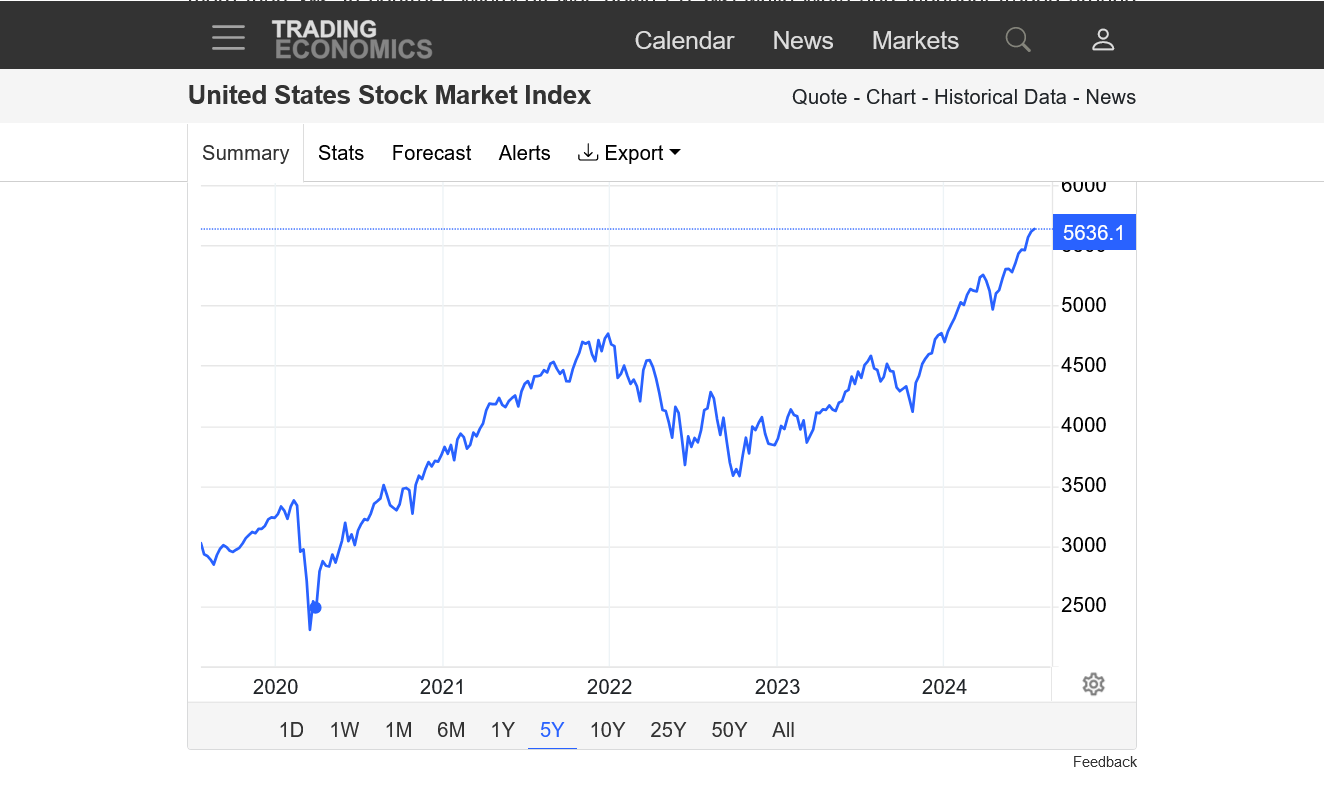
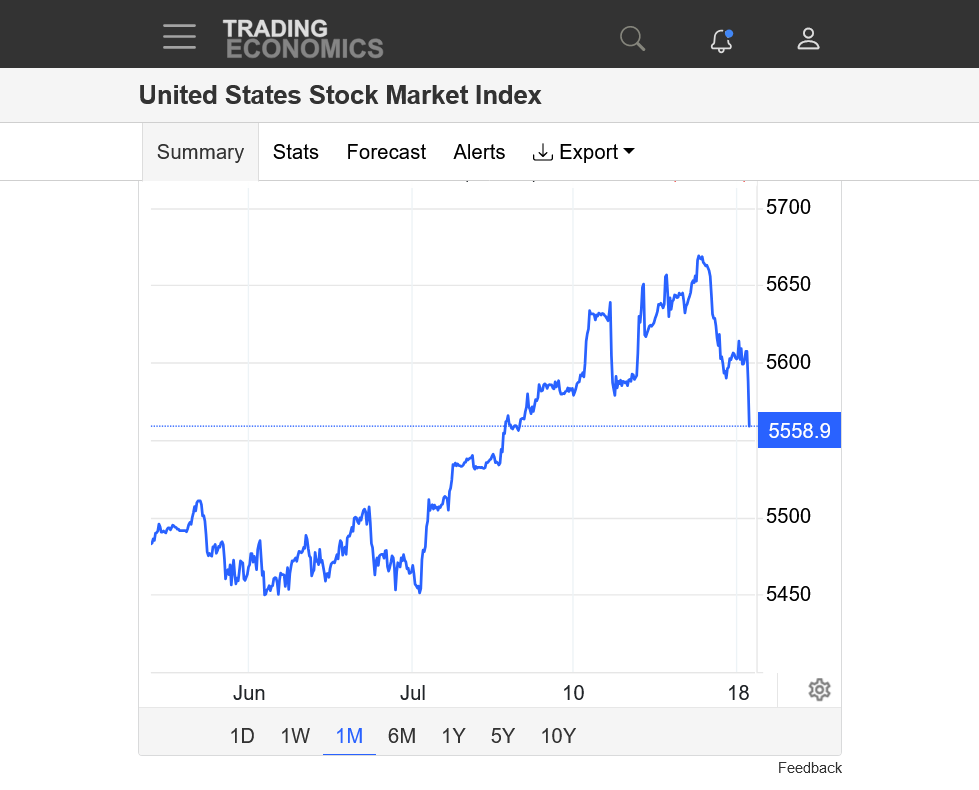
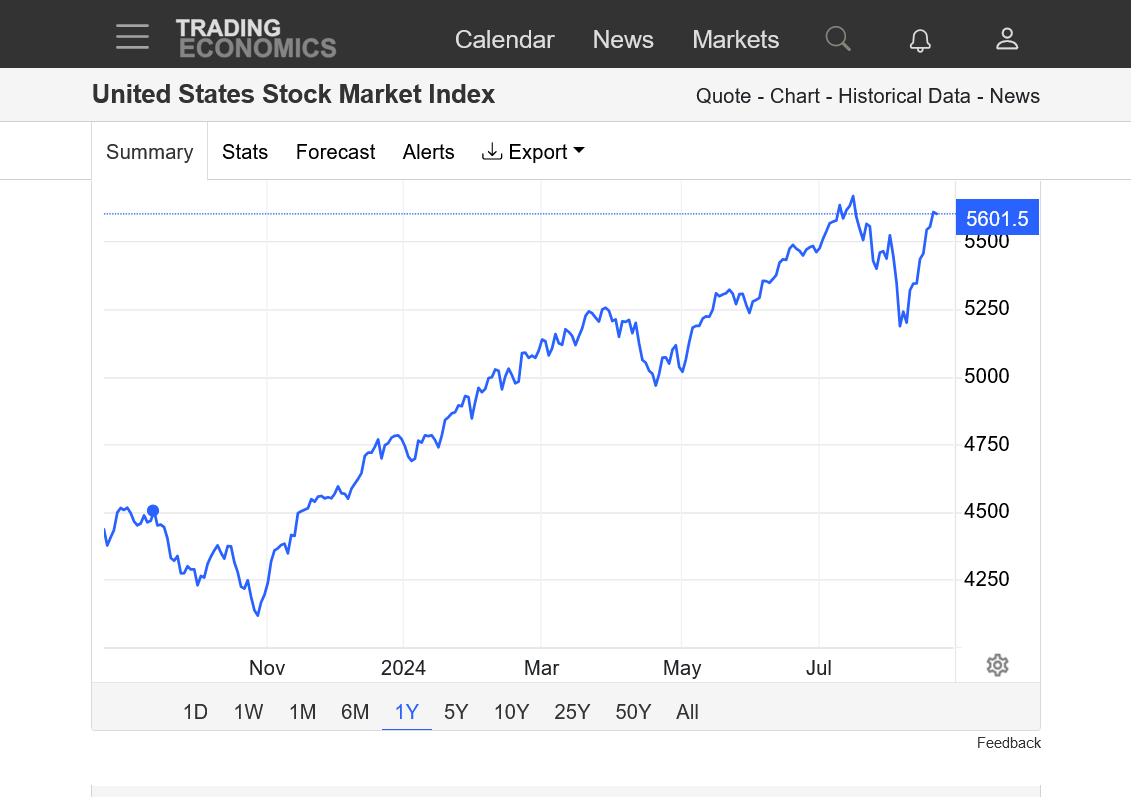
SP 500
1. 1 month-breaking out to new highs!
2. 1 year-Low Oct 2023, then strong uptrend, high March 2024, brief bull flag in April 2024, then new highs again. New highs now.
3. 5 years-Major high Dec 2021. Correction/bull flag 2022-All time highs Jan 2024-New highs now.
3. 10 years-strong STEEPENING slope uptrend GOING PARABOLIC-can't last
4. 50 years-strong STEEPING slope uptrend GOING PARABOLIC-can't last
https://tradingeconomics.com/united-states/stock-market


5474//5402 either side break important and let mkt unfolds !! oil might see top around 28 june /4 th July
Thanks much, fays!
We're still going up. Displaying the risk/hazards of trying to pick/short a top in a PARABOLIC move up.......and being early!
I couldn't make out any of the labels on your chart for either the X or the Y axis but am pretty sure its an SP weekly chart:
How about this one?
1. Weekly
2. Monthly
The longer term charts are still close to the same as previous posts..........UP, UP, UP! Parabolic up that can't be sustained!
https://tradingeconomics.com/united-states/stock-market

A 3rd day in a row of sideways, potential bull flag/pennant/triangle formation trading.
Mike, been busy lately and simply haven't had the time to post or comment on anything. Doing a great job keeping the lights on!!
Top down review as I see it.
Unless something changes looks like were headed to 5854. I'm quite surprised the 423% extension wasn't the top of this runaway train. But here we are headed to 561%.
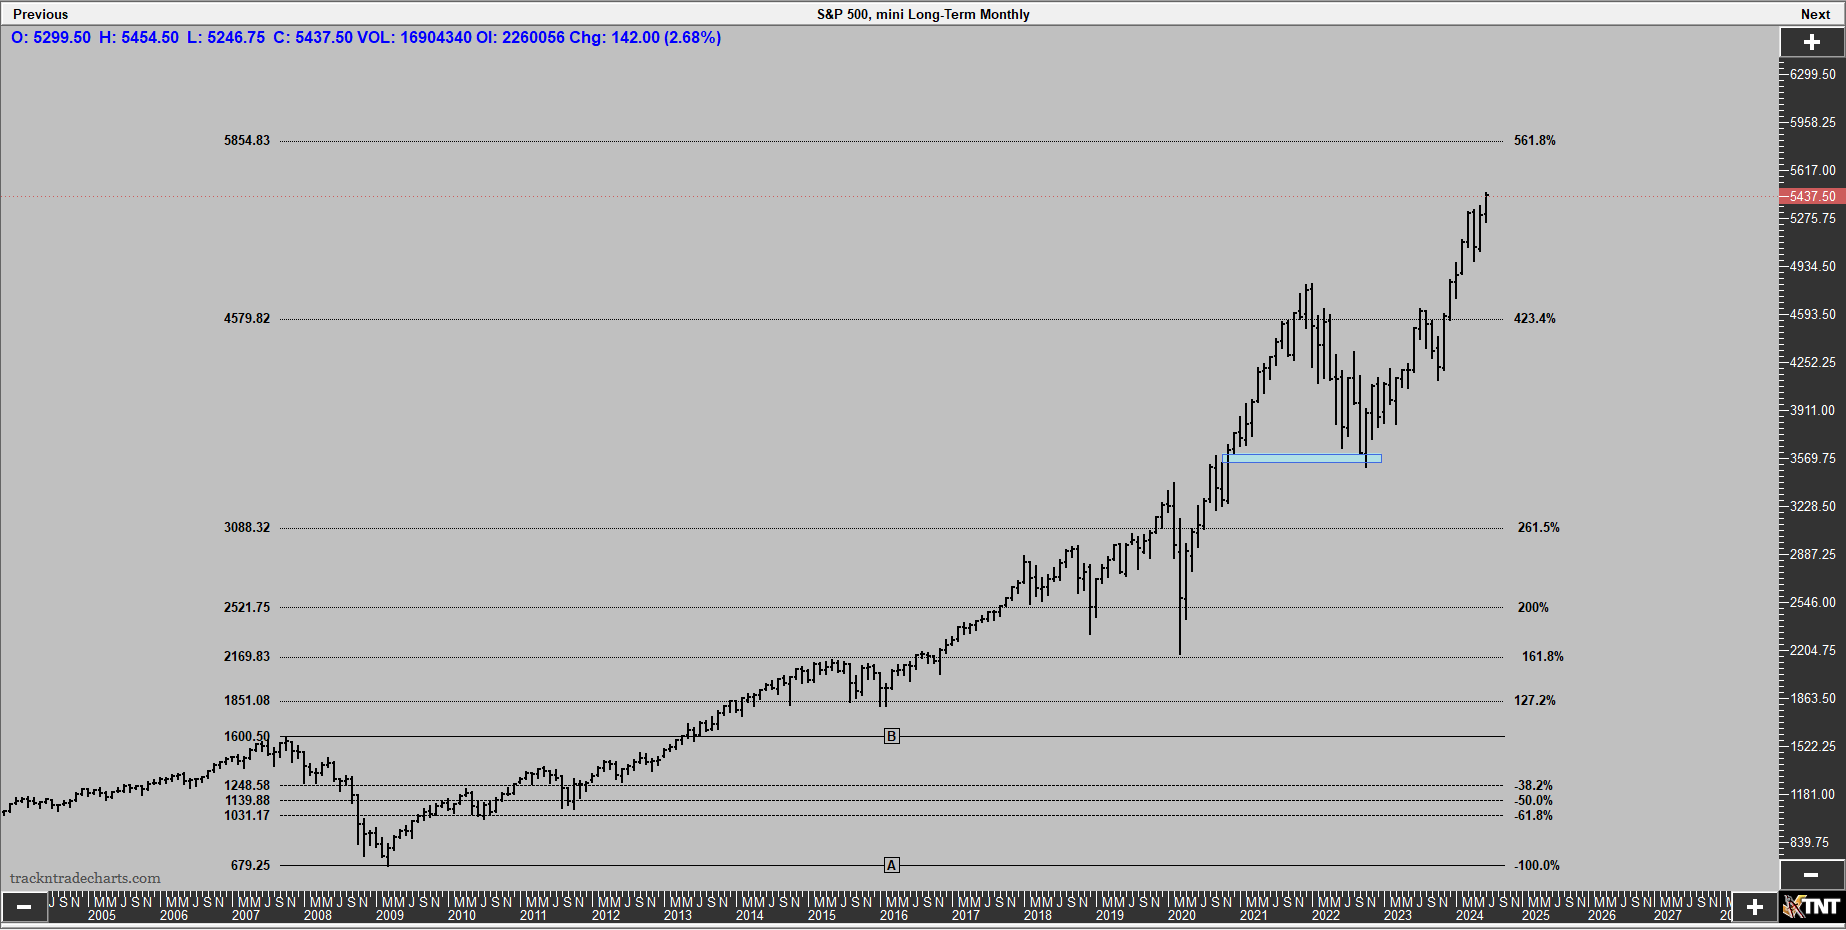
Weekly I would think fib. ext. 200% is possible, before a correction.

Daily were simply at the 1st OBJ.
Background we have a 5/23 upthrust followed by a 5/31 spring. Spring after a upthrust is generally a Bullish setup.
As always trade what you see!!

Thanks, gedigen!
I especially liked your note about the stops and showing how often the markets will go down/up to take out close stops, then IMMEDIATELY reverse in the other direction.
Good lesson on stop placement!

Thanks fays!
Agree with this place being a good one for a top with previous high resistance area orrrrr just like the other umpteen upside break outs in recent times.
https://tradingeconomics.com/united-states/stock-market
1. 1 week
2. 1 month


Friday triple witch and near full moon what a dance this going to be --!!tht i might be short in next contract rule over with stops!!!-----------------<>
thanks, fays!
Instead of a DANCE, this has been more like an ADVANCE, putting the top pickers in a TRANCE with their last CHANCE to keep their big losses from being real bad FINANCE (-:
https://tradingeconomics.com/united-states/stock-market


hi today is triple witch and area to watch Diana --5554 and my make or break 5605 and 5487 ish area and close for the Day can be very important as week is closing ---new contract rollover ---
Juno: 5565
5554 adhere -5605--5--mkts 1 o clock or 1300 Newyork time important !!
Possible downside reversal from test of June 20 contract high, falling just short of that high today on a spike up that peaked at 9:10 am, then crashing lower.
I'm always a little wary when this happens on a Friday and like to see what happens Monday.
Agree cutworm!
End of month profit taking possibly.
Ideally, bears would have seen a gap lower on the open this evening.
Top picking is often hazardous to the health of ones account.
As mentioned previously, "Top picking can be hazardous to the equity in one's account"
Using astrology definitely hazardous because the signals are based on shisst!
https://tradingeconomics.com/united-states/stock-market
5503 new moon and Pluto act as resistance-- full moon --5692ish -5792 or 55**ish trigger 4 urAnus/Mars also 1912 and 1929 common with 2007---March mid Friday --13 --- coincidence
coincidence
Yep!
While there is always the chance that there is something I must be overlooking(I studied this in the late 80s/early 90s) and for sure I don't know everything......astrology is relegated to people using it based on wishful thinking(hope) and the belief that it empowers them as well as those that use it for entertainment.
I love your charts and posts here..........and they have value but am also a professional trader for over 3 decades dedicated to authentic principles for people to learn and apply.
It's great for people to post on things that I disagree on, like this. I encourage you to continue to show your views and I will continue to comment sometimes on what my decades of experience tells me are bad ideas(based on authentic facts/science).
Readers can make their own choices.
Thanks, fays!
+++++++++++++++++++
With regards to astrology predicting markets. Astrology has been back tested in many realms with data and massive super computers and AI. There is no consistent correlation or causation JUST COINCIDENCE.
I can flip a coin 100 times and get a streak of 5 heads in a row!
Is this a pattern to predict the next coin flip result?
Nope, still 50-50 chance on each and every new flip. Similar coincidences happen everywhere around us, including in Astrology, that are NOT based on a secret, science and physics defying principle that Astrology Guru's, often selling their products know about.
fays,
I am serious about this. Please continue to share here, including your Astrology. I am open minded enough that, if there actually is something to it, I will eventually see it too.
At the very least, it makes our forum more interesting.
You can see now why there are not any posts about trading. When this place should be full of market and trading posts and only those. But as you can see why post any.
Myself: a trader for over 45 years.
Hi baker!
I generously post hundreds of solid, constantly updated trading and weather posts here every month based on what traders, farmers and others can use to be more profitable in their trading, business and use in other parts of their lives FREE OF CHARGE.
Which is just part of what we offer here that represents authentic science and ethical principles and politics and things to make the world a better MORE HONEST place……FREE OF CHARGE.
I also make it clear that this is an ANTI echo chamber because I will almost always call out bs when I see it from both political sides ..and try to do it respectfully…….
You are encouraged to offer more than bitching because you apparently cant handle me calling out bs astrology.
How about some good ideas on markets and trading?
For a trader of 45 years, one would think that you would have something worthwhile to contribute.
what have you got, baker?
what markets are you trading?
what are your best trades right now?
do you have any charts?
Fundamentals?
Please, contribute something.
Start a new thread. You’ll see that I will respond positively and MAYBE somebody else will too.
Bashing with no contributions is a dead end street on a forum and in life!
Be part of the solution, NOT the problem, please!
baker,
You're enthusiastically welcomed/invited to join the conversation to share some of your 45 years of trading expertise!
https://www.marketforum.com/forum/topic/104645/#105804
https://www.marketforum.com/forum/topic/105016/#105807
fays can obviously handle a bit of disagreement, with regards to astrology and understands our huge appreciation for his/her wonderful, positive trading contributions here!
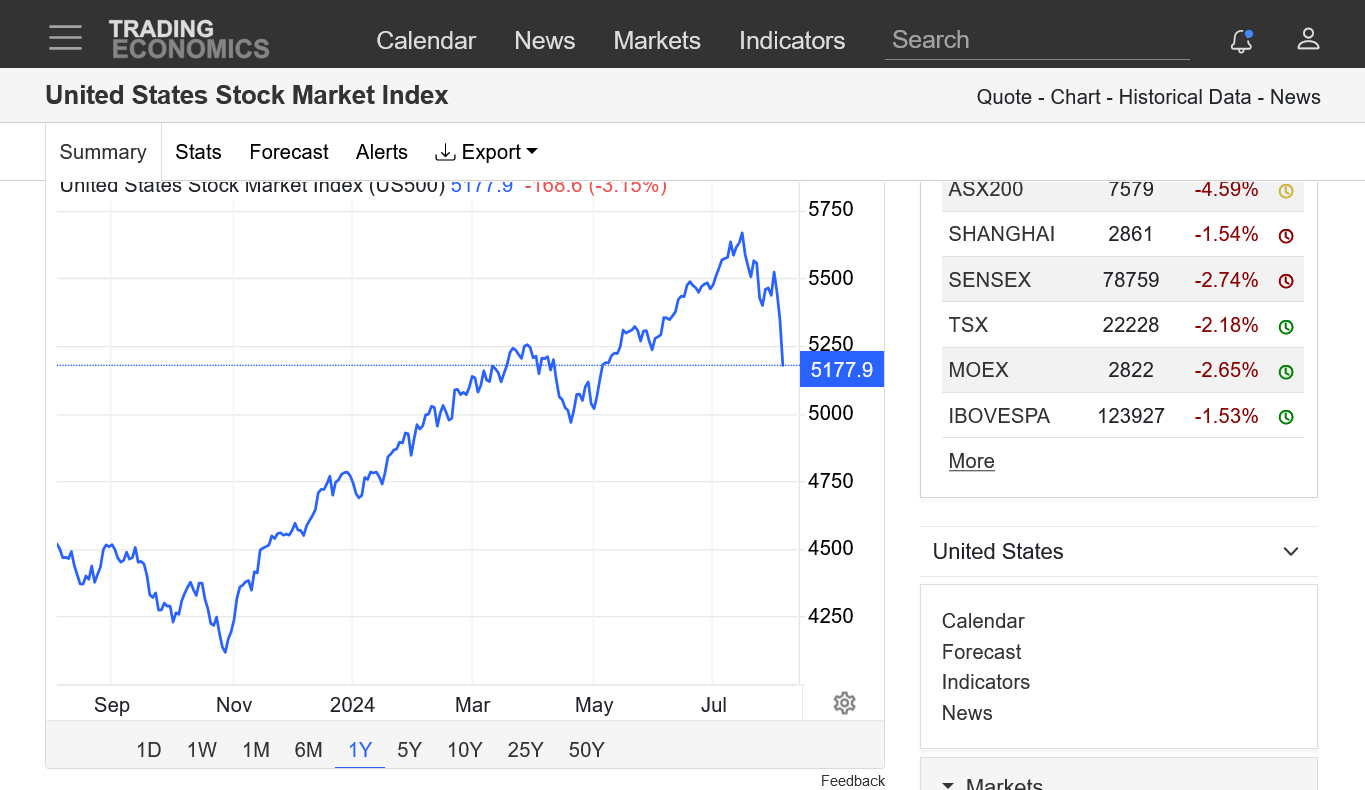
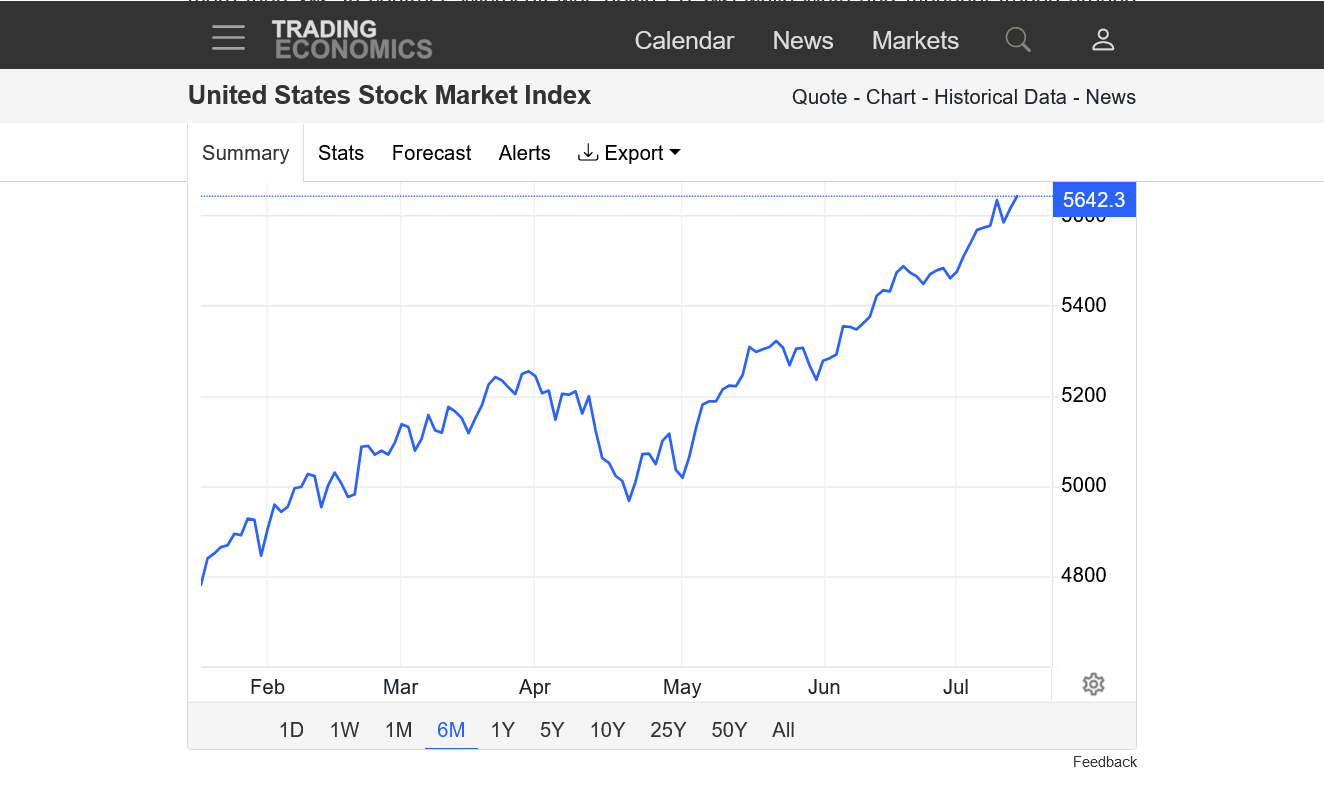
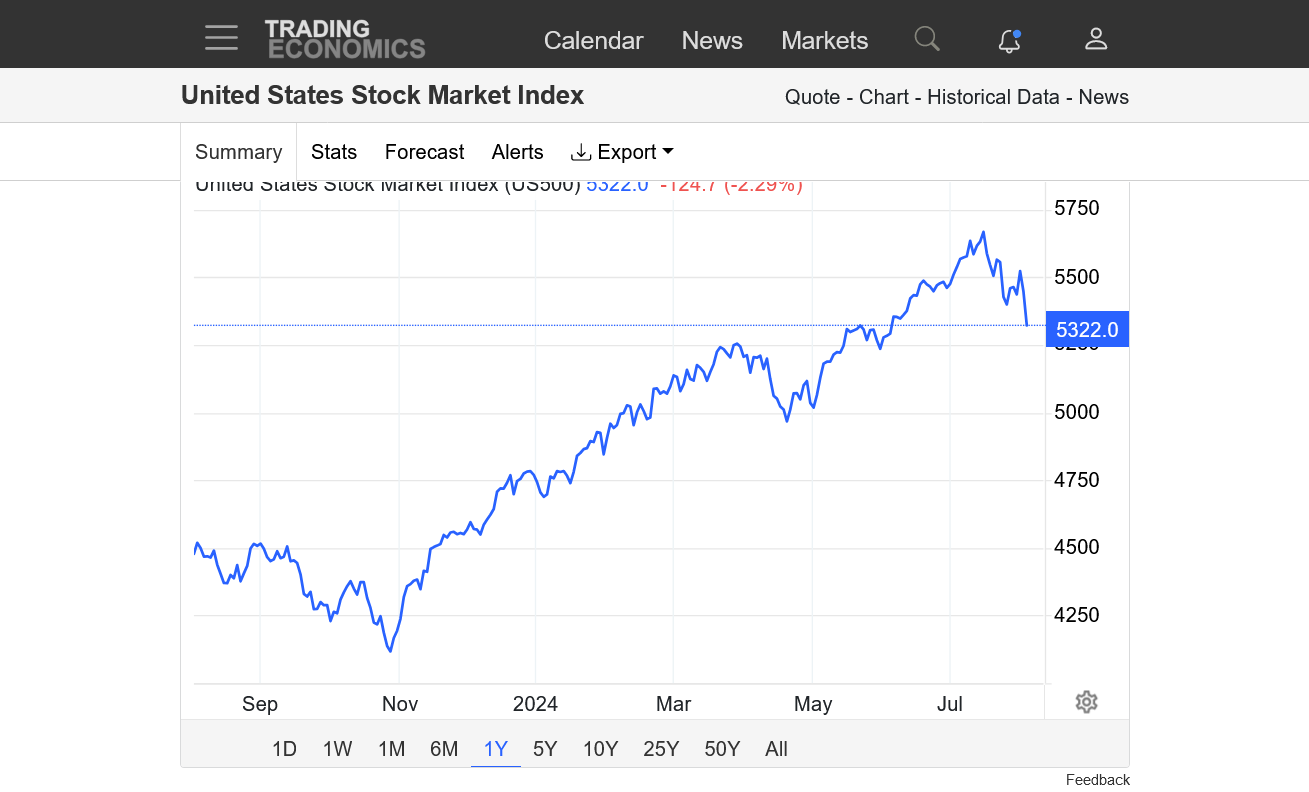
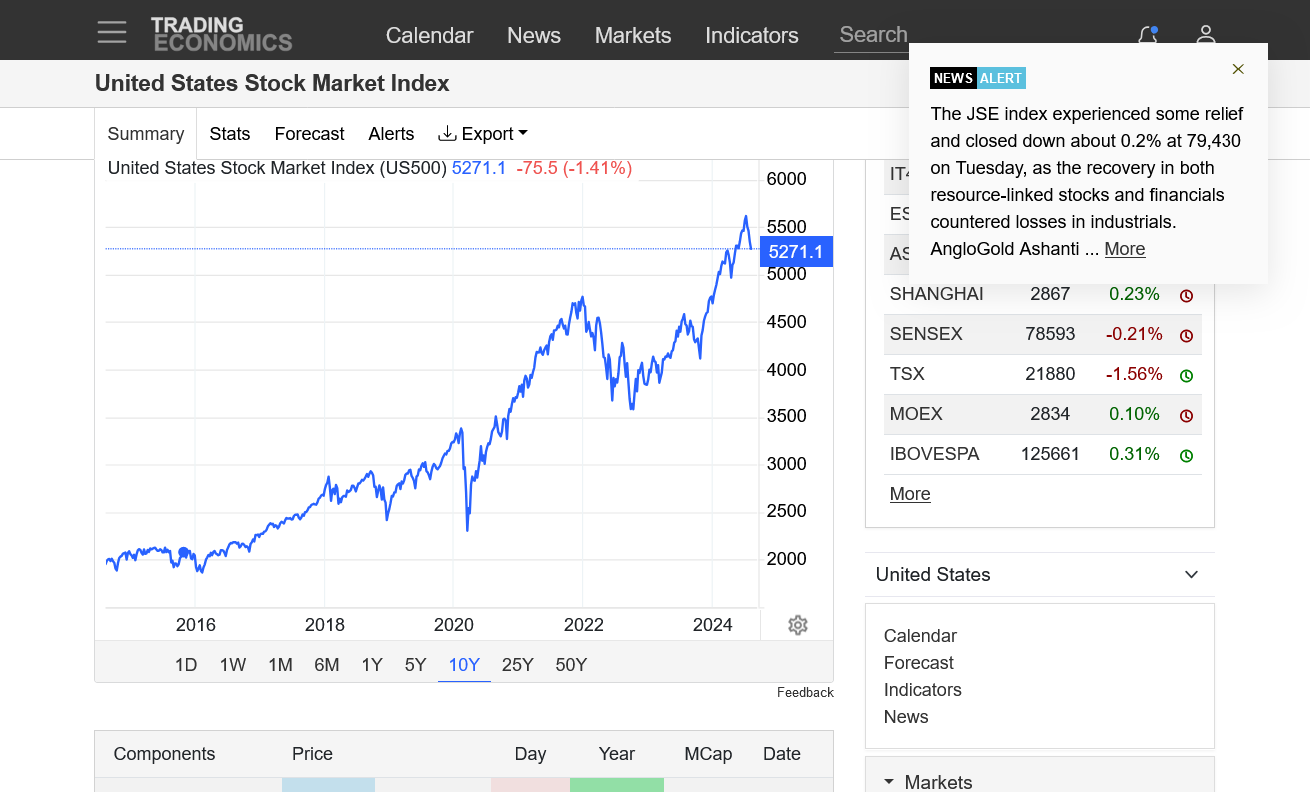
The SP 500 continues to make record highs with the assassination attempt translated into higher odds of Trump as our next president but the market is struggling to maintain the upside momentum! Charts with analysis in a minute.
https://tradingeconomics.com/united-states/stock-market
Analysis, using 6 charts below with different time frames:
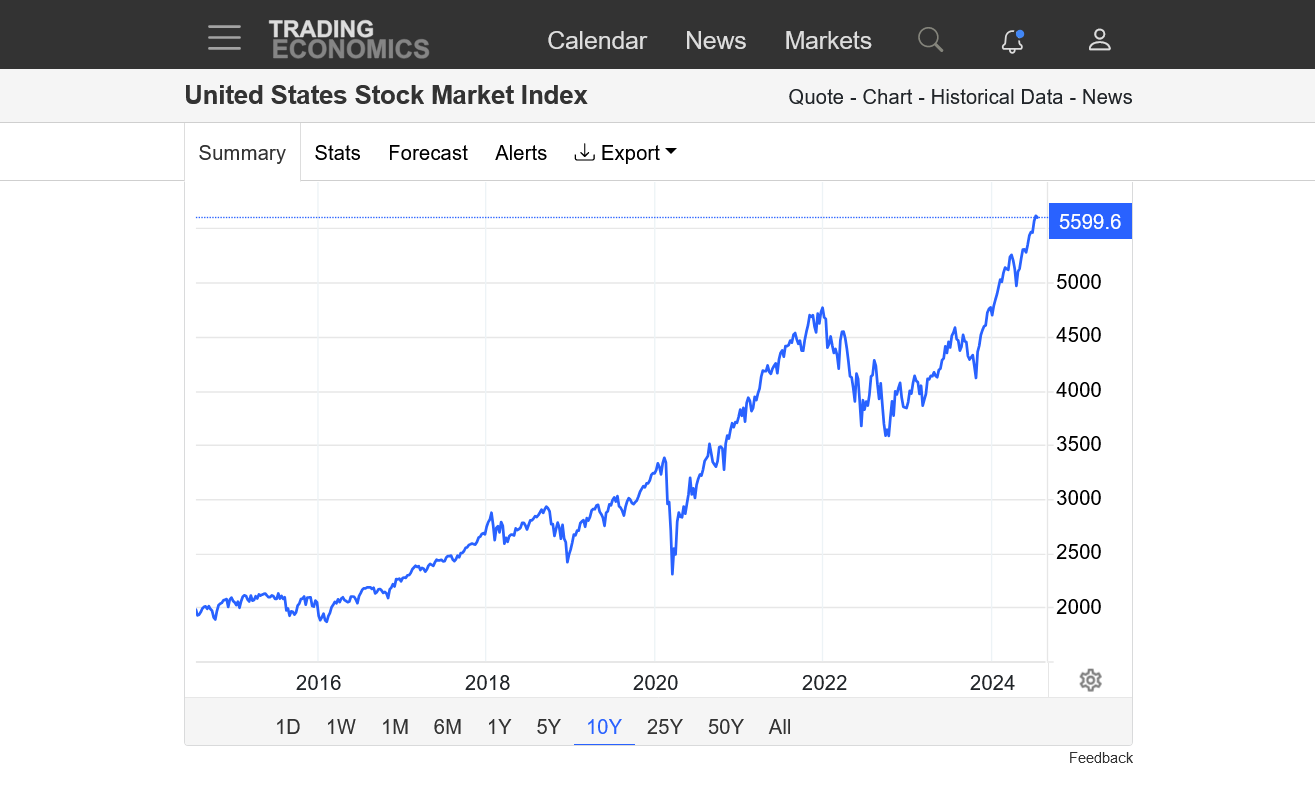
1. 90+ years: Massive, century long uptrend with PARABOLIC, increasingly steep slope in recent years. Parabolic slopes are IMPOSSIBLE to sustain in any market. They happen at the end of a long move up. In some commodity markets, they can be caused by a catastrophic loss in supplies and based solidly on fundamentals. In others, specifically the stock market they do NOT represent true value but instead are a speculative bubble with OVER valuation being sustained, in part by large specs increasing their bets and leverage, making the market more and more unbalanced and getting farther and farther away from true valuation. This market is an example of the "self fulfilling prophesy" principle based on the constant BELIEF of traders that the market will keep going higher......thus, the collective "composite man" of all traders combined, continues to make that happen with their investments and especially speculation bets. The lack of corrections as we would see IN A HEALTHY MARKET to keep it tethered to true valuations and balanced is reinforcement for people to view the stock market as a 1 way street. Top pickers(shorts/sellers) can actually help to sustain the move at new highs because they get run over and need to cover their position BY BUYING, when they cry uncle. As mentioned previously, picking tops in a market like this is often detrimental to your account balance unless you nail THE EXACT TOP, which is almost impossible to do for most people. In a parabolic move up, if you are just a bit early........the speculator can be completely wiped out on a large position because of the steepening slope with the move going against them/you.
But here's the thing. This move cannot go on forever. Despite this, many parabolic moves up go on much longer than those that use sane valuations predict it will. That's because EMOTIONS that include greed are driving it. IRRATIONAL EXUBERANCE!
2. 25 year chart. Same analysis as above.
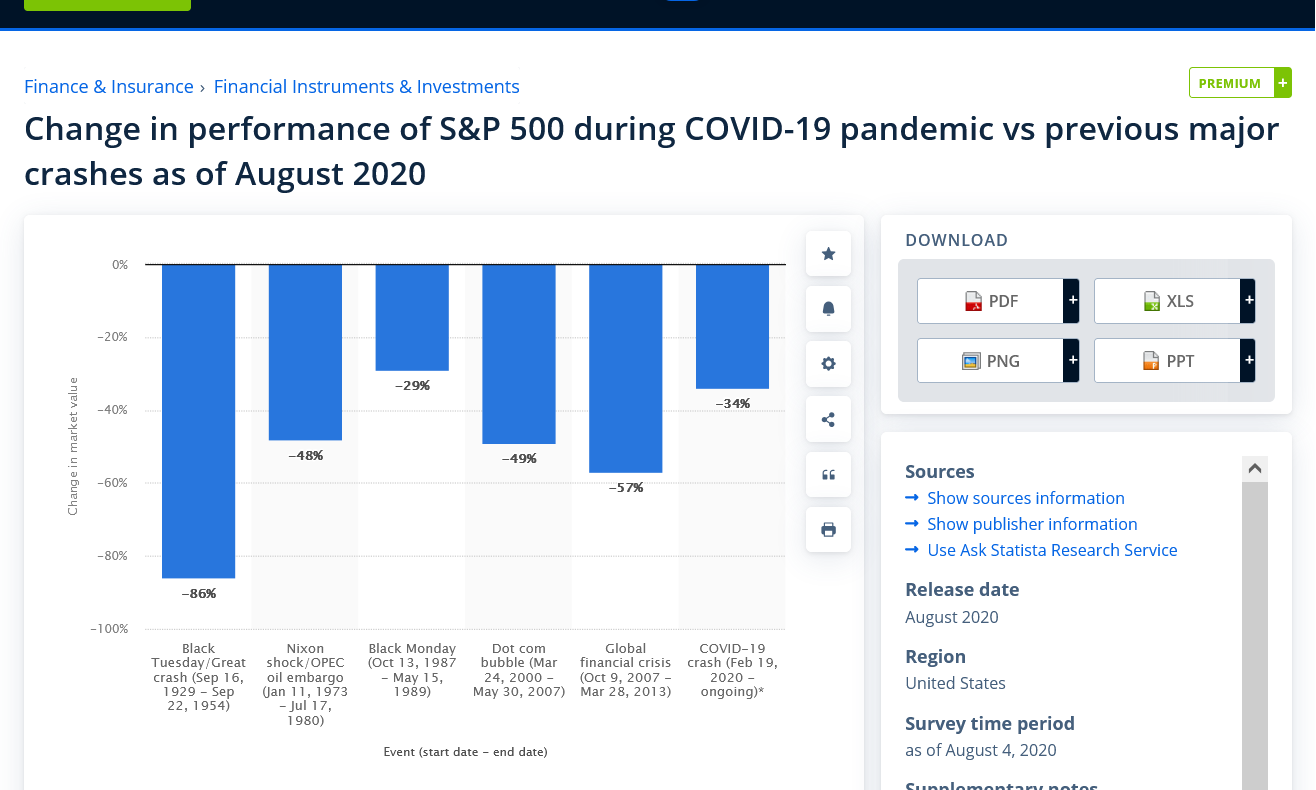
3. 5 years. Brief, spike down/correction in Feb/Mar 2020 because of COVID. That correction was over 25% IN 1 MONTH!! Brief correction Jan-Sep 2022, followed by a resumption of the uptrend and new highs
4. 6 months: New highs
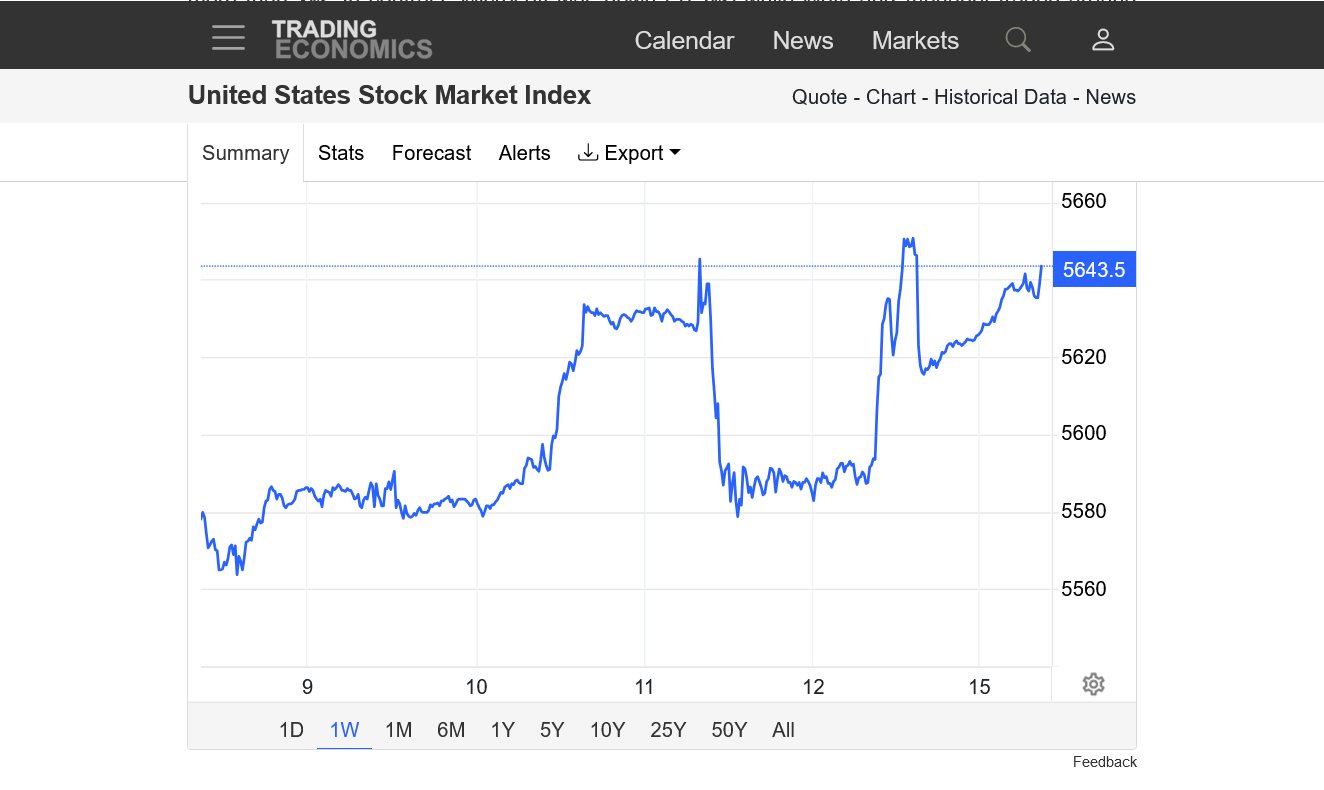
5. 1 month: Struggling at new highs to add to gains.
6. 1 week: Struggling at new higher to add to gains.
#5 and #6 represent a loss in momentum and short term warning sign for the bulls but in most previous cases, shorts that used that signal to put on a position.........ended up getting run over by the resumption of IRRATIONAL EXUBERANCE. When that emotion is taken away, as it was in early 2020 because of COVID, the market will immediately crash towards it's true valuation with overextended, especially recent longs at the highest prices becoming vulnerable. A correction in that environment can be fast and brutal because the market is so EXTREMELY OVERDONE, WAY PAST TRUE VALUE. COVID, was an example of a black swan event. But COVID market damage went away and IRRATIONAL EXUBERANCE resumed.
https://www.investopedia.com/terms/i/irrationalexuberance.asp


Re: Re: Re: Sp 500 diamonds for ever-- 1H chart top or 5581??
By baker - July 13, 2024, 7:04 p.m.
You can see now why there are not any posts about trading. When this place should be full of market and trading posts and only those. But as you can see why post any.
Myself: a trader for over 45 years.
+++++++++++++++
baker,
Still waiting for you to make a contribution with your own thread to discuss what YOU want to discuss here or to any of the dozens of generous trading/weather posts that I shared here in the last day.
Please validate your bash, so that I can change something to make this a better place for you and others.......and/or be part of the solution.
Again, complaining and bashing other people that are trying to make the world a better place is actually a big part of the problem in our world today.
Be part of the solution, please.
https://www.marketforum.com/forum/topic/105890/
https://www.marketforum.com/forum/topic/105866/
https://www.marketforum.com/forum/topic/105016/#105807
https://www.marketforum.com/forum/topic/104700/#105845
https://www.marketforum.com/forum/topic/105354/#105862
https://www.marketforum.com/forum/topic/104476/#105833
https://www.marketforum.com/forum/topic/104645/#105804
https://www.marketforum.com/forum/topic/83844/
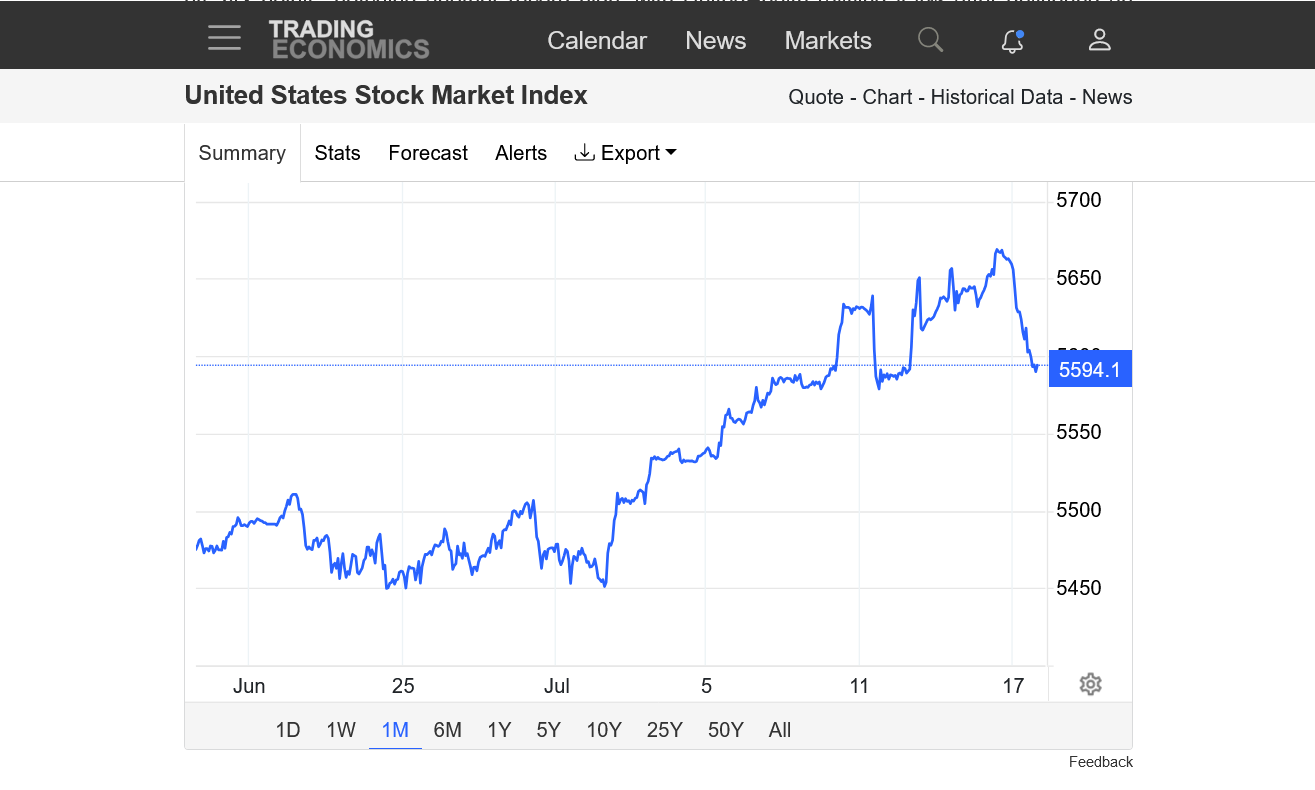
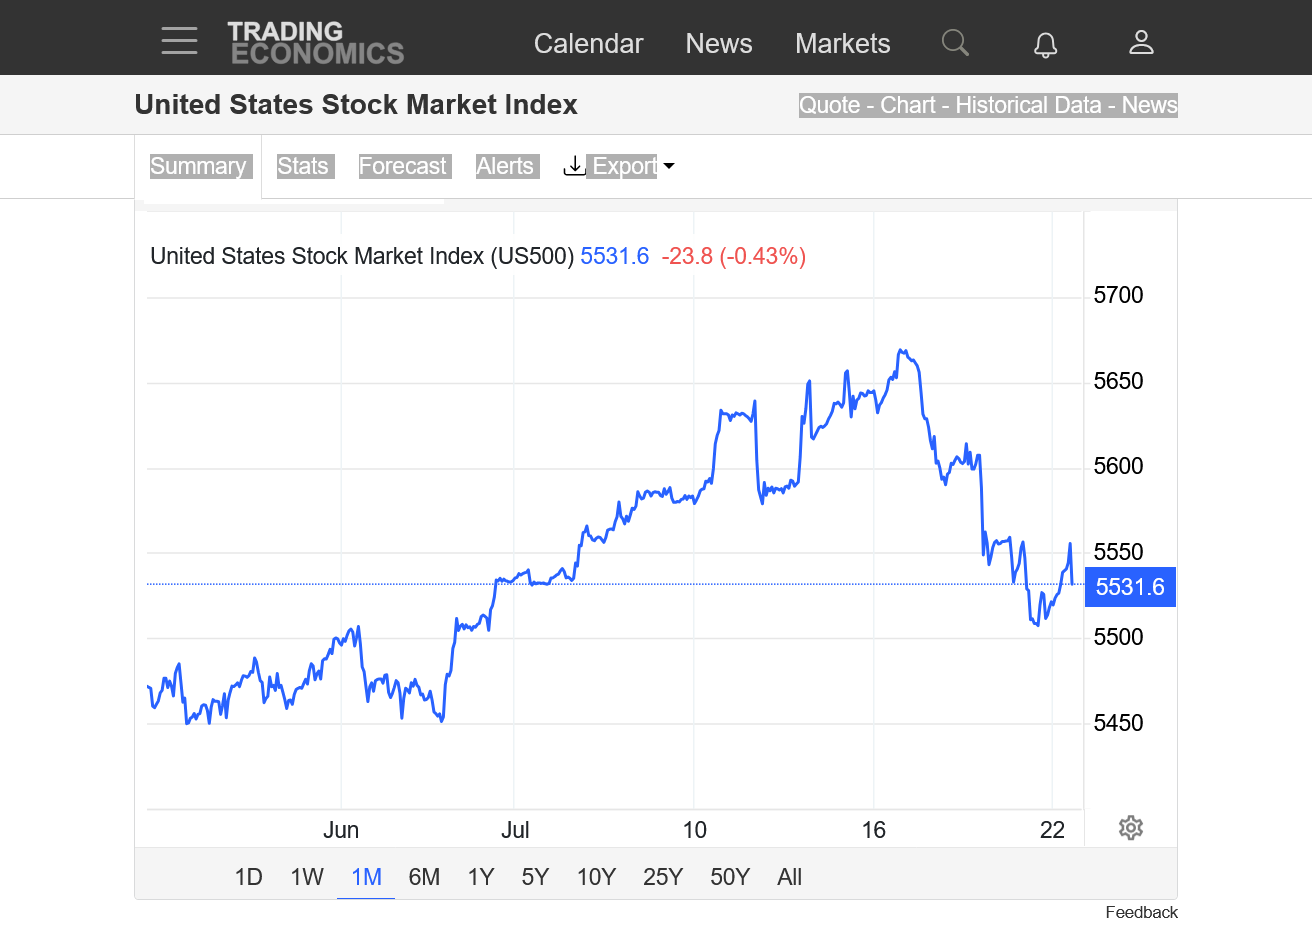
New record high close today! 1 month chart below.
https://tradingeconomics.com/united-states/stock-market

Transferring the stock market conversation from yesterday here:
Re: Re: IF'N YER INTO TECHNOLOGY STOCK.....
By metmike - July 17, 2024, 2:28 p.m.
I'll just repeat that trying to pick the exact top in a bubble is almost impossible for most people.
Extreme prices in markets that are rooted in supply/demand fundamentals/valuations, like energies or grains are very brief and more predictable because VALUE matters to consumers/commercial that are incentivized by true value.
If the price of corn went to $10 because the market ran out of corn, farmers would plant more corn to replenish supplies.
If the price dropped to $2, farmers would plant LESS corn.
Same with natural gas production/supply. Demand would also be altered and that would impact the price at extremes to REIGN THE PRICE EXTREME IN.
THE CURE FOR HIGH/LOW PRICES = HIGH/LOW PRICES.
Not so with the stock market, especially indices which aren't tied to fundamentals (like most commodities are) that cause huge players from 1 side to come out of the woodwork at points of extreme over/under valuation to substantively alter the extreme fundamental and get the market back into balance.......and the market MUST FOLLOW THEIR LEAD BECAUSE THE MARKET CARES ABOUT TRUE VALUATIONS.
With the stock/financial/economic markets, no such dynamic exists to dampen out extreme bubbles. The laws of diminishing returns that exist in most realms DON'T apply the same way.
https://www.investopedia.com/terms/b/bubble.asp
7 famous market bubbles
https://www.atomos.co.uk/knowledge-hub/insights/7-famous-market-bubbles
https://www.investopedia.com/articles/stocks/10/5-steps-of-a-bubble.asp
Economic bubble
https://en.wikipedia.org/wiki/Economic_bubble
An economic bubble (also called a speculative bubble or a financial bubble) is a period when current asset prices greatly exceed their intrinsic valuation, being the valuation that the underlying long-term fundamentals justify. Bubbles can be caused by overly optimistic projections about the scale and sustainability of growth (e.g. dot-com bubble), and/or by the belief that intrinsic valuation is no longer relevant when making an investment (e.g. Tulip mania). They have appeared in most asset classes, including equities (e.g. Roaring Twenties), commodities (e.g. Uranium bubble), real estate (e.g. 2000s US housing bubble), and even esoteric assets (e.g. Cryptocurrency bubble). Bubbles usually form as a result of either excess liquidity in markets, and/or changed investor psychology. Large multi-asset bubbles (e.g. 1980s Japanese asset bubble and the 2020–21 Everything bubble), are attributed to central banking liquidity (e.g. overuse of the Fed put).
In the early stages of a bubble, many investors do not recognise the bubble for what it is. People notice the prices are going up and often think it is justified. Therefore bubbles are often conclusively identified only in retrospect, after the bubble has already popped and prices have crashed
++++++++++++++++++++++++++++++++++++
Re: Re: Re: IF'N YER INTO TECHNOLOGY STOCK.....
By metmike - July 17, 2024, 3:04 p.m.
Is the current stock market a bubble?
With near certainty it is a bubble!
In extremely overvalued markets like this that are bubbles that are still going up, by definition you still have more SPECULATORS throwing their money at the market with reckless abandon that overwhelm all other elements and cause the 1 best to use identifier of a bubble.........the parabolic slope of the move up in the later stages.
Here it is with the latest SP chart.
Note the steepening UNSUSTAINABLE SLOPE of the move up. This is launching the price into the stratosphere and putting more and more distance between the price and valuation.
Does anybody really think that the Intrinsic/true value of the stocks in the stock market are worth 5+ times what they were 14 years ago?
Are those companies making 5 times more?
Is people's income 5 times more?
Is our GDP 5 times more?
The stock market has long ago departed from being a tool rooted in intrinsic value but instead is a massive, speculative bubble.
Eventually, all bubbles pop.......but they can go on as long as the IRRATIONAL EXUBERANCE AND SELF FULFILLING SPECULATIVE MONEY FEEDS THEM.
This one could go on for another X amount of time. Or it could end suddenly today with a black swan event..........like the assassination of president/likely president.
When the bubble ends, the correction is brutal and is correlated with how extreme the bubble was.
Since we know these companies in the stock market have intrinsic value, the stock market is not going to 0 but based on the OVER valued nature, a correction of 50% is possible really fast, and it would only have us closer to the true value.
That's not a prediction.......but its unlikely, that in 2030, this bubble will NOT be popped at some point with a brutal correction. Its conceivable that the market could take another 10 years to recover the losses from the top?
Speculators/investors that buy at the top of the bubble could take an extremely long time to just break even.
I'm not predicting, just telling you what the EXTREME RISKS ARE WHEN YOU BUY SOMETHING IN A VERY MATURE BUBBLE!
1. 50 YEARS
2. 10 YEARS-COVID CRASH Feb/Mar 2020. Bull flag/pennant/wedge 2022.
https://tradingeconomics.com/united-states/stock-market

https://www.statista.com/statistics/1175227/s-and-p-500-major-crashes-change/
Re: Re: Re: Re: IF'N YER INTO TECHNOLOGY STOCK.....
By metmike - July 17, 2024, 4:47 p.m.
Larry Kudlow: This stock surge is not a coincidence
https://www.youtube.com/watch?v=vu7XokdpCRg
+++++++++++++
New all time highs followed by reversal lower today:
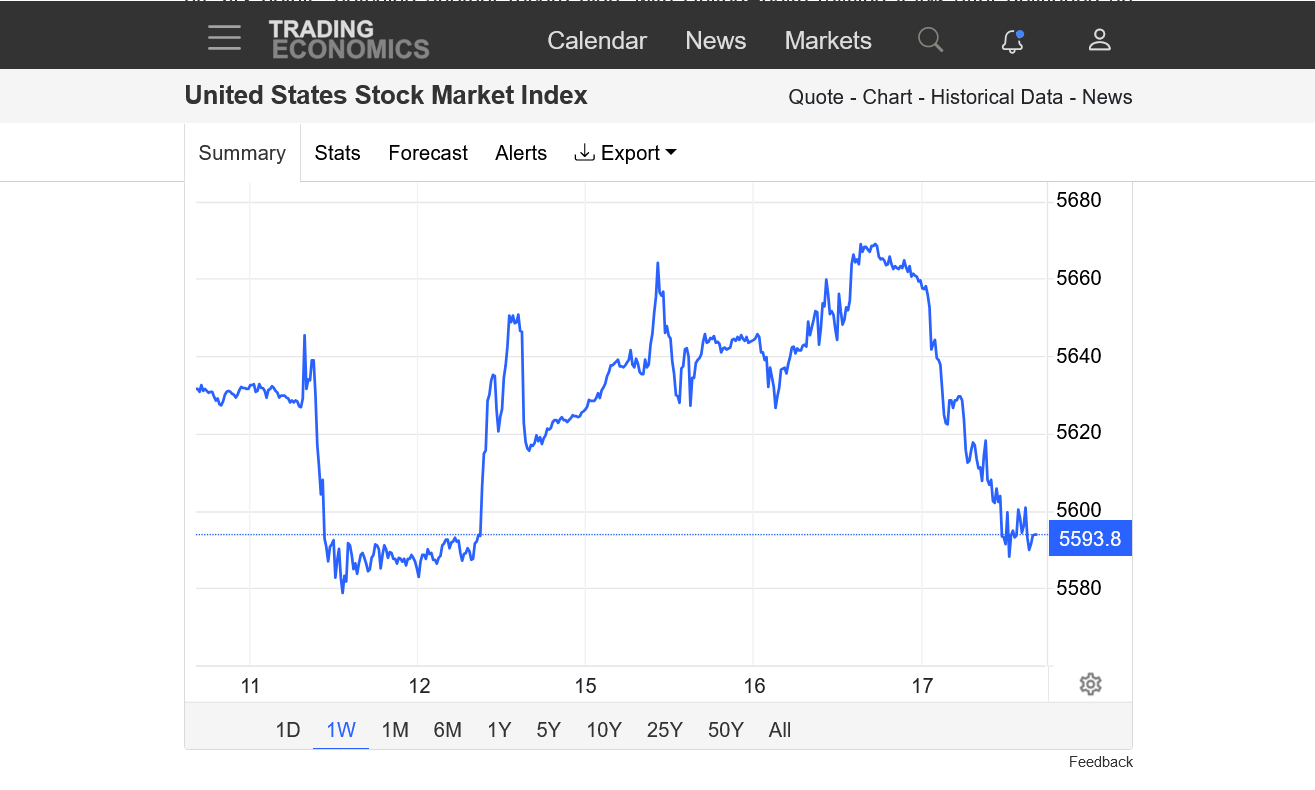
1. 1 month chart below.
2. 1 week
Selling signals are flashing on the screens for some short term traders.
However, top picking, historically has been damaging to account balances.
https://tradingeconomics.com/united-states/stock-market
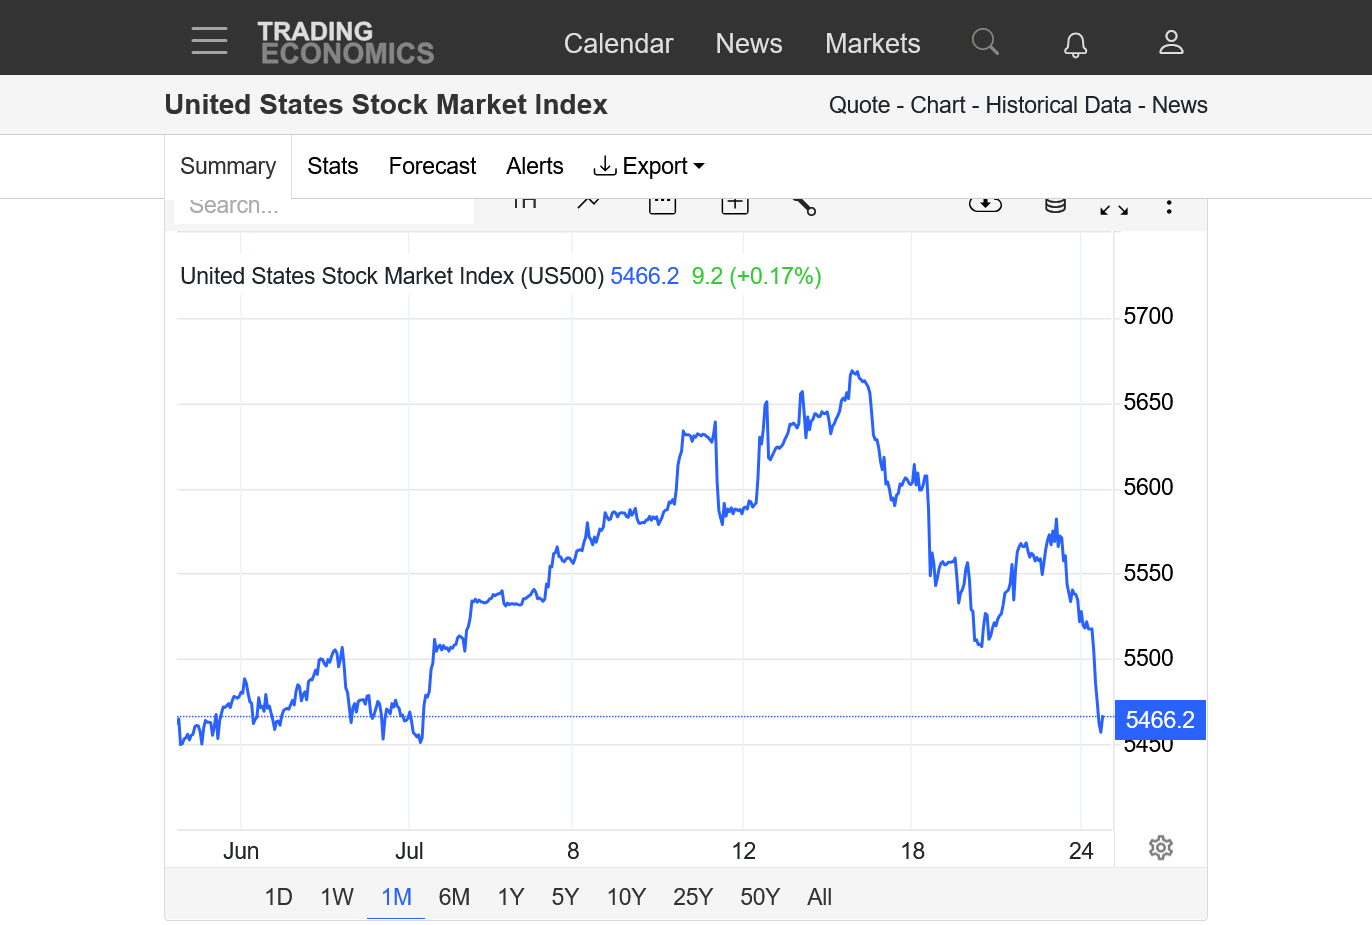
IF'N YER INTO TECHNOLOGY STOCK.....
By metmike - July 18, 2024, 11:40 a.m.
Follow thru from the short term selling signal mentioned yesterday/Wednesday afternoon.
https://tradingeconomics.com/united-states/stock-market
this is not my count some tinden has counted it i like it my wave is near or almost future where i can aspect 5644/5662 ih area there it goes lower to ---5502 ish area ! 26 july next turn and Major top out 6 aug around area like it did in 1929
Thanks, fays!
Short term sell signal still valid but in a bubble, those often don't last long.
One of these times it will actually mark THE top.
https://tradingeconomics.com/united-states/stock-market


5541--5621 rage ---important --day projections in my view !!
Thanks, fays!
I would pick 5450 and 5650-ish as the key SHORT TERM support/resistance right now, with the noted sell signal from last week still valid.
Just above 5500 shows some good support too, that held SO FAR today.
https://tradingeconomics.com/united-states/stock-market
No change to the short term, downside direction outlook from last weeks signal.
We are right at some support from around a month ago......5450 as noted last time, which looks vulnerable.
After that, a pretty big drop to 5320-ish.
I do NOT trade this market and am not predicting anything but am just having fun sharing analysis with fays (who apparently does trade it)
https://tradingeconomics.com/united-states/stock-market
agree that if this time any pullback unable to break 5522// and *5551 ish area thn strong chart point for this week 5408---5330----!!
Thanks, fays!
On this chart. we bounced off of 5400 like it was a brick wall earlier. No predictions on where it goes but this "correction" lower could take on another bull flag/pennant signature....depending on what happens.
It could always be THE top but top pickers in recent years have had their heads handed to them.
https://tradingeconomics.com/united-states/stock-market
5330 before new moon!!
Thanks, fays. We've already dropped below 5330.
5250, then 5000 are the next downside targets.
Then 4780, then 4500, if we keep going down.
++++++++++++
Again, no predictions but we have had a very mature, parabolic move higher (bubble) that at some point, will run out of buyers at unsustainable high/over valued prices. When that happens, sellers will have to push prices MUCH LOWER to find buyers.
This might not be THE top but this is what THE top may look like.........and this COULD BE THE top.
Many trading programs are flashing early sell signals here after the failed attempt to go higher.......which becomes tougher and tougher as we get higher and higher.
If we go thru some key support levels, momentum and long term trend following systems for the large funds could trigger sell signals and with this market, so, SO unbalanced, short term volatility and downside risk could become extreme.
https://tradingeconomics.com/united-states/stock-market

This is another strong indicator of an economy rapidly contracting and recession starting.
Natural gas prices have their lows at the end of Winter in almost every year for seasonal reasons(cold is over and its time to fill up storage).
The exceptions to that happen from recessions. 2020, and 2009 for instance, when ng prices also dropped into the Summer because of the huge cutback in industrial demand for natural gas from the manufacturing sector, for instance that happens in recessions.
The price of natural gas has only been this low for extremely brief periods the past 25 years.......and NEVER in August.
The last time ng was LOWER than this in August was almost 3 decades ago.
There is something extremely powerful going on right now!!!!
https://tradingeconomics.com/united-states/stock-market
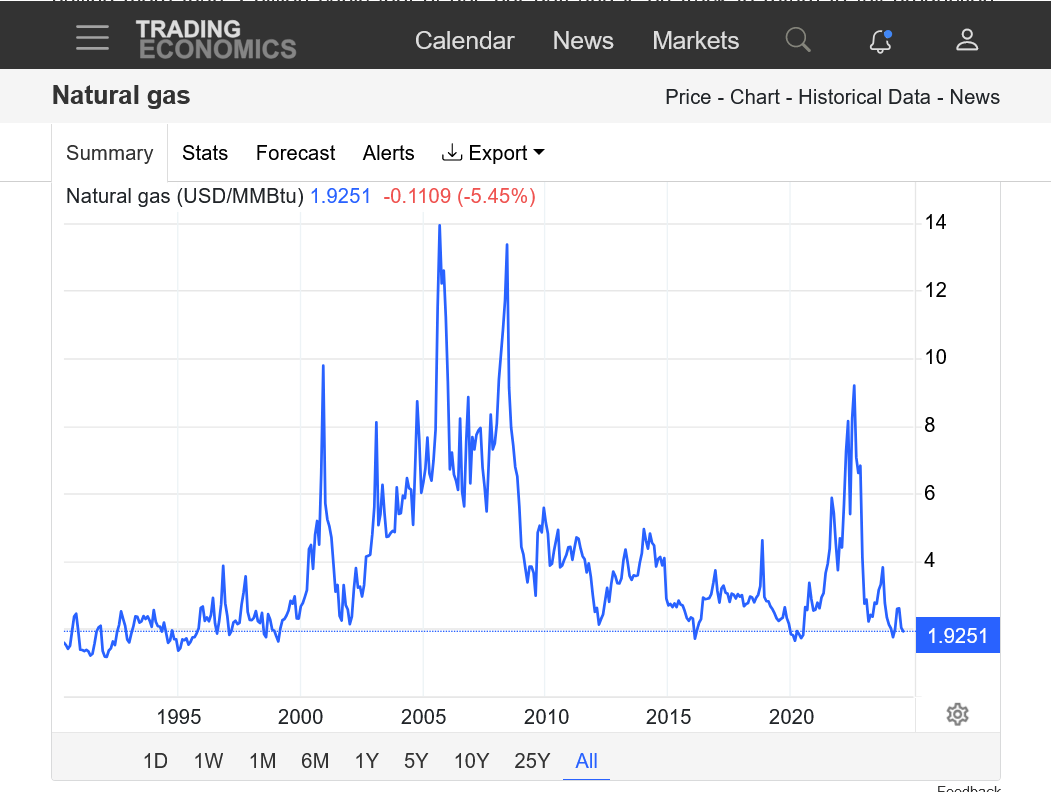
Natural gas in storage is pretty robust and makes us especially vulnerable. Temperatures will be very warm but not extreme heat.
https://www.marketforum.com/forum/topic/104476/#106334

Note: The shaded area indicates the range between the historical minimum and maximum values for the weekly series from 2019 through 2023. The dashed vertical lines indicate current and year-ago weekly periods.
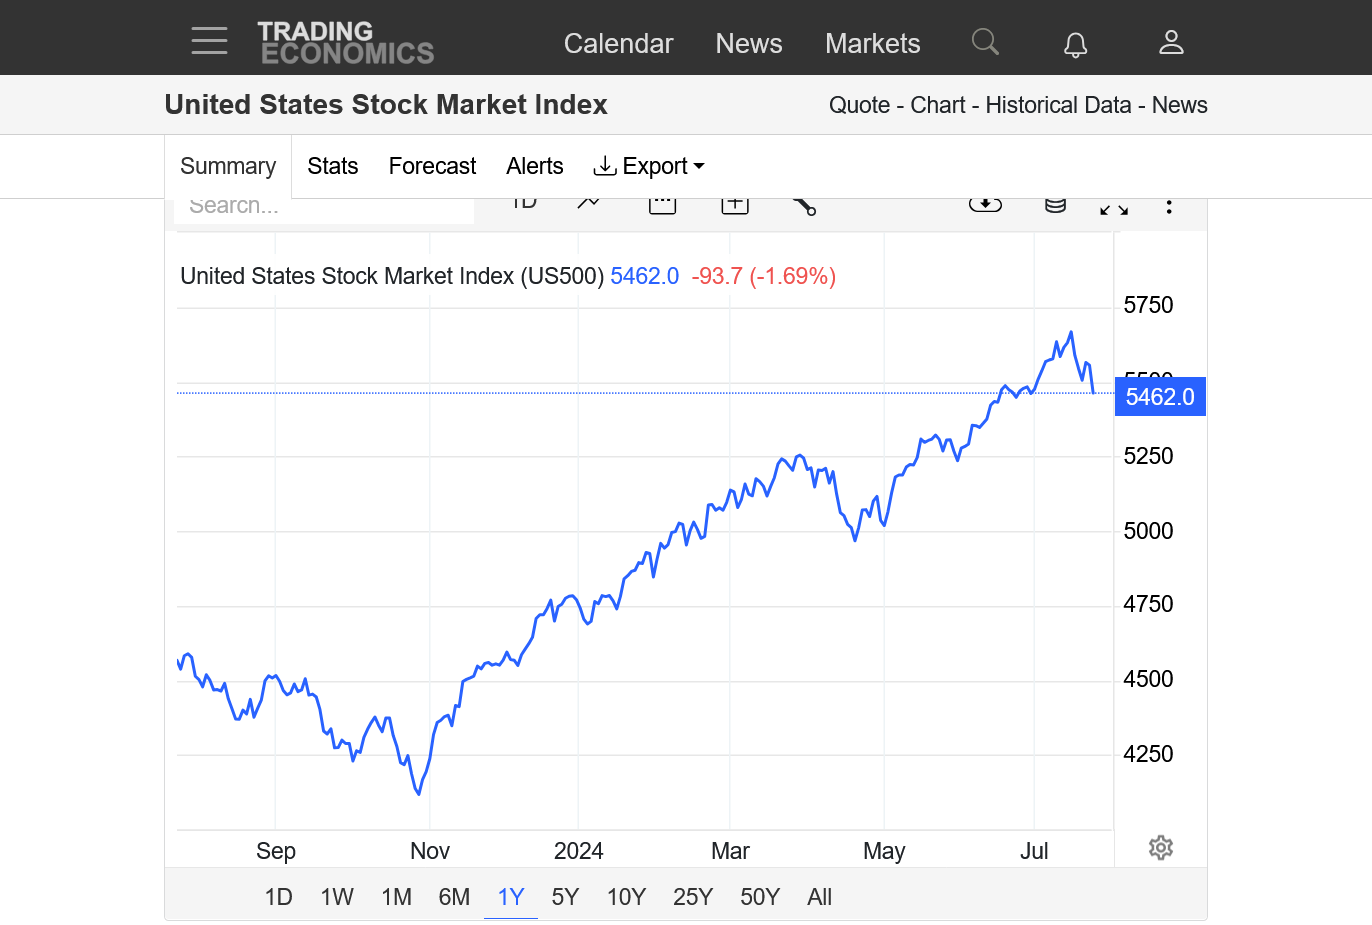
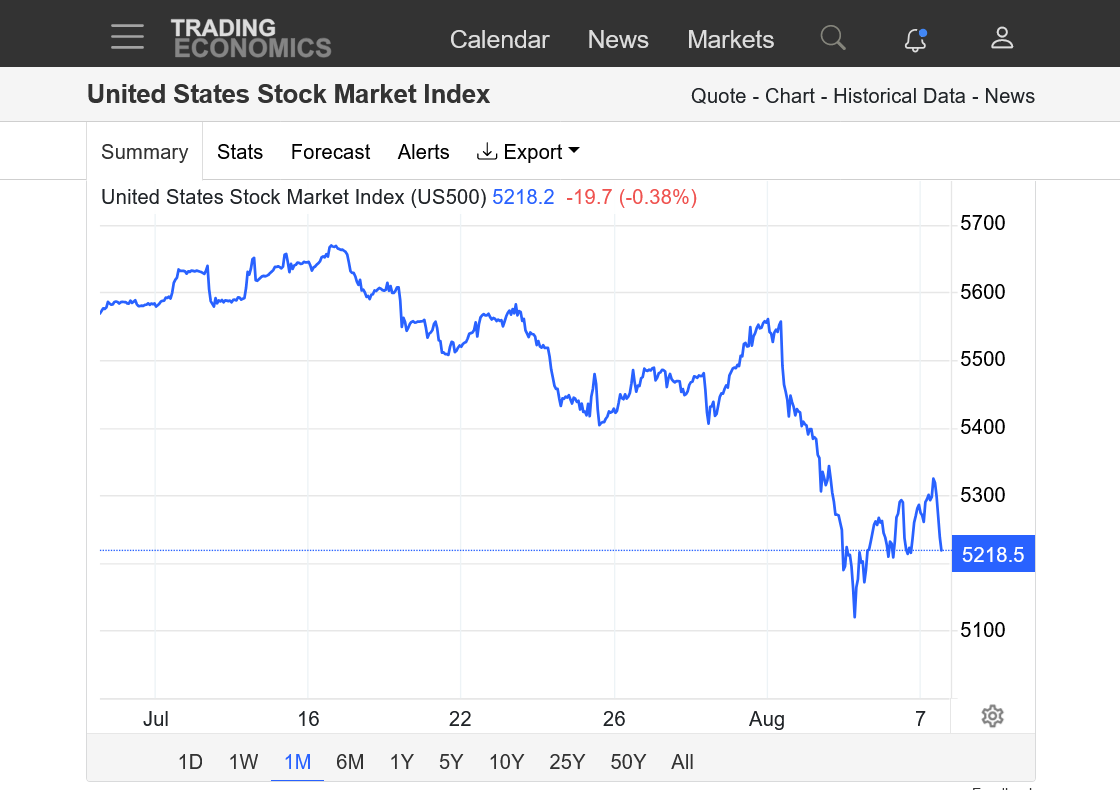
1. 1 year chart. Today's close was BELOW the trendline drawn from the Nov-2023 low to the April-2024 low and broken but retested with the late July 2024 drop/rebound. Remember, the trend is your friend. When a trendline is violated or broken it's an extremely significant technical warning sign at the least....... indicator of a trend change at the worst. This is just one indicator but it tells us clearly that the move up has lost all of its momentum. We closed BELOW THE SHORT TERM TRENDLINE today. That doesn't mean the market can't get above it again but it must now PROVE THAT IT CAN because the new assumption based on classical technical analysis is that the old, steepest/shortest trend going back to last November has been broken.
2. 10 year chart. I'm showing this one to point out what a parabolic move(steepening uptrend lines) in a bubble looks like.
a. Note on this chart the prevailing, not so steep up trend from 2016-2019. Very sustainable.
b. Then COVID hit as a Black Swan Event and we spike collapsed with panic selling and a brief 30% correction that violated the previous trend.......only to quickly recover and start a NEW MUCH STEEPER uptrend, drawn from the March 2020 COVID low to the October 2022.
c. The recovery from the October 2022 correction started a 3rd EVEN STEEPER trend. Going from October 2022, to the correction of October 2023.
d. After the very brief, October 2023 correction is when this last EVEN STEEPER trend started, defined on the 1 year chart just described above, from the November 2023 low to the April 2024 low to the July 2024 slight break of it, retest and attempt to get back above it BUT MASSIVE FAILURE with this weeks plunge decidedly thru it.
3. 6 month chart. One can make a case that we have a new DOWNtrend which is even steeper than the last, steepest uptrend in d. This is very expected in bubbles that feature an unsustainable, increasingly over valued price because they get farther and farther away from true value. When they run out of irrational exuberance fuel they have much farther to fall and do it even faster than they went up because the trend followers feeding the bubble with more and more speculative money over time, take profits or protect from greater losses in a frenzy with so many trying to sell at once and the buying has dried up.............so prices have to drop to a level to uncover enough buyers to match the sudden surge in selling. It's almost always what happens when bubbles break.
Most trend followers the last year were not buying based on value because we've distanced ourselves from that a long time ago. In 2020, we dropped far enough and had not gone parabolic where buyers stepped in based on perceived value.
Up here? We are double that 2020 stock market price here, where buyers jumped in to end the 2020 spike low. Are these stocks and companies worth 100% more than they were just 4 years ago? Not many are. It's hard to imagine investors looking at many stocks today as great value at these extremely lofty levels.
The extreme political turmoil and very likelihood of a recession already starting(in part because of poor management by a fed making another blunder by keeping interest rates too high for too long-after keeping them too low for too long and the worst Fed Chairman in history). Would be a fundamental reason that has triggered the top.
Again, I don't trade or predict the stock market but love technical and fundamental analysis of EVERYTHING.


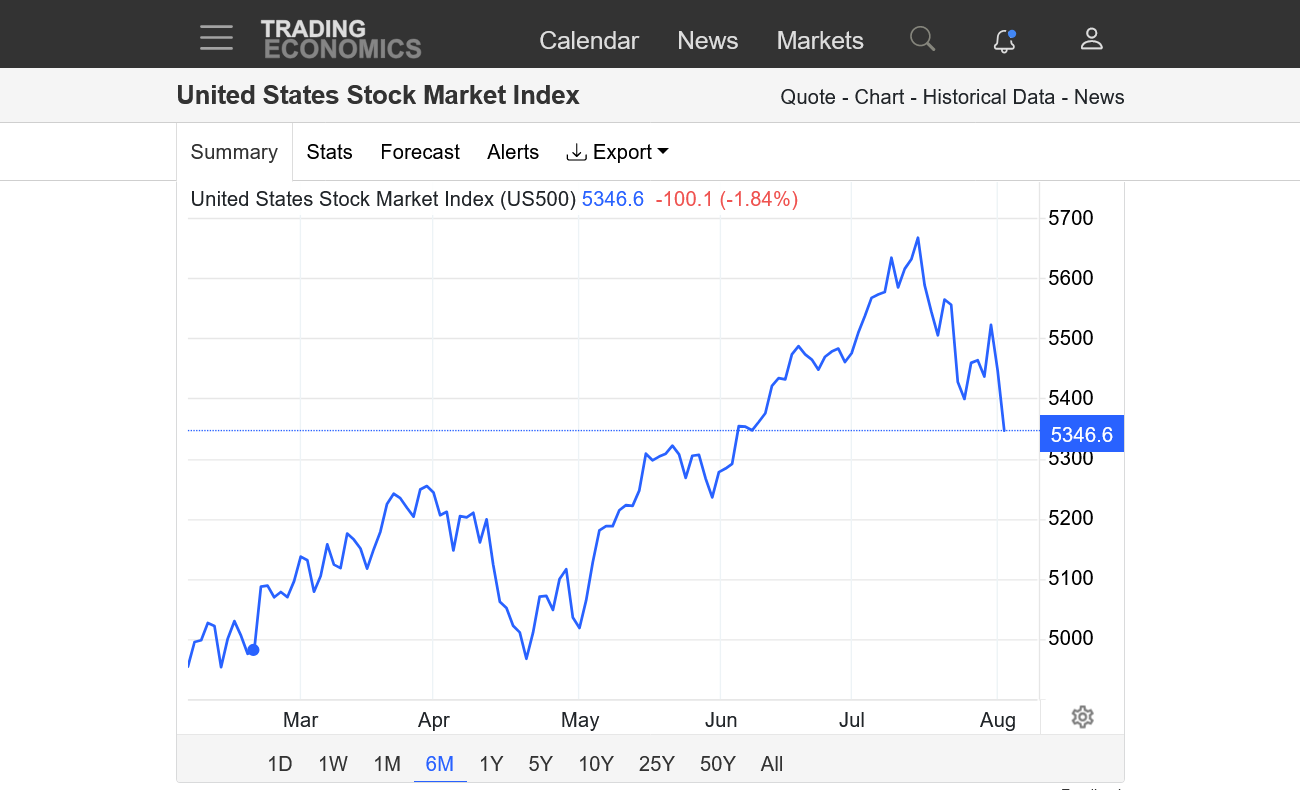
In addition, seasonally, early August is the WORST time of year to be buying stocks.
Especially with the added uncertainty of this election coming up and Harris looking like the winner(a negative for the stock market vs Trump)!
https://tradeproacademy.com/stock-market-seasonality-explained-find-right-time-buy-stocks/

S&P 500 Index Returns In U.S. Presidential Election Years
There are many factors that impact stock market returns, but one common concern of investors is how the stock market will be impacted by a change in America’s President. In past election years, the S&P 500 Index has seen more positive performance than negative. Below we take a look at S&P 500 Index performance during presidential election years, which have historically provided positive gains for stocks.
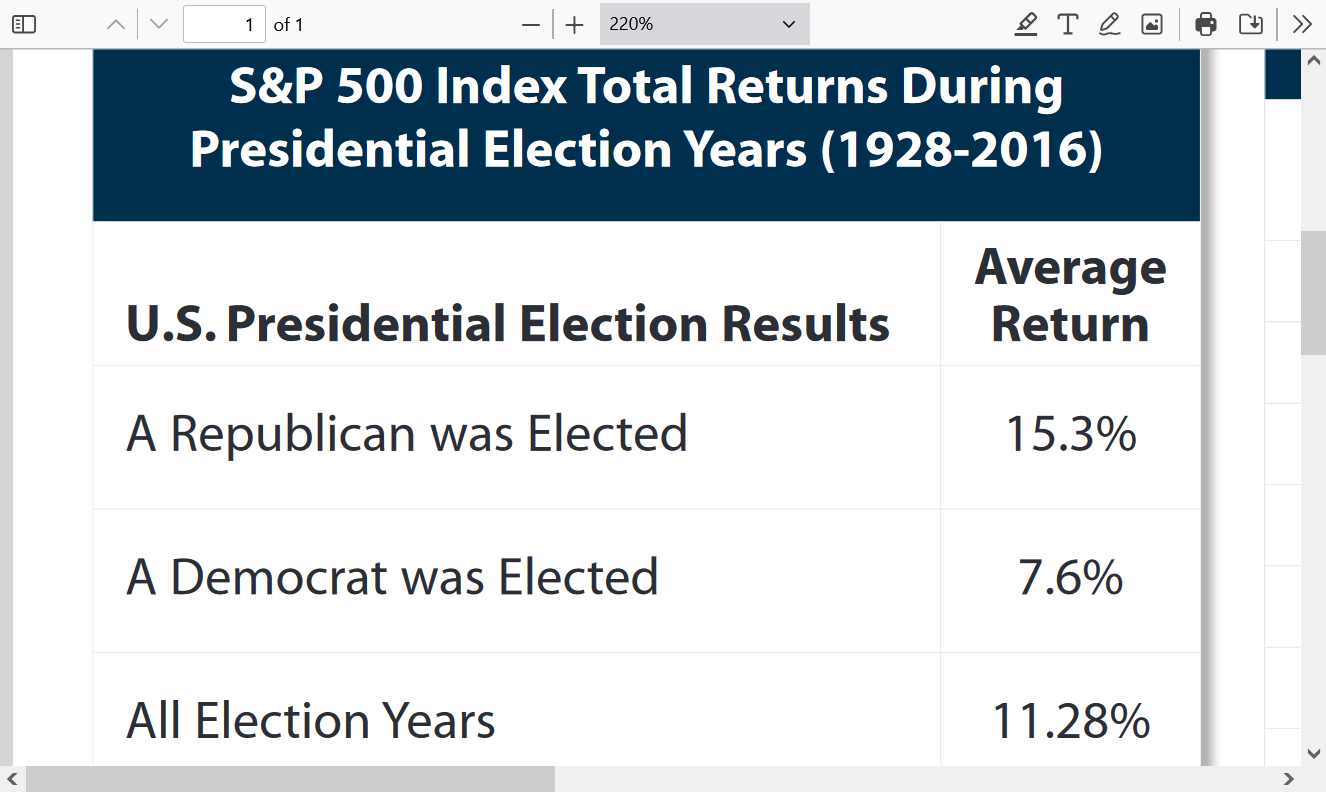
However, every year is different and this is just based on almost a century of data averaged out.
None of these previous years featured a mature parabolic move/bubble like we've had and the market in August 2024 is especially vulnerable because of those dynamics and a potential recession hitting.
Again, these are just a bunch of authentic facts that CAN impact the stock market to go with others that I don't know and it's not a prediction.
This year, the most important element may be an impending recession that disrupts the irrational exuberance, excessive buying mentality which has fueled the unsustainable parabolic(bubble) move higher.
4Hourly charts anD new --Start --if break above5554 or break below 5200 ish area might decide and try to share COT for further Directions

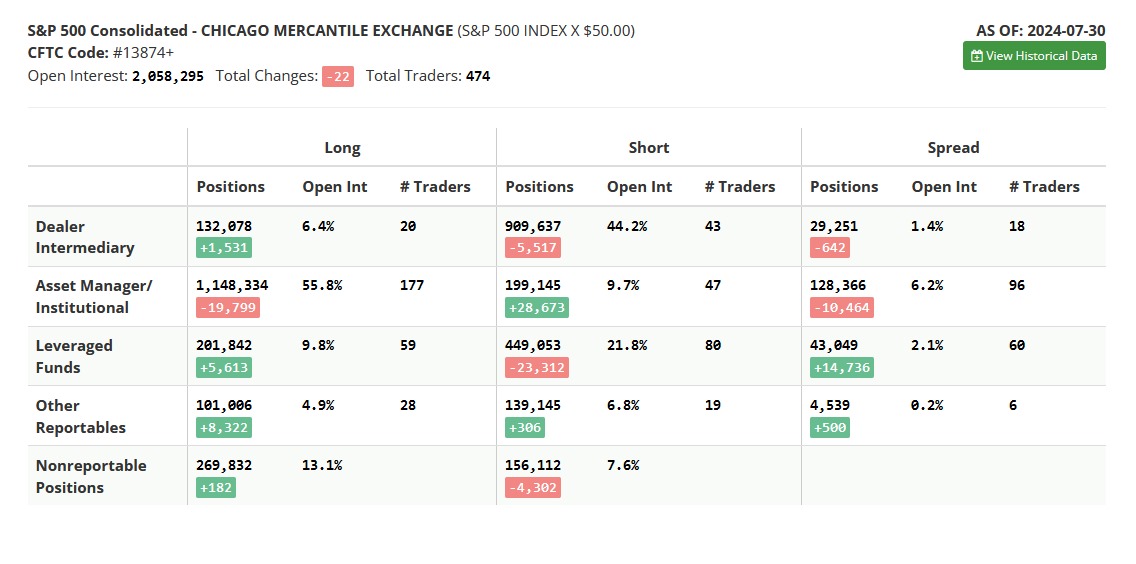
Thanks VERY much, fays!
This is a great contribution. Analyzing the COT allows traders to see where the big traders have their money and what changes were recently made, which can sometimes be a clue to their mentality.
It can be very different for different markets.
In the grains, for instance, producers/farmers are growing something that is communicated with well defined metrics to track SUPPLIES (often from new crop weather conditions) in the US and world.
In contrast, commercials define the DEMAND sector.
Large specs/funds are usually looking at these FUNDAMENTALS and PILING ON in the direction they feel the market will go because of a market with an out of whack/balance in supply vs demand.
Weekly crop conditions. USDA monthly reports. Weather forecasts and other factors matter a great deal.
The energy markets have a different set of fundamentals that contribute to SUPPLY and DEMAND which are very tractable. The weekly petroleum market and natural gas market reports are huge. Weather forecasts are a key that determines much of the demand for residential natural gas use.
Large specs like to follow trends and can sometimes feed the trend to an extreme point of creating a market waaay out of balance, with market prices, distancing themselves from intrinsic value.
This is when astute traders start looking for a top(or bottom) knowing the move is unsustainable because the fundamentals of supply/demand will cause those markets to eventually be reigned in towards what the REAL value is.
++++++++++++++
With the stock market, it's much different and I am NOT not so familiar with reading the COT.
The stock market, clearly is not tethered to the true/intrinsic value based on the same fundamentals that markets reflecting the price of products that are actually used, for instance, food or energy.
The biggest difference between these markets is that when grains or energy prices get too high.......demand for them drops because they become LESS AFFORDABLE and incentive to increase supplies goes up because they are MORE PROFITABLE to produce.
As the saying goes: The cure for high prices is........high prices. The cure for low prices is........low prices.
The stock market, however does not have this market price control mechanism from fundamentals.
If a stock price starts distancing itself from true value, there isn't some entity that starts producing more and more of that stock to sell it so that buyers and sellers are evenly matched at the lower price which reflects the real value.
The price becomes whatever speculators jack it up to with very little upside restraints from fundamentals, like with grains and energies.
If the price of a stock/or the market doubles in 5 years, it doesn't mean the value of the company or the product is actually worth that much more. It only means that speculators, using a different metric have assigned that price to it. Of course the stock price will go higher, when the news is favorable and lower when its bad news but not with the same fundamental correlation which defines true value(other than what people will pay for it in a speculative environment).
THIS IS WHAT CAUSES SPECULATIVE BUBBLES. Irrational exuberance. Parabolic, unsustainable moves higher, like the current stock market has been in.
News, emotions/psychology and other factors play a key role to greatly amplify moves in markets like this.
Using the COT can be a way to measure this. In the stock market, I have 0 experience doing that.
+++++++++++++
Another market, that has its own unique COT dynamic is GOLD. Speculators have an extreme long bias in this market and the current value of gold for its actual uses of the produce is MUCH, MUCH too high. But people that buy and sell gold don't do it like traders that buy/sell corn or soybeans. It's mega speculative and used as a safe haven when there is uncertainty in major global dynamics that are important...........wars, elections, recessions.....etc.
In gold, for instance we expect the market COT to look much different than grains/energies. However, CHANGES from what is normal for that market are most important. Extreme changes, noted by a RECORD position from a key trading group are often the harbinger of an imminent top or bottom. Imminent can mean next week or next year+.
https://www.investopedia.com/terms/c/cot.asp
Sun, Aug 4th, 2024
https://www.barchart.com/futures/commitment-of-traders
The futures market covers a broad range of market instruments, and the Commitment of Traders report can provide an overall view for different markets through comparing position levels on instruments such as FX futures, commodities, financials, interest rate-based futures and equity futures.

metmike: The thing to note on the chart above is the green line, which is the large spec position. When it becomes extreme(low) its often the harbinger of a bottom in the market.
Timing is impossible.
Sometimes the extreme short position peaks BEFORE the market bottom(spec shorts have a selling exhaustion) sometimes it comes AFTER the bottom (spec shorts reacting after the bottom to the actual price signature of the bottom-telling them to get out).
Every time is different.
Added: Just a perspective AFTER the fact. In this COT: asset managers control over 50% of the open LONG interest so it's obvious that their actions matter more than any other group. They have been the MAIN entity driving the speculative bubble higher and higher. They were covering some of their massive longs in this report.
Most interestingly, that same huge group was actually putting on significant new shorts, which is very uncharacteristic of their longer term behavior. This tells us they've turned SIGNIFICANTLY more bearish.
Dealer intermediary's were covering some of their shorts, which makes sense because they have the most short open interest and when the other groups that are long, cover, then dealer intermediary's would BUY BACK what they previously sold to them.
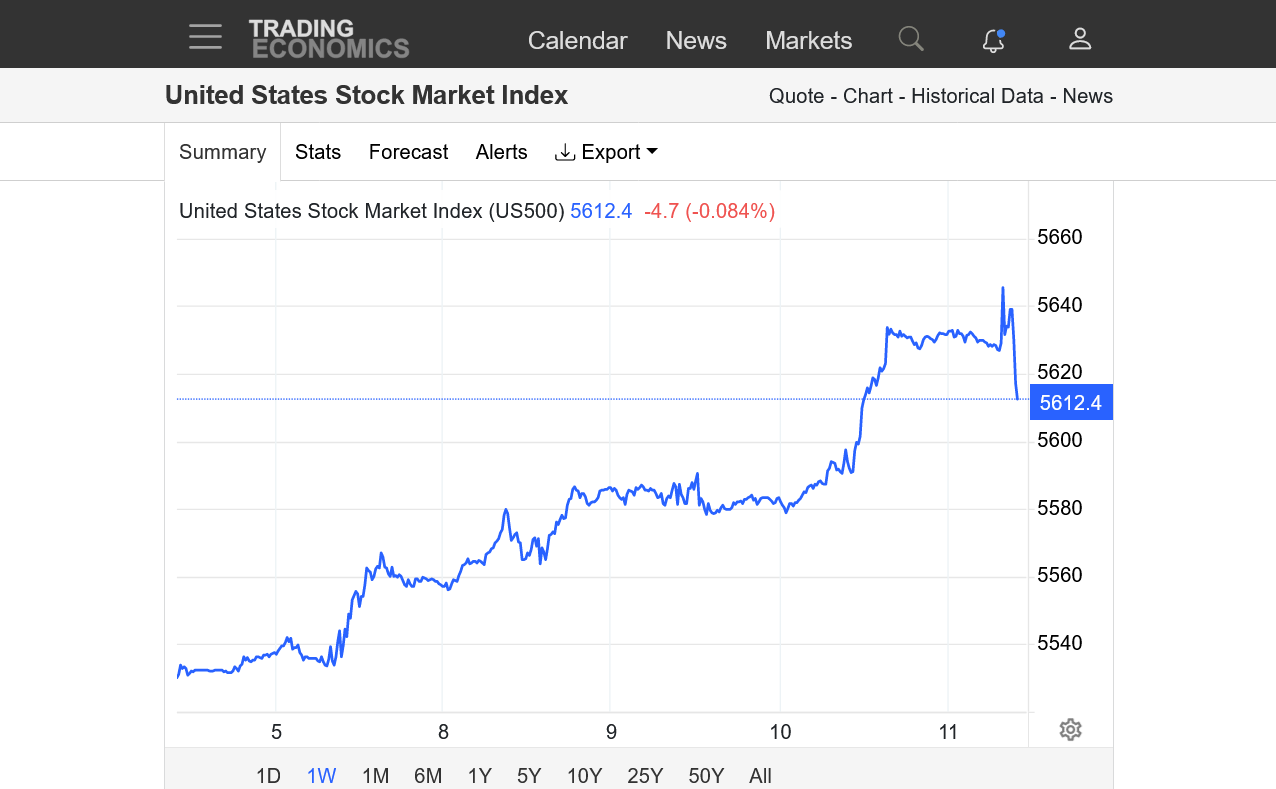
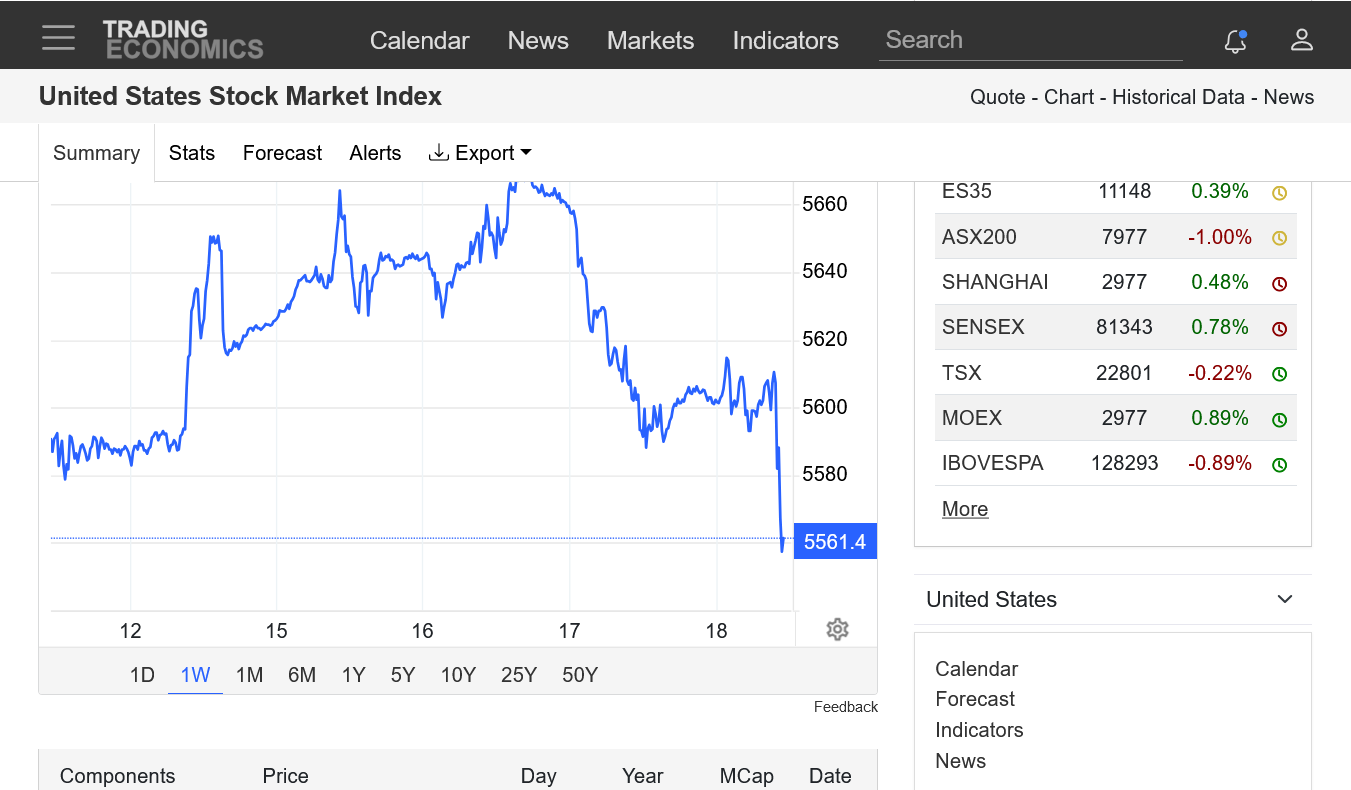
The last few hours have featured the best buying we’ve seen since hitting the highs. We’ve recovered over half of the losses vs the close Friday.
not predicting anything, just having fun following and analyzing it, though I was tempted to sell this index last night with my false sense of knowing something I’ve only just started tracking.
A higher close/reversal up would undo some of the technical damage. However, it could just be the market taking a breather from the selling ahead of a big global recession which has damaged the irrational exuberance frame of mind needed to keep going higher.
See how much fun it is to do this? Almost as much fun as playing chess (-:
2:51 pm CDT: It appears to have been just a brief breather as the market is back down closer to the lows late in the day. No predictions on what that means for the rest of the week.
Adam=1414== and 2 square root gives you ---!!! 1440== number of minutes 4 minutes at a degree--!!
Hebrew meaning of each of the names from Adam to Noah it forms a prophetic statement that summarizes all of scripture!
| # | Name | Hebrew Meaning |
|---|---|---|
| 1 | Adam | Man |
| 2 | Seth | Appointed |
| 3. | Enosh | Mortal |
| 4. | Kenan | Sorrow |
| 5. | Mahahlalel | The blessed God |
| 6. | Jared | Shall come down |
| 7. | Enoch | Teaching |
| 8. | Methuselah | His death shall bring |
| 9. | Lamech | The despairing |
| 10. | Noah | Rest, comfort |
If we stitch the word meanings together, it forms the following sentences:
Thanks, fays,
The mythological version of history that you copied from elsewhere is very creative science fiction for people that want to believe in things that have been completely debunked by science and archeology(and common sense/critical thinking).
Here's more from a source with the same belief system where you copied this:
https://www.generationword.com/notes_for_notesbooks_pg/genesis/5_28.htm
5:30
After Noah was born, Lamech lived 595 years and had other sons and daughters. 31 Altogether, Lamech lived 777 years, and then he died.
5:32
After Noah was 500 years old, he became the father of Shem, Ham and Japheth.
6:1
When men began to increase in number on the earth and daughters were born to them,
This age of man is described as a time of increase in population.
Estimates of the population at this time are huge.
Estimates range from 5 to 17 billion people
++++++++++++++++
You're welcome to believe whatever you want about religion or astrology but I'm telling you with absolute certainty, that it does not predict markets. You are very welcome to keep posting the nonsense part in these trading forum posts if you like but I will chime in with reality checks for readers that want useful, authentic trading principles, similar to this one from time to time.
Is this a dead cat bounce?? Considering the big picture and impending recession, it seems very unlikely that this market will resume its irrational exuberance move to new highs for quite some time.
1. 1 month
2. 10 years
https://tradingeconomics.com/united-states/stock-market

Looks like is MIGHT have been a dead cat bounce.........but it just depends on market psychology here. The government could cook up some bullish economic news ahead of the election and trigger a wave of aggressive buying.
https://tradingeconomics.com/united-states/stock-market
5377 break and moi wait for 16/19 Aug 2024 for some clearer Direction -- 2 ride wave surfer --- nt turn da board !!
Looking like the chart formation is just another bull flag!
We need to take out the July 16, 2024 highs.
When will it end? Maybe in x years? Maybe next month? I don't trade the stock markets or give advice......but enjoy the fun of technical/chart analysis.
1. 1 month
2. 2 months
3. 100 years
https://tradingeconomics.com/united-states/stock-market


5671 Make or break --sometimes --something ----happens --!!
Agree, fays! We need to get above the July highs!
New highs soon? The chart suggests. probably but we are losing some momentum with the slope of the unsustainable uptrend, flattening out. That's just 1 element.
August/September are seasonally the weakest months of the year for the stock market.
https://tradingeconomics.com/united-states/stock-market
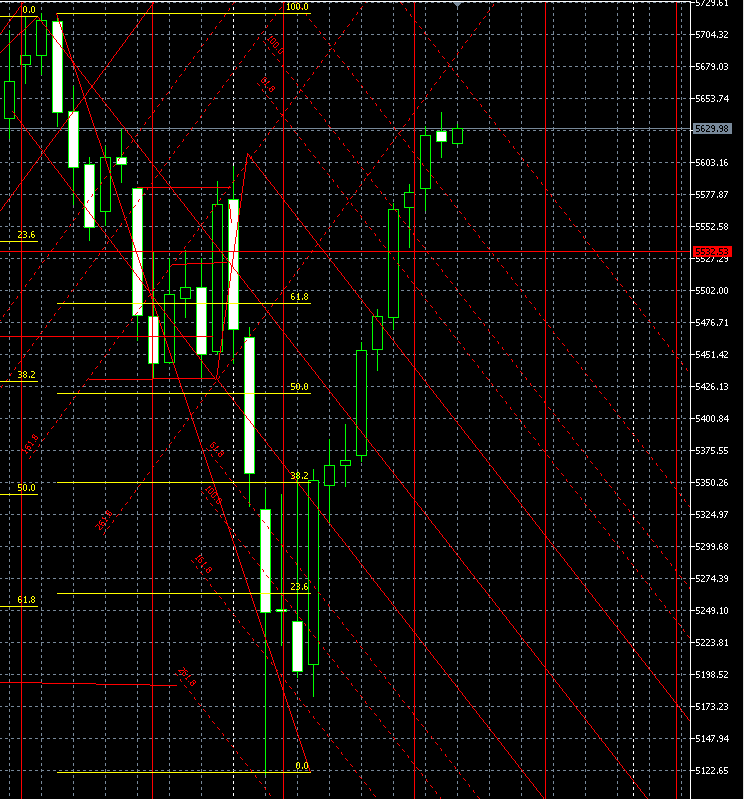
5391hold --->>--higher again5841-- 5858--!! 5912 should terminate !COt confused and basis is 60 points !!