This is just a 1 year change which can be the result of any number of random variation reasons.
Map Shows US Prison Population Is Growing in These States
https://www.newsweek.com/prisoner-numbers-us-biggest-rise-prison-inmates-population-1911130
When looking at the BIG picture, comparing incarceration rates of every state with each other, we get a completely different view.
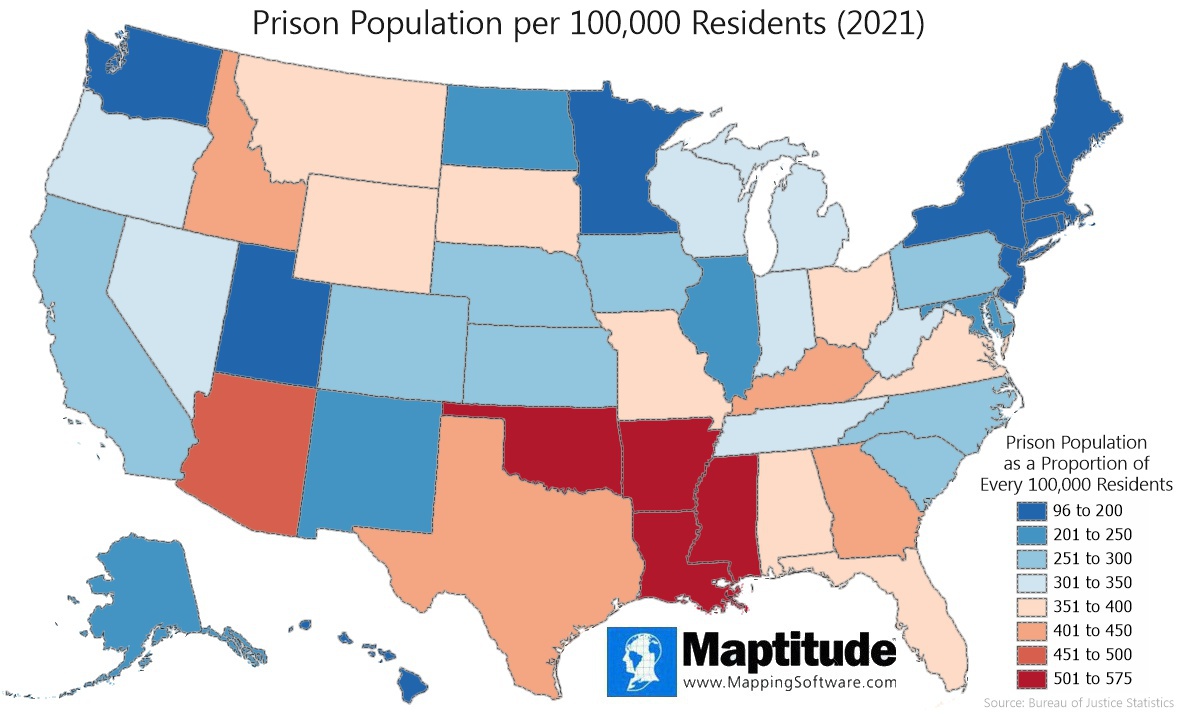
https://www.caliper.com/featured-maps/maptitude-prison-population-map.html
Maptitude is the best mapping software for business intelligence! Maptitude mapping software allows you toincorporate data from numerous sources into your maps.
The proportion of the population in prison varies quite a bit by state. In 2021 the nationwide incarceration rate was 350 per 100,000 (0.35%). Seventeen states exceeded the national average with Mississippi (575), Louisiana (564), Arkansas (559), and Oklahoma (555) having the highest rates of incarceration. The lowest rates were in Massachusetts (96), Maine (107), and Rhode Island (118).
https://en.wikipedia.org/wiki/List_of_U.S._states_and_territories_by_violent_crime_rate
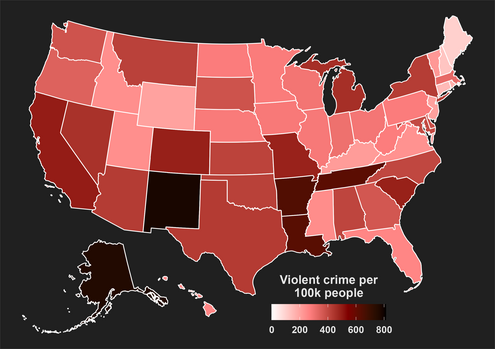
Data in this table are from the FBI and for the year 2022.[1]
| Location | Violent crime | Homicide | Rape | Robbery | Aggravated assault |
|---|---|---|---|---|---|
| United States | 380.7 | 6.3 | 40.0 | 66.1 | 268.2 |
| 812.3 | 29.3 | 41.5 | 357.5 | 383.9 | |
| 780.5 | 12.0 | 54.6 | 110.6 | 603.3 | |
| 758.9 | 9.5 | 134.0 | 75.1 | 540.2 | |
| 645.3 | 10.2 | 76.0 | 39.7 | 519.4 | |
| 628.6 | 16.1 | 43.0 | 67.3 | 502.1 | |
| 621.6 | 8.6 | 38.2 | 67.1 | 507.6 | |
| 499.5 | 5.7 | 37.4 | 123.5 | 332.8 | |
| 492.5 | 6.4 | 63.4 | 72.6 | 350.1 | |
| 491.3 | 11.2 | 38.2 | 40.6 | 401.3 | |
| 488.0 | 10.1 | 48.9 | 54.8 | 374.2 | |
| 461.0 | 6.9 | 64.8 | 36.6 | 352.7 | |
| 454.0 | 6.8 | 58.9 | 86.1 | 302.3 | |
| 431.9 | 6.7 | 50.0 | 70.5 | 304.7 | |
| 431.5 | 6.8 | 44.1 | 70.1 | 310.5 | |
| 429.3 | 4.0 | 29.5 | 112.0 | 283.8 | |
| 419.7 | 6.7 | 57.5 | 40.6 | 314.8 | |
| 417.9 | 4.5 | 54.4 | 23.3 | 335.7 | |
| 414.6 | 4.6 | 45.5 | 29.2 | 335.4 | |
| 409.1 | 10.9 | 29.6 | 34.5 | 334.1 | |
| 405.1 | 8.1 | 30.5 | 54.9 | 311.6 | |
| 398.5 | 8.5 | 30.6 | 114.2 | 245.2 | |
| 383.5 | 4.8 | 22.0 | 57.0 | 299.8 | |
| 377.4 | 4.3 | 55.8 | 25.3 | 292.0 | |
| 375.6 | 5.0 | 39.2 | 86.8 | 244.7 | |
| 367.0 | 8.2 | 36.4 | 43.6 | 278.8 | |
| 342.4 | 4.5 | 40.6 | 68.6 | 228.7 | |
| 322.0 | 2.1 | 29.1 | 37.7 | 253.1 | |
| 306.2 | 6.2 | 32.8 | 43.0 | 224.2 | |
| 297.0 | 5.3 | 38.6 | 39.4 | 213.7 | |
| 293.6 | 6.1 | 48.4 | 53.1 | 185.9 | |
| 287.3 | 7.8 | 48.1 | 84.7 | 146.7 | |
| 286.5 | 1.7 | 42.5 | 21.6 | 220.7 | |
| 282.8 | 3.2 | 55.3 | 29.1 | 195.2 | |
| 280.6 | 3.2 | 40.7 | 57.0 | 179.7 | |
| 279.9 | 7.9 | 29.5 | 68.1 | 174.5 | |
| 279.6 | 3.5 | 56.7 | 27.6 | 191.8 | |
| 277.9 | 4.6 | 44.4 | 10.0 | 218.9 | |
| 259.6 | 2.1 | 37.9 | 66.1 | 153.5 | |
| 258.9 | 5.0 | 30.2 | 33.6 | 190.1 | |
| 245.0 | 7.8 | 33.7 | 25.6 | 178.0 | |
| 241.8 | 2.0 | 59.5 | 29.6 | 150.7 | |
| 241.4 | 2.7 | 48.7 | 8.2 | 181.7 | |
| 234.0 | 7.3 | 30.2 | 38.4 | 158.1 | |
| 221.9 | 3.4 | 36.8 | 13.3 | 168.5 | |
| 214.1 | 6.8 | 33.8 | 38.1 | 135.4 | |
| 202.9 | 3.1 | 16.8 | 47.6 | 135.4 | |
| 201.9 | 2.6 | 62.8 | 7.9 | 128.7 | |
| 172.3 | 1.5 | 38.0 | 24.6 | 108.3 | |
| 150.0 | 3.8 | 18.1 | 44.9 | 83.3 | |
| 125.6 | 1.8 | 39.6 | 16.1 | 68.1 | |
| 103.3 | 2.2 | 32.0 | 10.0 | 59.0 |
You can go to 10 different studies and get 10 different ranking for most dangerous cities! Here's 1 of them.
It's much different than what most people think.
https://www.security.org/resources/most-dangerous-cities/
