Lots of people follow oil! Thanks, fays!
More charts shortly
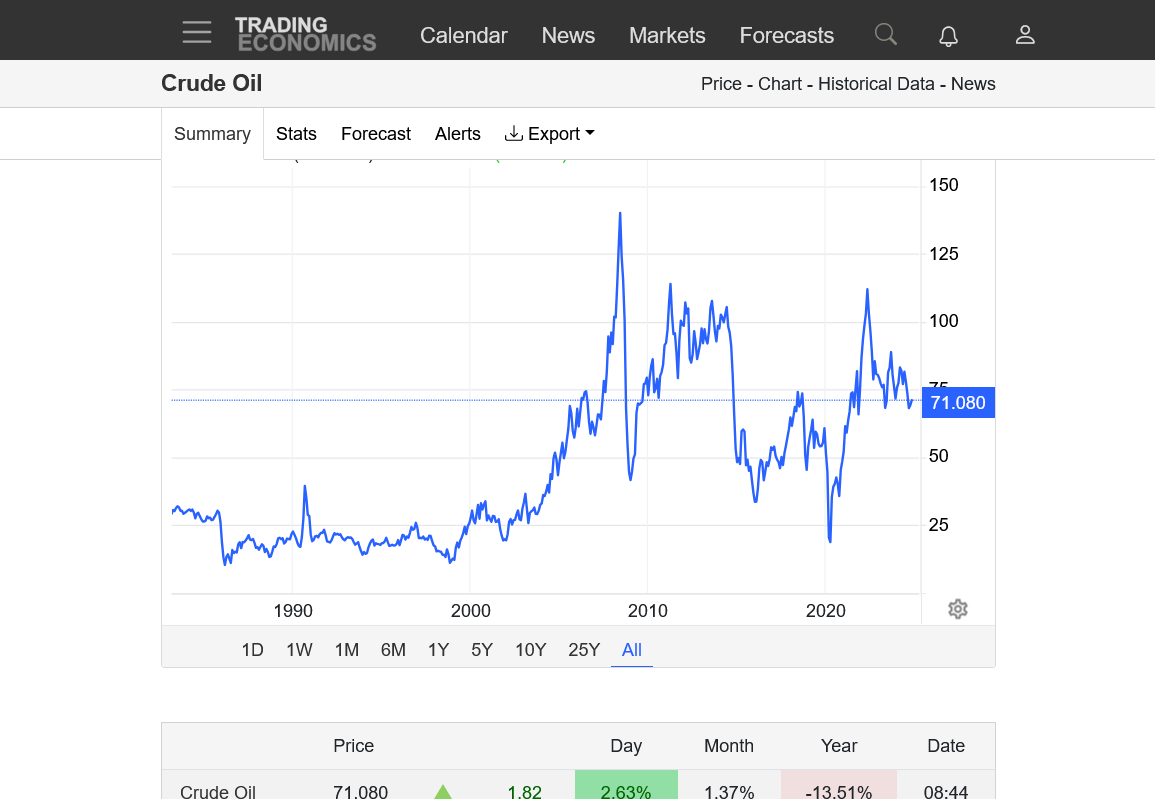
Crude charts:
https://tradingeconomics.com/commodity/crude-oil
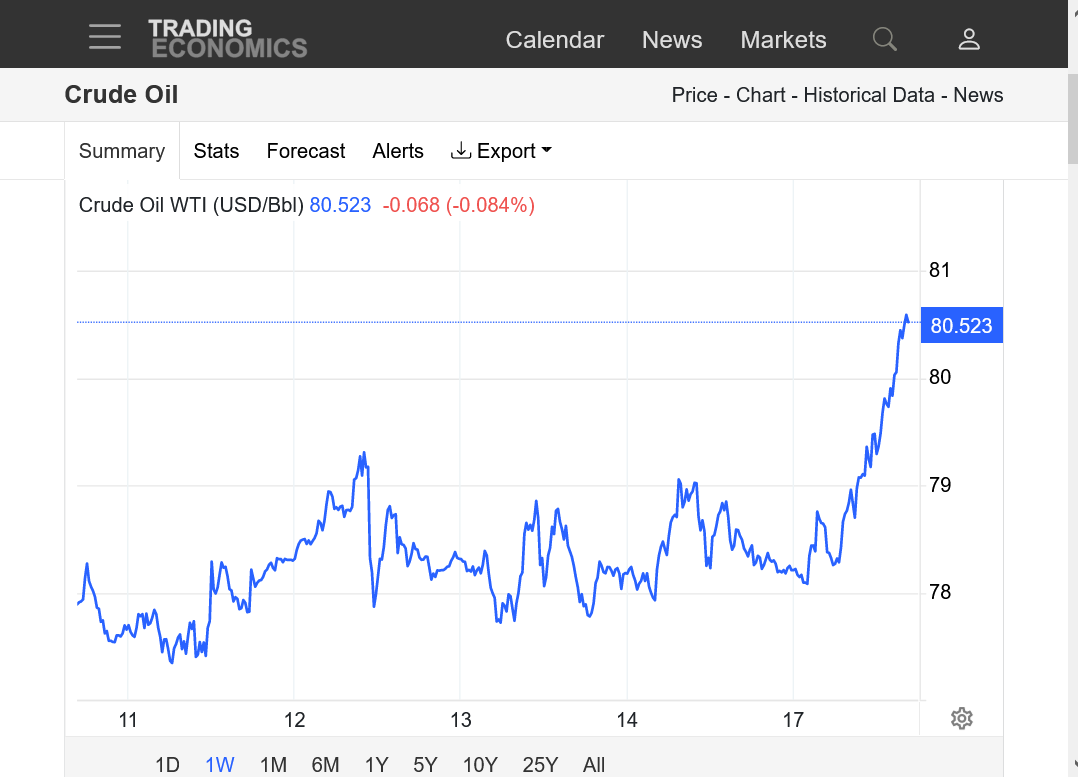
1. 1 week
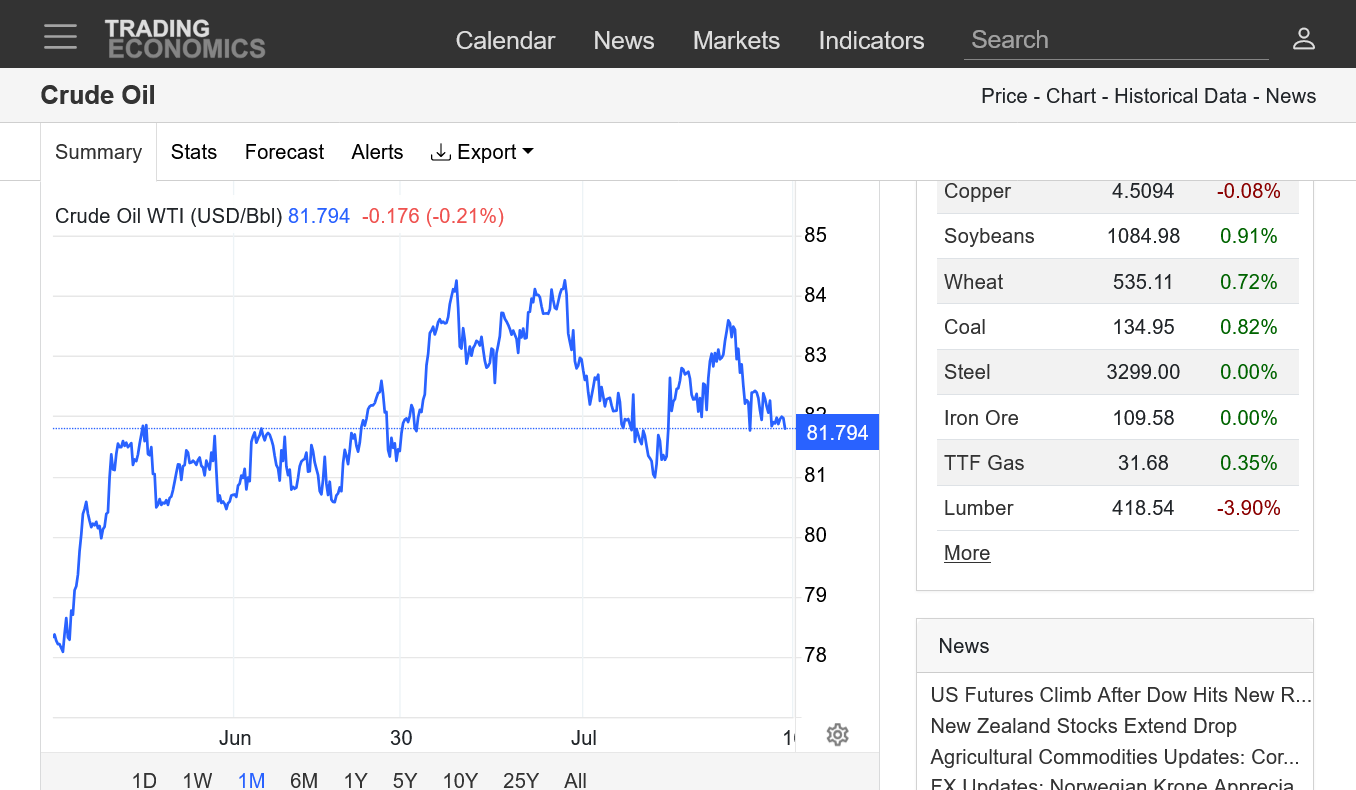
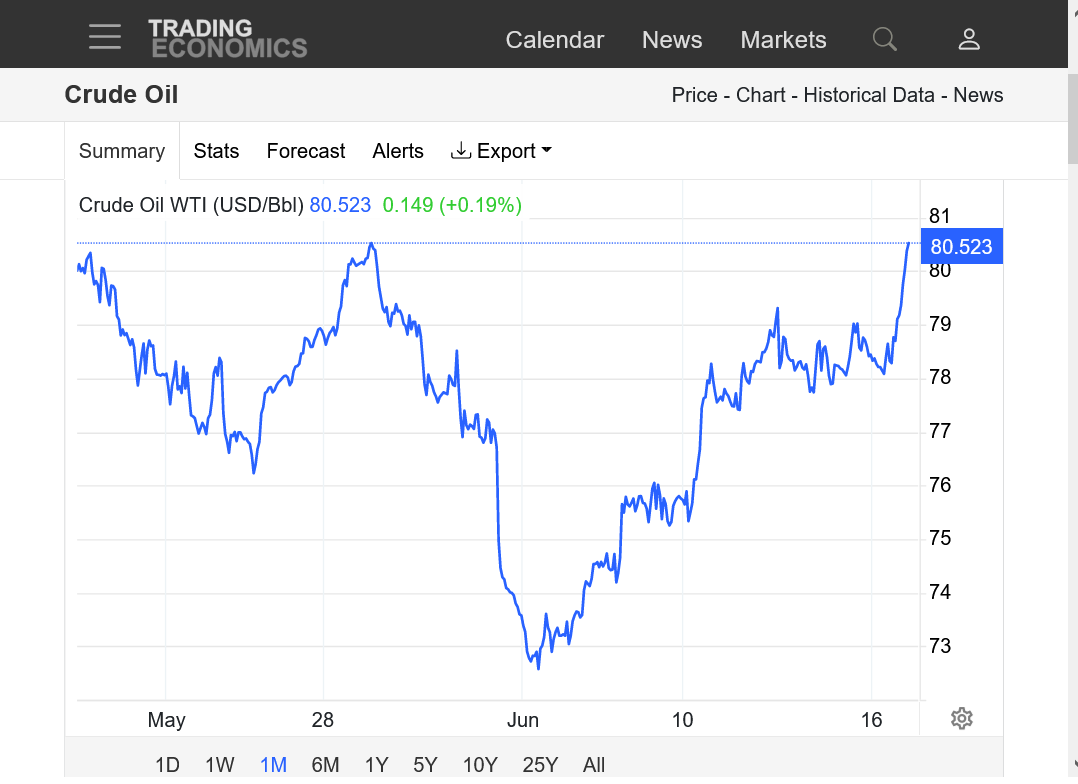
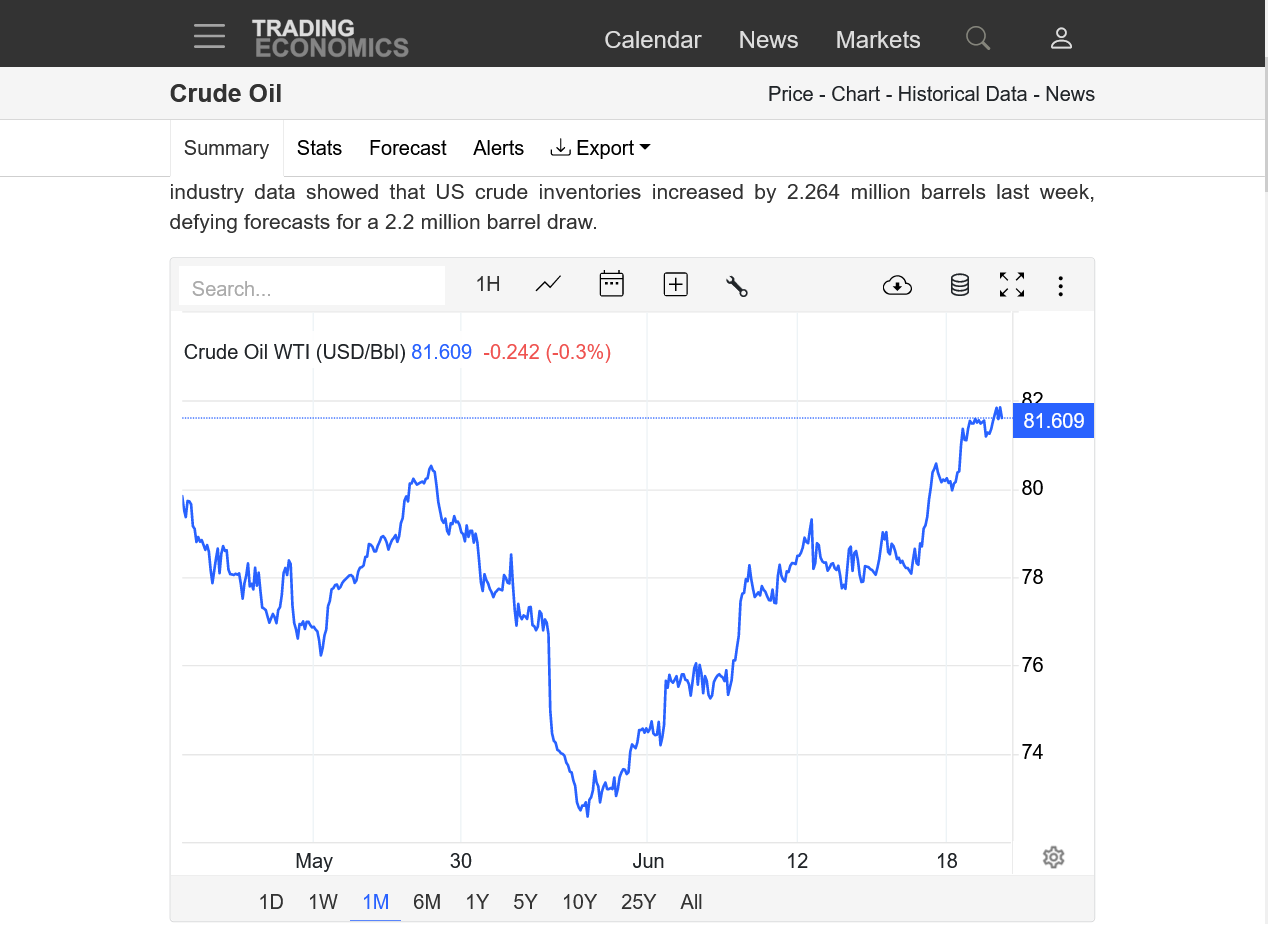
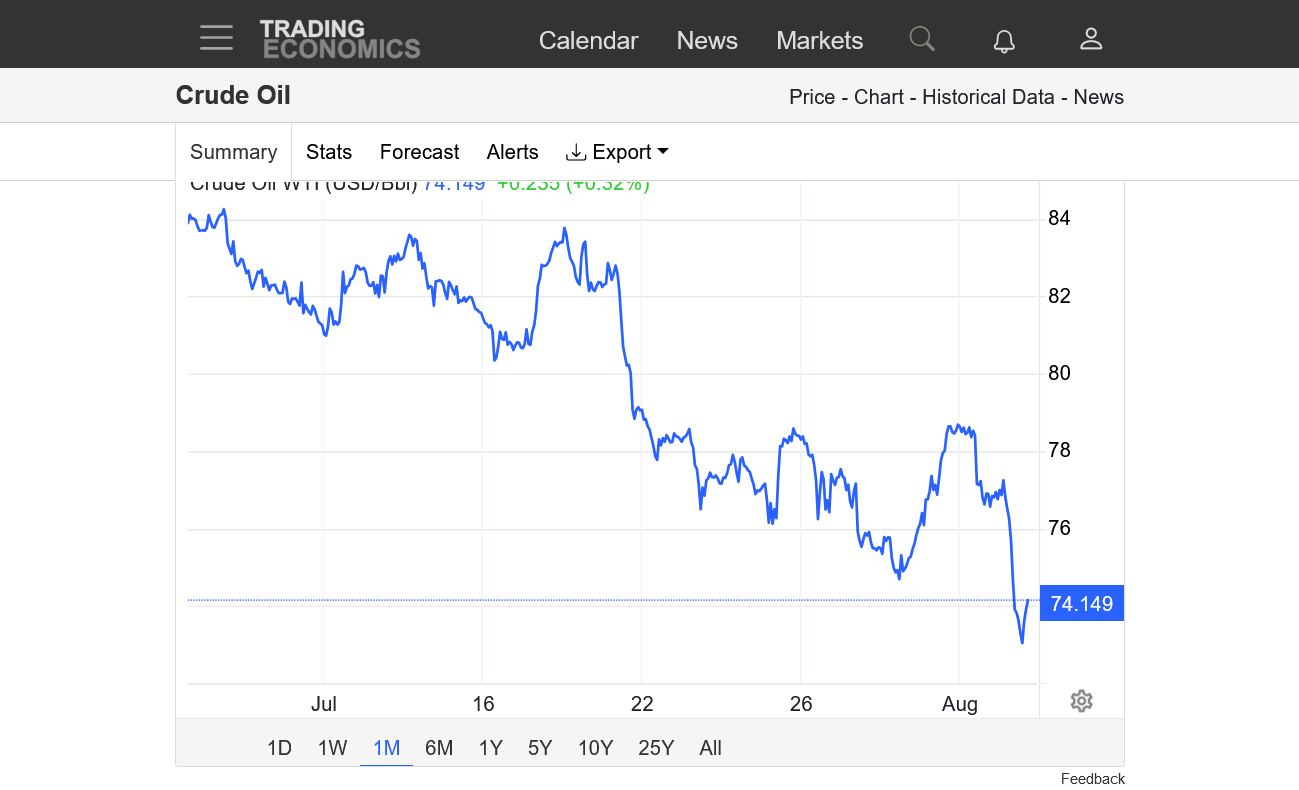
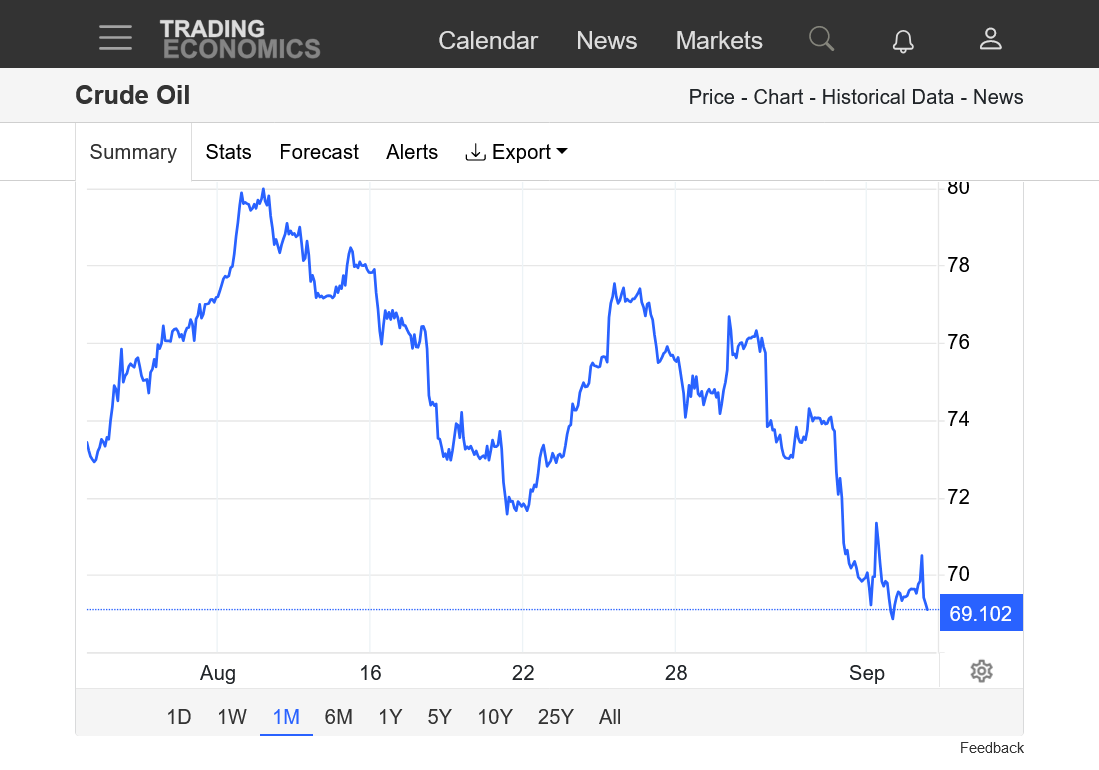
2. 1 month
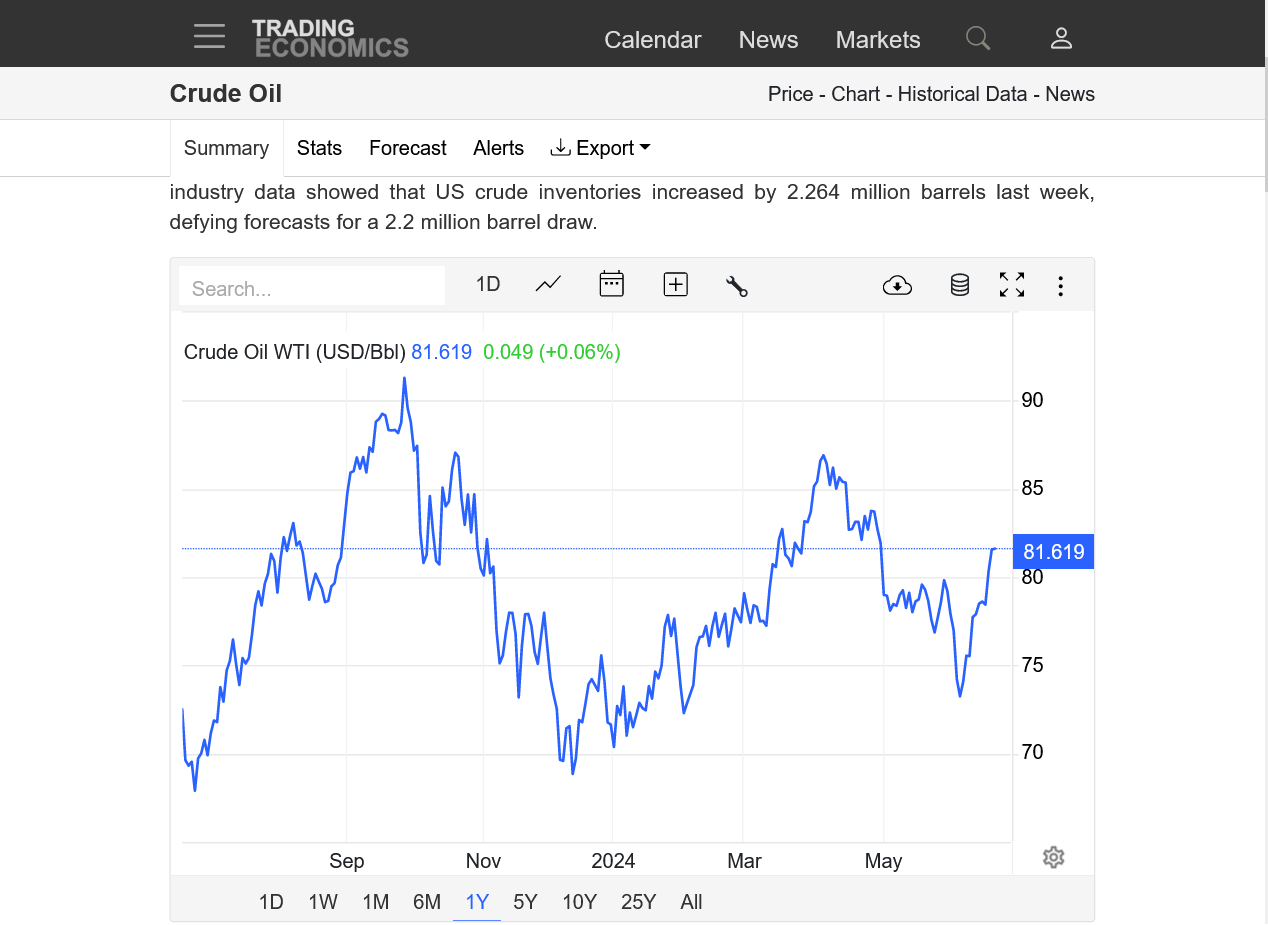
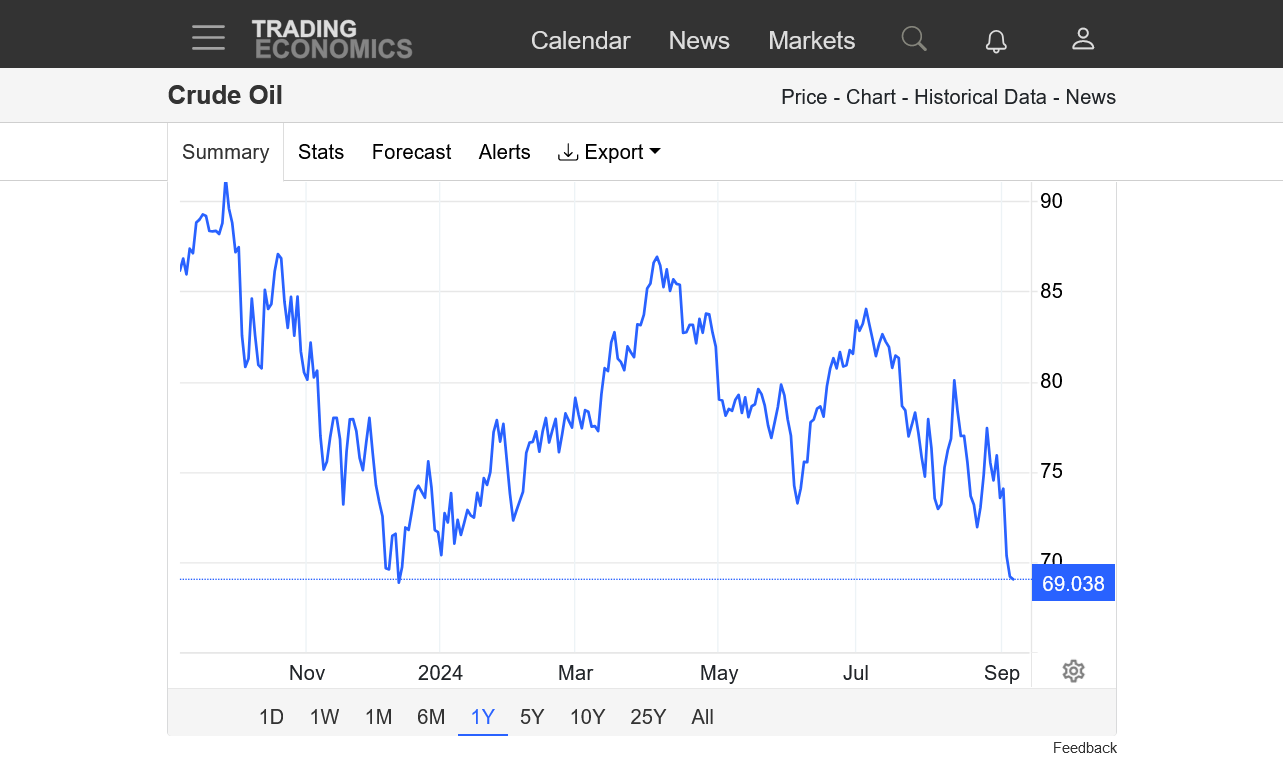
3. 1 year
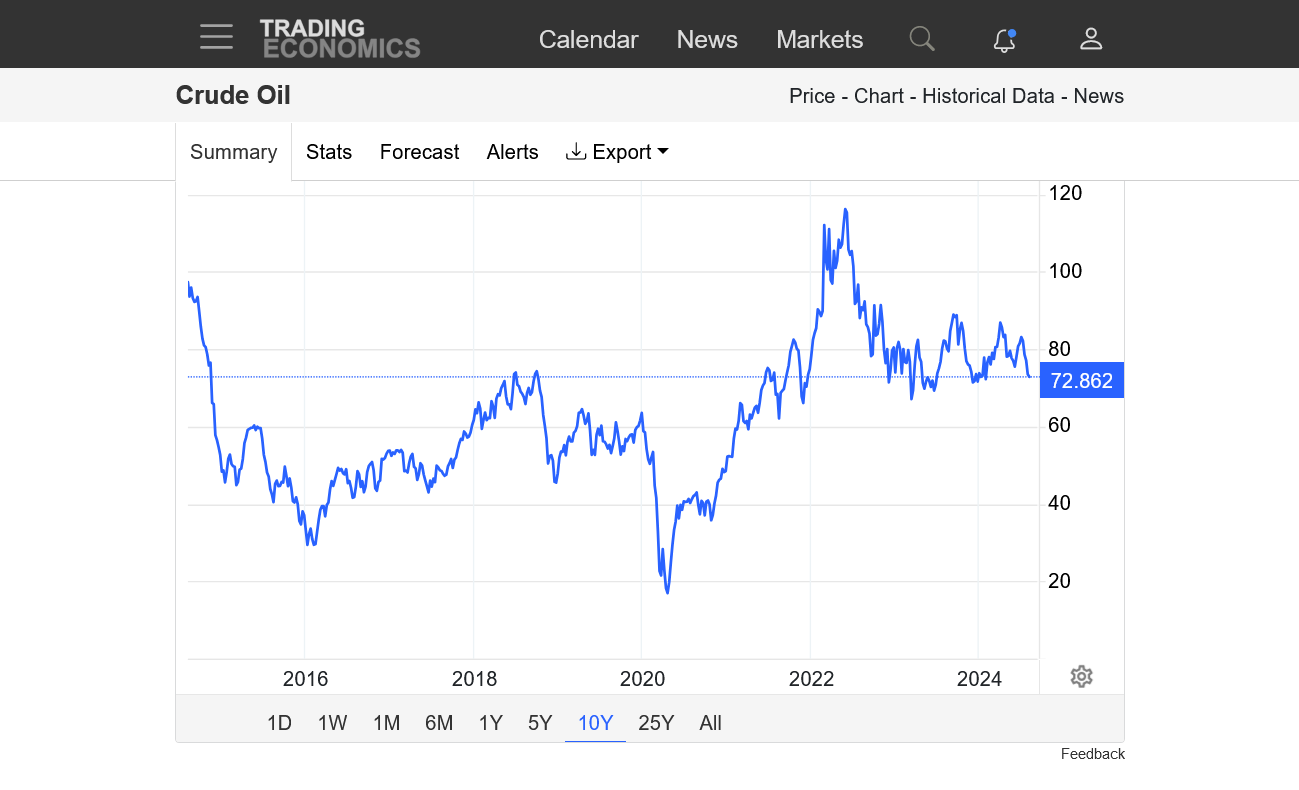
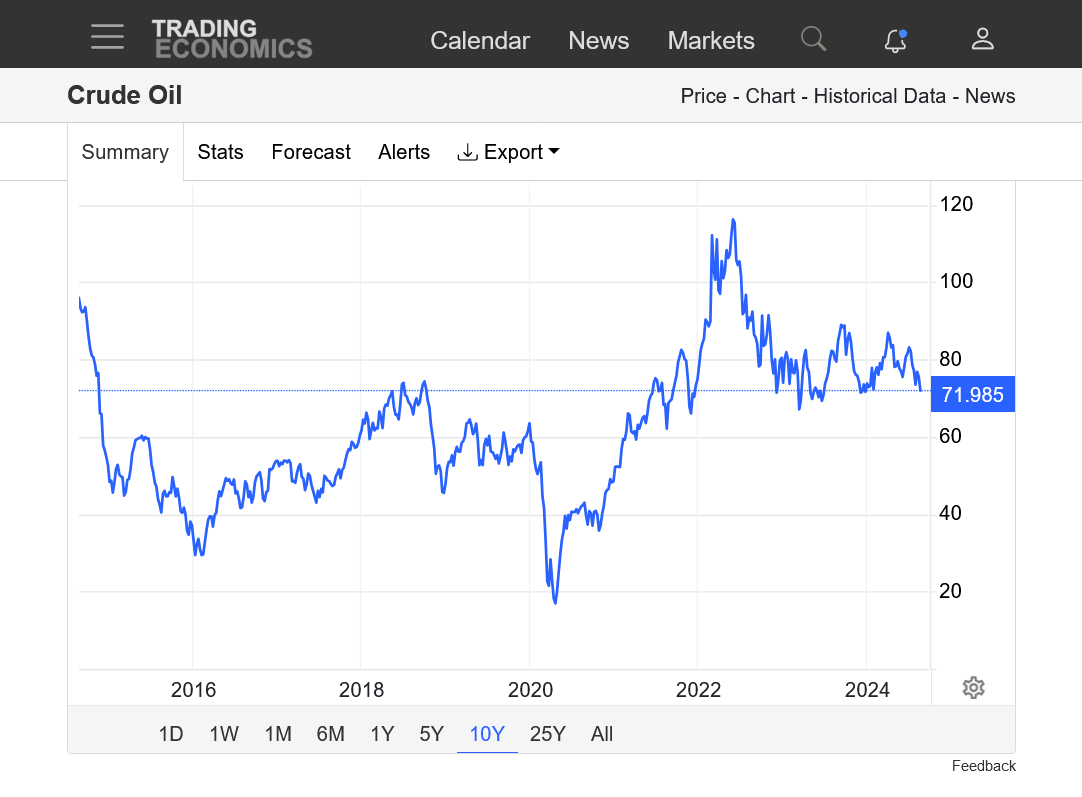
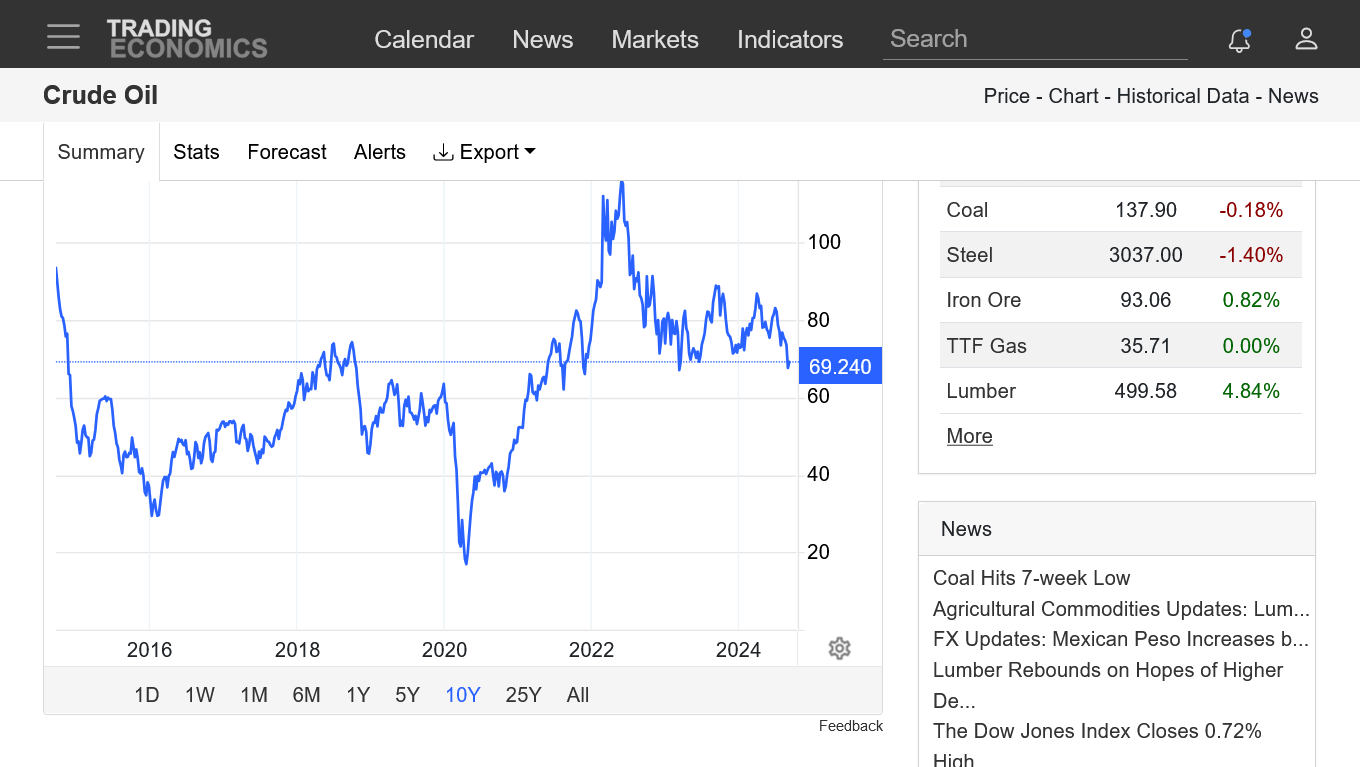
4. 10 years
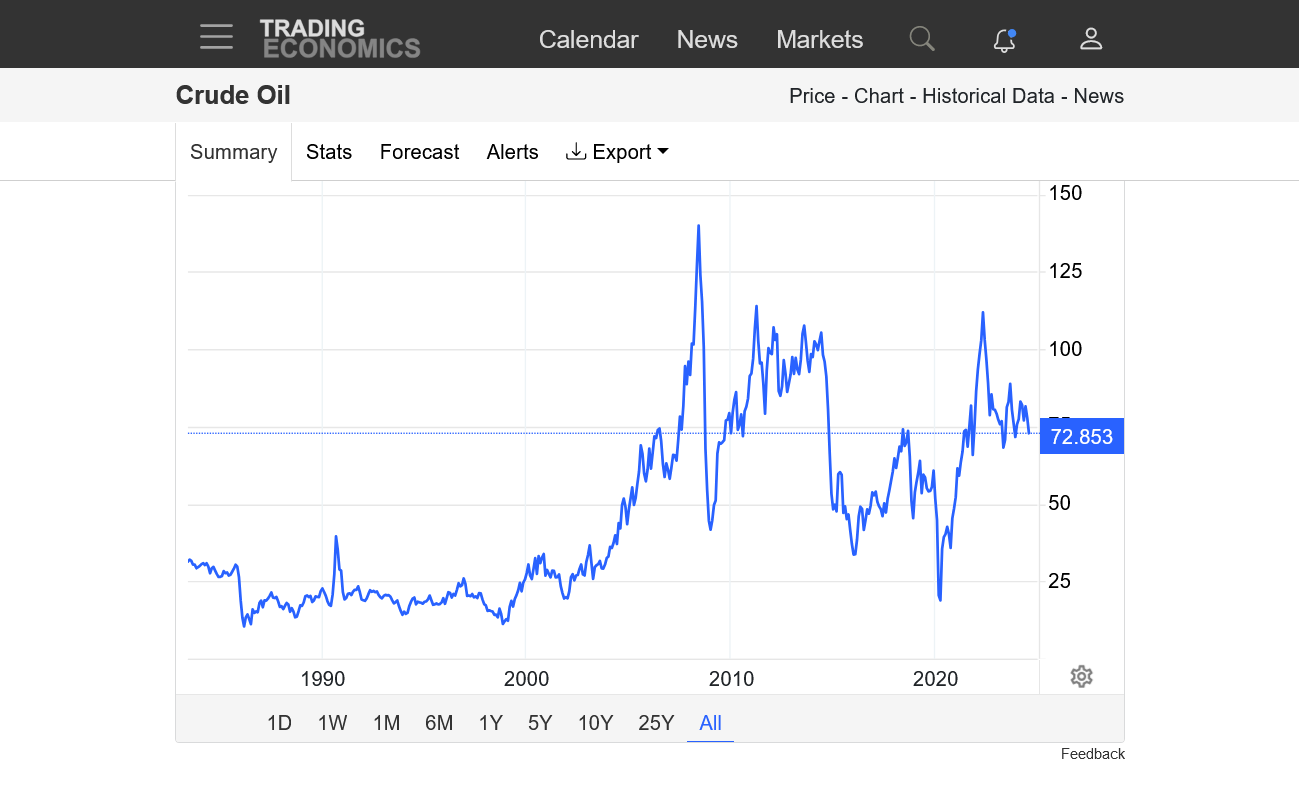
5. 40 years

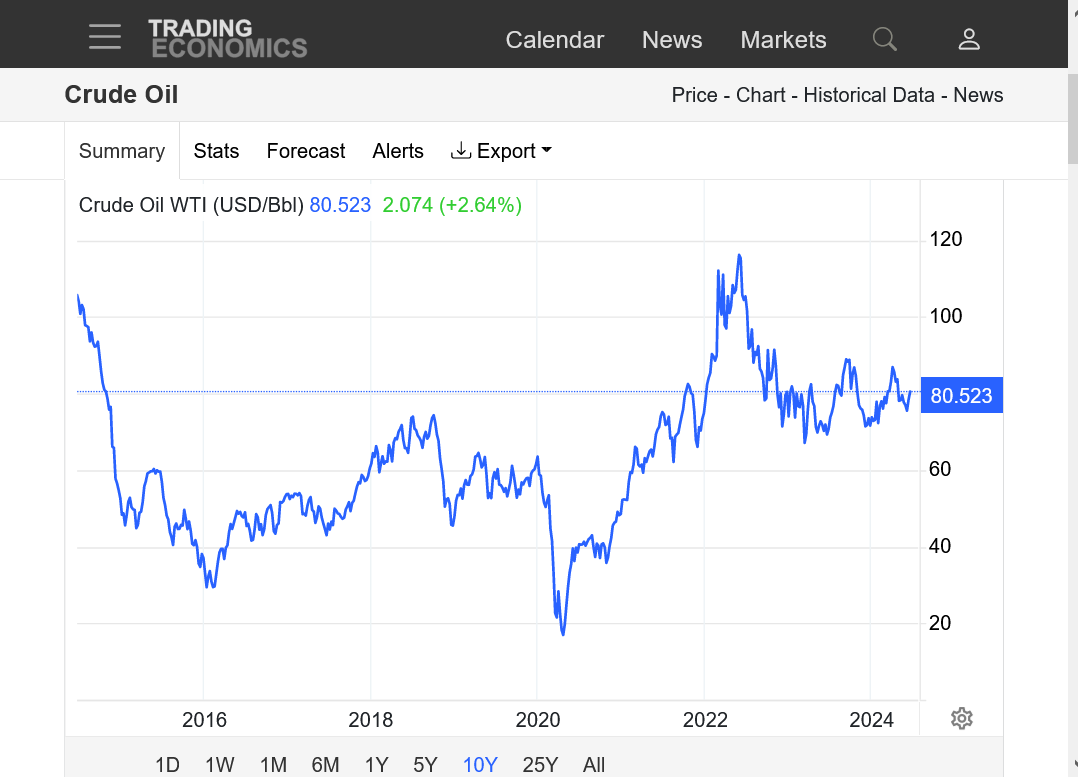
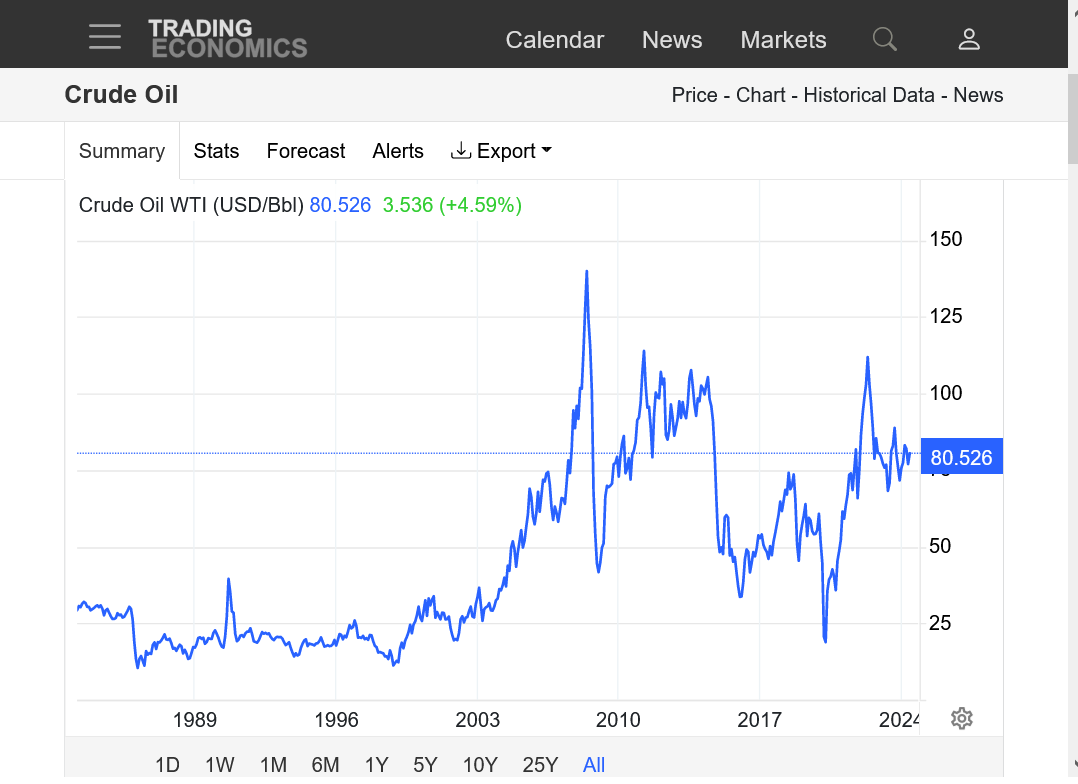
All the charts, 1 year+ are wedges/triangles with lower highs and higher lows. Converging towards an apex.

Thanks, fays!
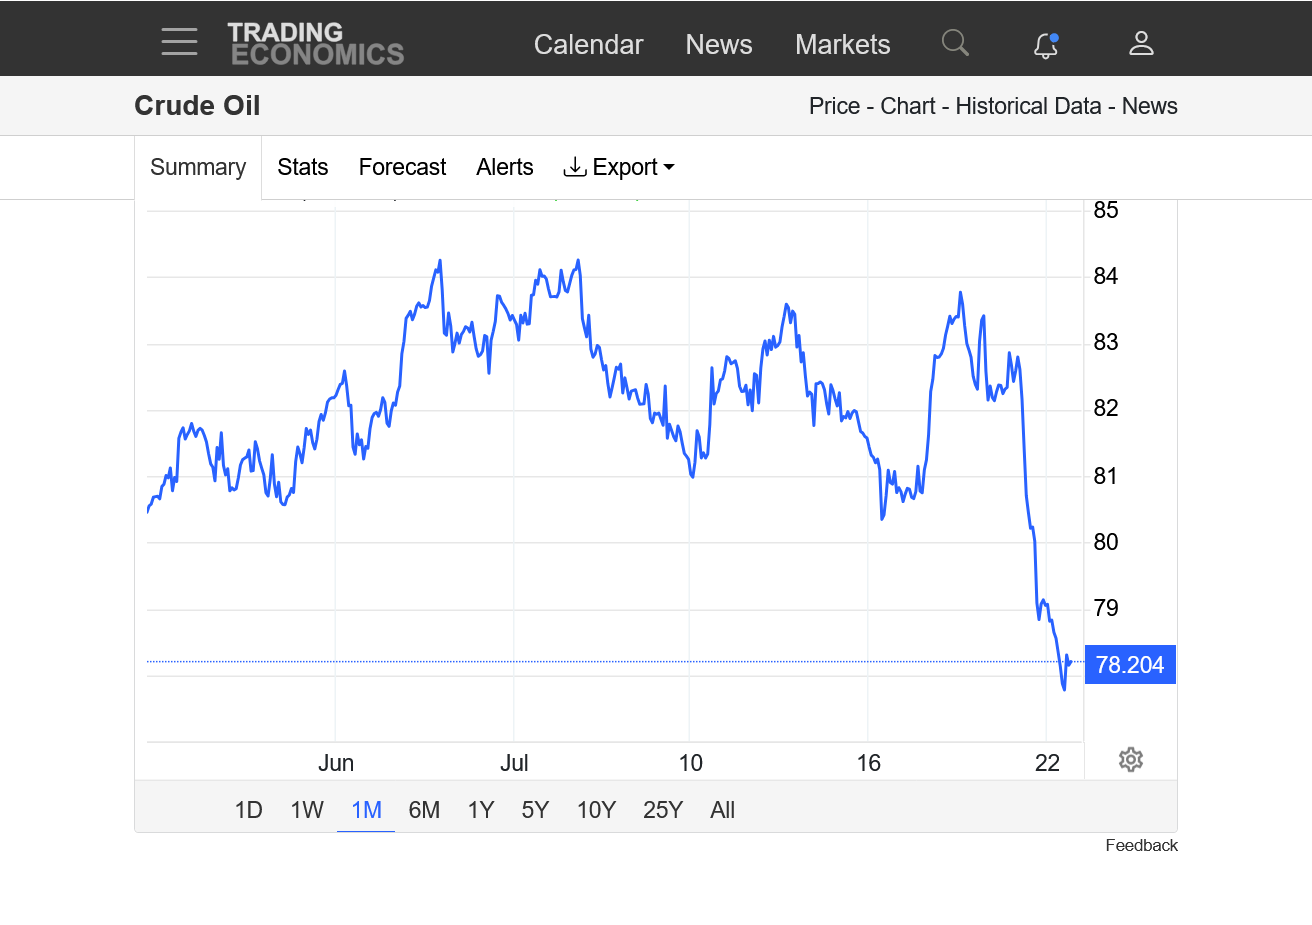
1. 1 month. Breaking out above short term resistance from late May
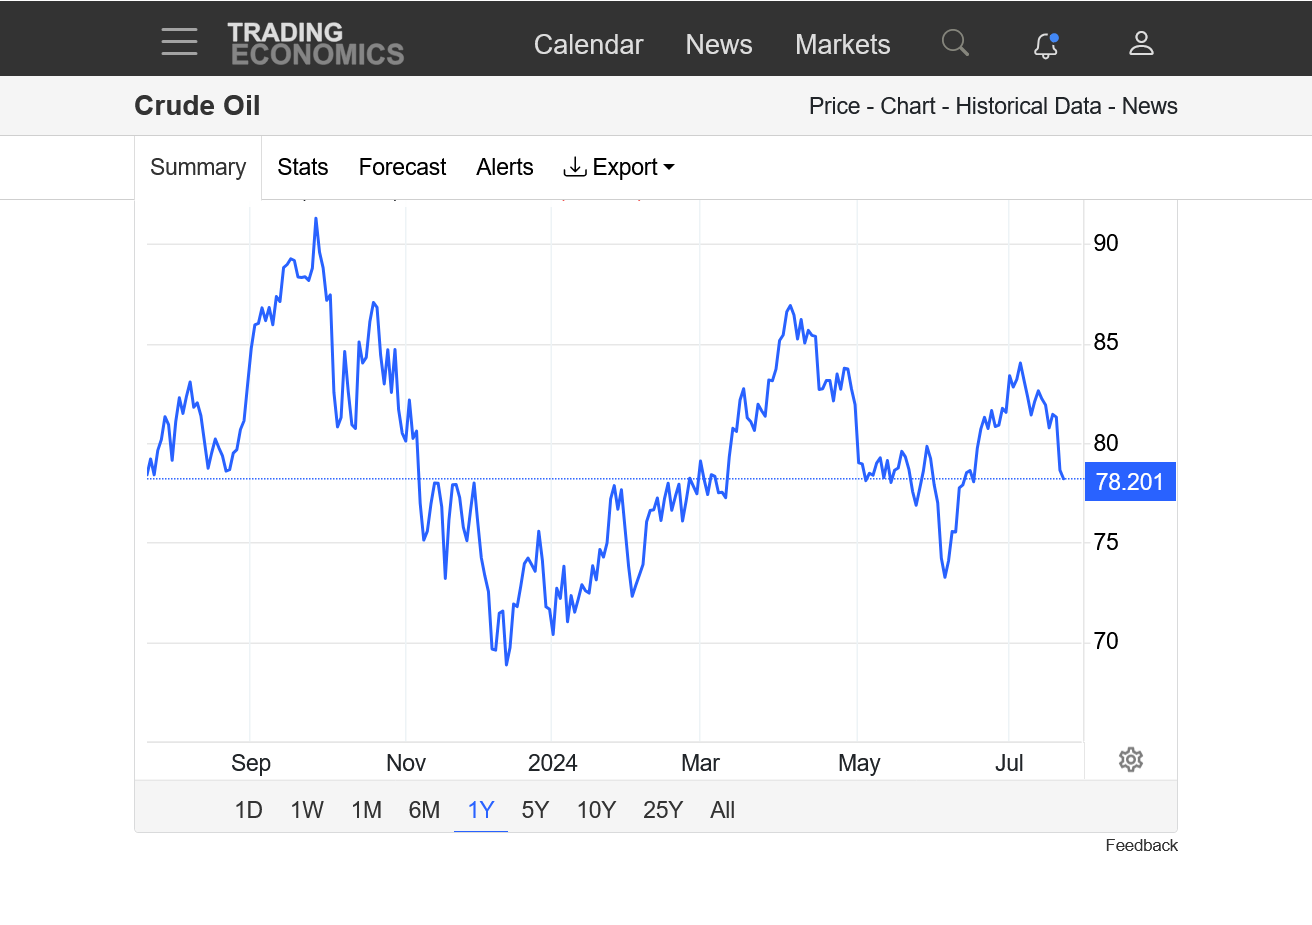
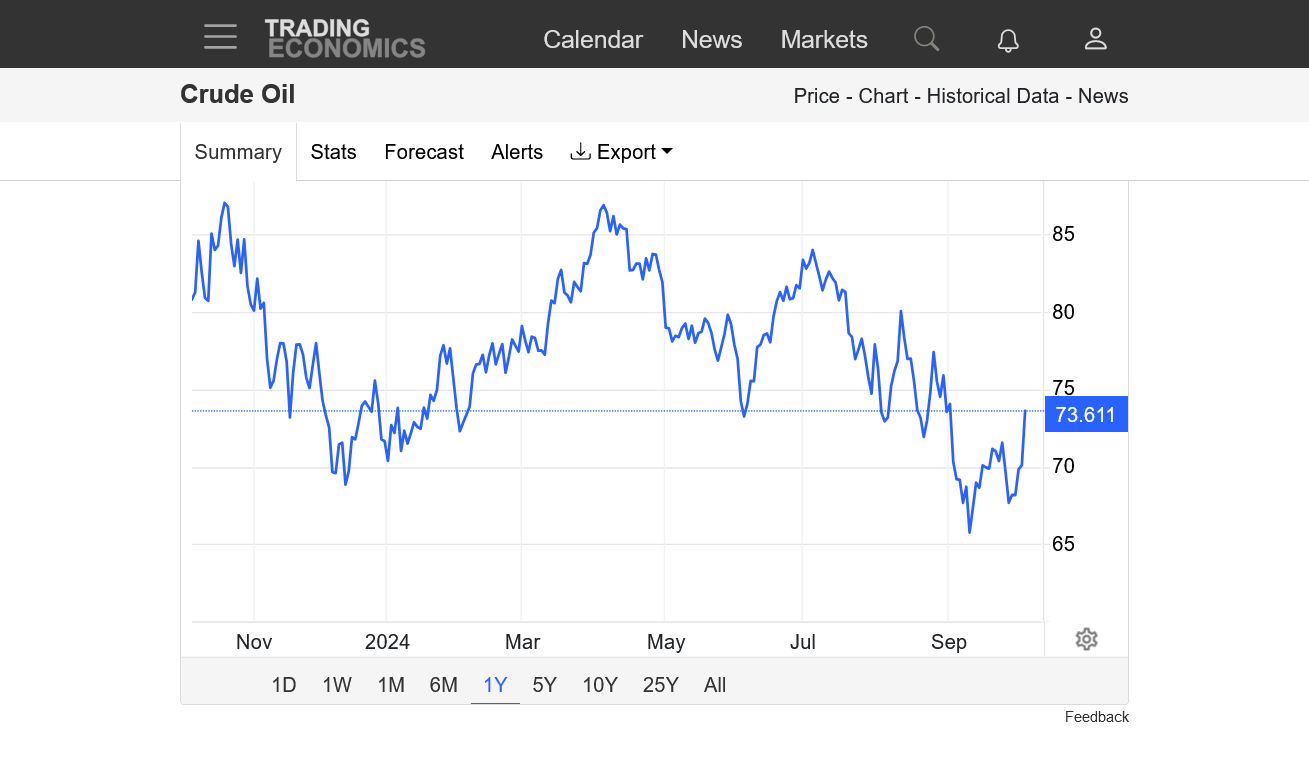
2. 1 year. Still longer term, converging wedge with higher lows and lower highs.
https://tradingeconomics.com/commodity/crude-oil
21 june topping out---?? wait and watcH
price reached mkt adhere its levels 8385/8455
Ashadha, Krishna Amavasya Begins - 07:27 PM, Jul 04 Ends - 06:56 PM, Jul 05 so if it close is not below open then Another high coming --Amavdya -- oil dance ----!! next high2X july and low should be 9/13 july 2024
mars /Uranus Conjunction with each other next week and impact --is there any event which trigger massive move -- Assination attempt--!!
Thanks much, fays!
A more in depth discussion here:
GOLD dance!!! ---2372 -2332=2311 P&F charts along dates on it
By metmike - July 14, 2024, 10:07 a.m.
++++++++++++++++++
With regards to the assassination attempts impact on the price of oil. It could be the same or the opposite of gold. Probably just the market assuming much greater odds of a Trump presidency.
Oil has its own strong fundamentals that determine the price of oil. Supplies are a key. More production = lower prices. Less production = higher prices.
I'm not making a prediction but just providing one way to interpret this latest, historic event. Assassination attempt = Trump presidency = massive increase in oil supplies = lower prices. Since this speculated increase in oil supplies/lower prices would take many months AFTER Trump was in office, the impact on the markets actual fundamentals are so far in the future, that it could have minimal impact on the speculated price here in July 2024...........or, it could be a key price driver thats superimposed on the market going forward and sort of dialed into the future price. For instance -$10/barrel for deferred, 2025 contracts with Trump and +$10/barrel for Biden with his attempts to destroy fossil fuels with fake green energy schemes. Higher fossil fuel prices make wind/solar more competitive too.
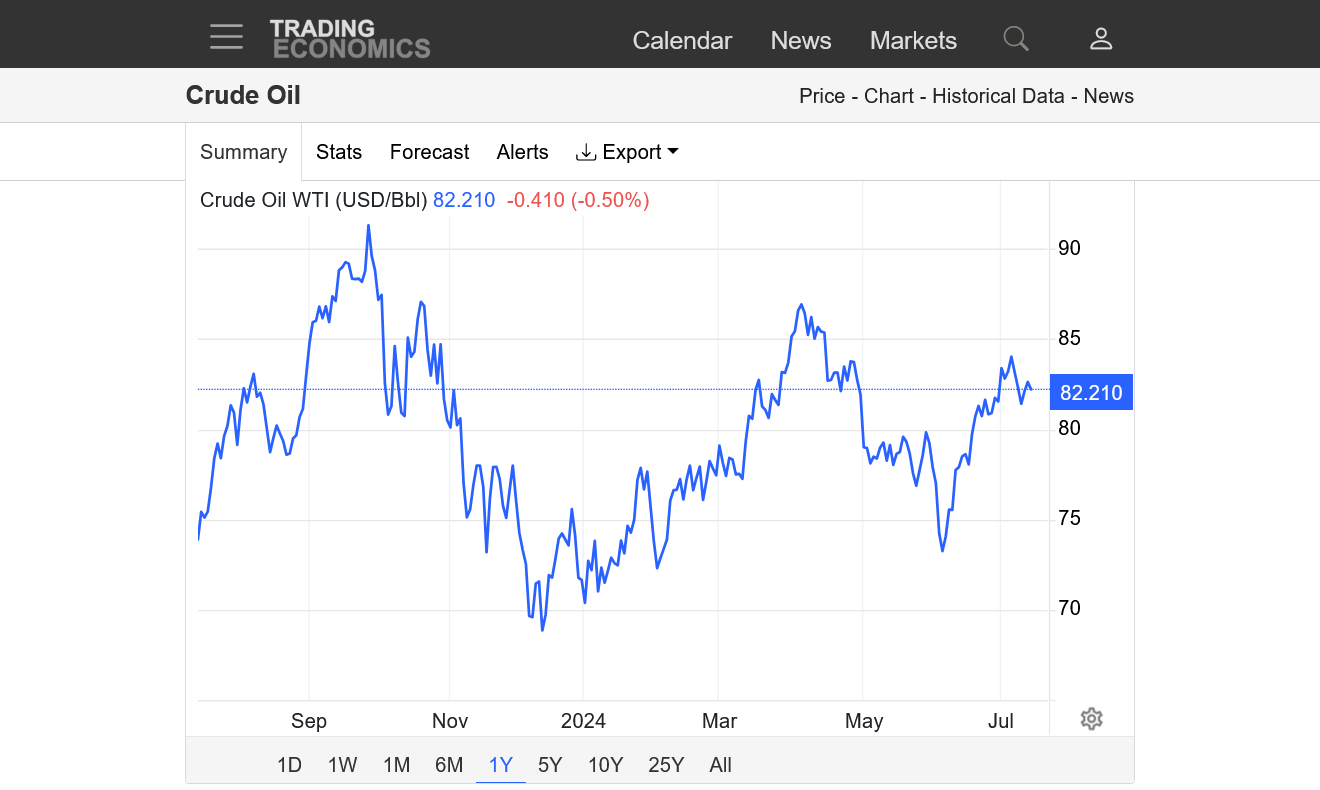
1. 1 year. Symmetrical wedge/triangle pattern! Higher lows/Lower highs! Which way will the price break??
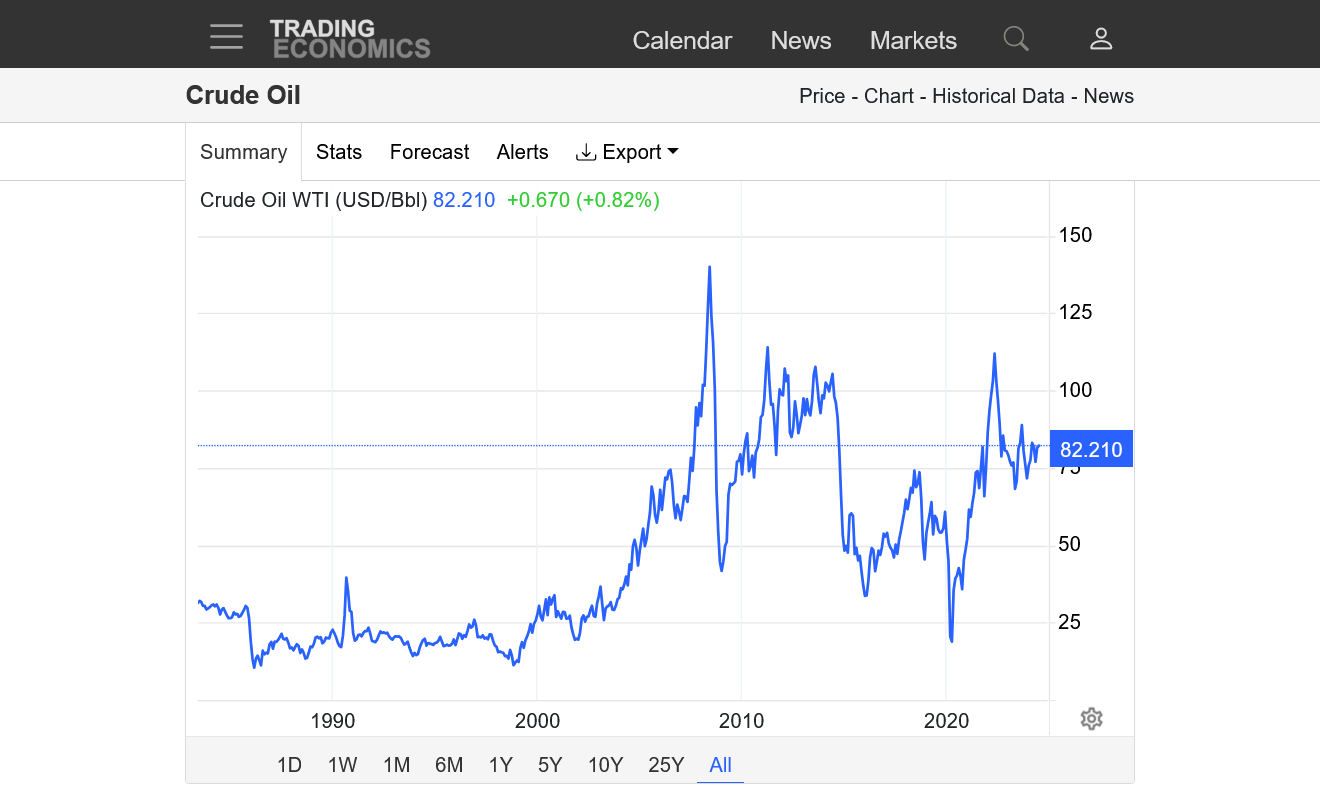
2. 40 years. Also a massive symmetrical wedge/triangle with lower highs and higher lows.
https://tradingeconomics.com/commodity/crude-oil
+++++++++

https://www.axi.com/eu/blog/education/symmetrical-triangle-pattern
https://www.investopedia.com/terms/s/symmetricaltriangle.asp

Crude market uncertainty. Downside looks more vulnerable with a Trump presidency.

oil new -- contract -- still Basis ( cash- futures) $$-- can be Good profits---!!
Thanks, fays.
The symmetrical wedge pattern continues.
https://tradingeconomics.com/commodity/crude-oil

7755 reached and now we adjust points in rollover 110 is more to go--7742!!
Thanks, fays!
Today is the last trading day for the front month, August contract...........convergence with cash price.
https://www.cmegroup.com/markets/energy/crude-oil/light-sweet-crude.calendar.html
Same longer term chart pattern with the downside STILL favored at the moment as indicated a week ago.
https://tradingeconomics.com/commodity/crude-oil
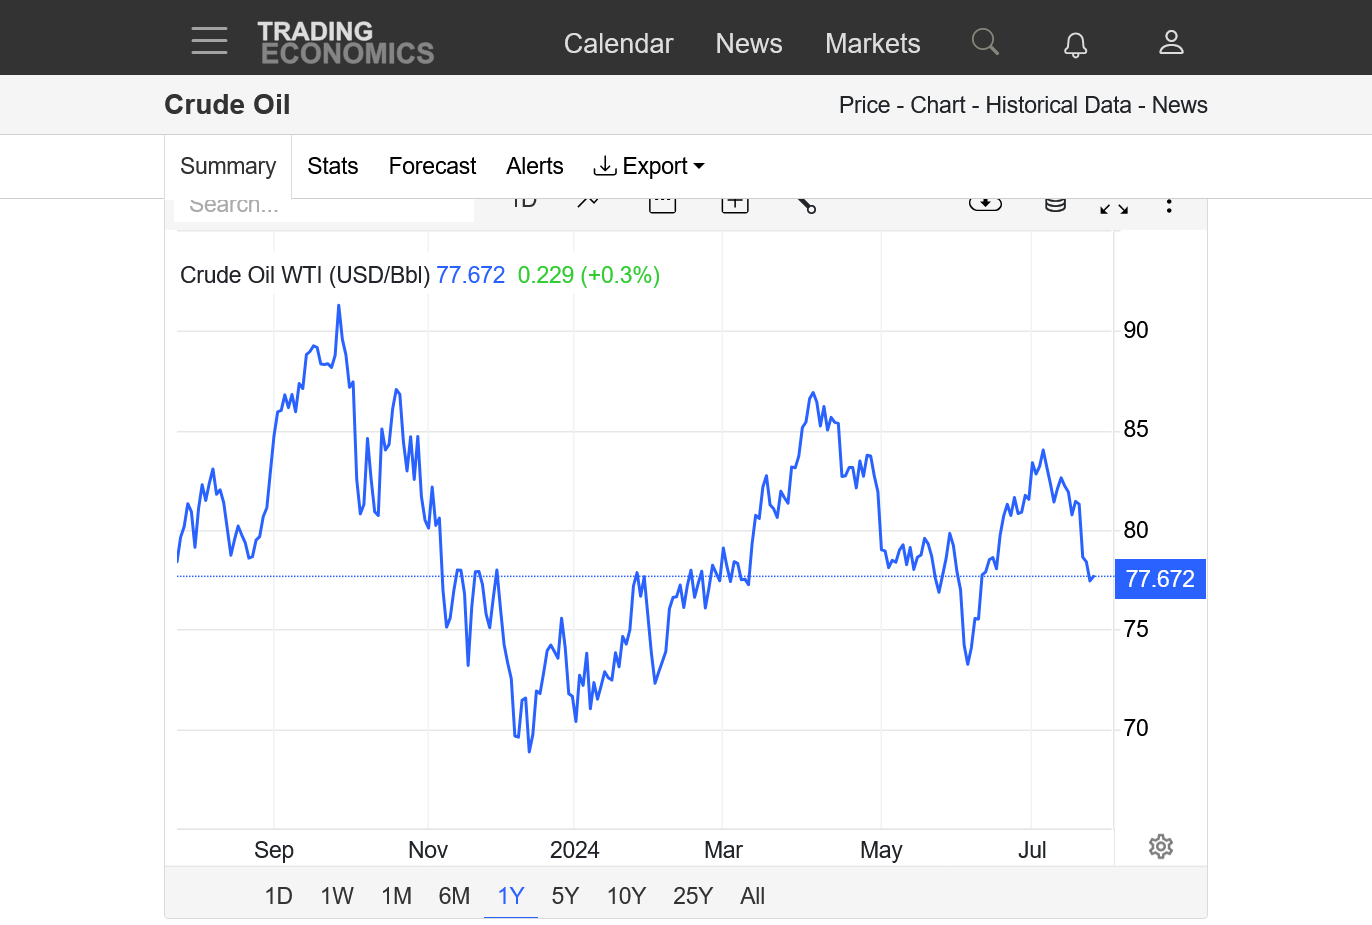
weakness continues in crude. After testing the top of the wedge channel or lower highs to start july, the sell off is taking us close to testing the bottom of the channel of higher lows.
This could all be related to cease fire news in the Middle East. ........I'm not trading this market, just having fun doing technical analysis with fays.
https://tradingeconomics.com/commodity/crude-oil
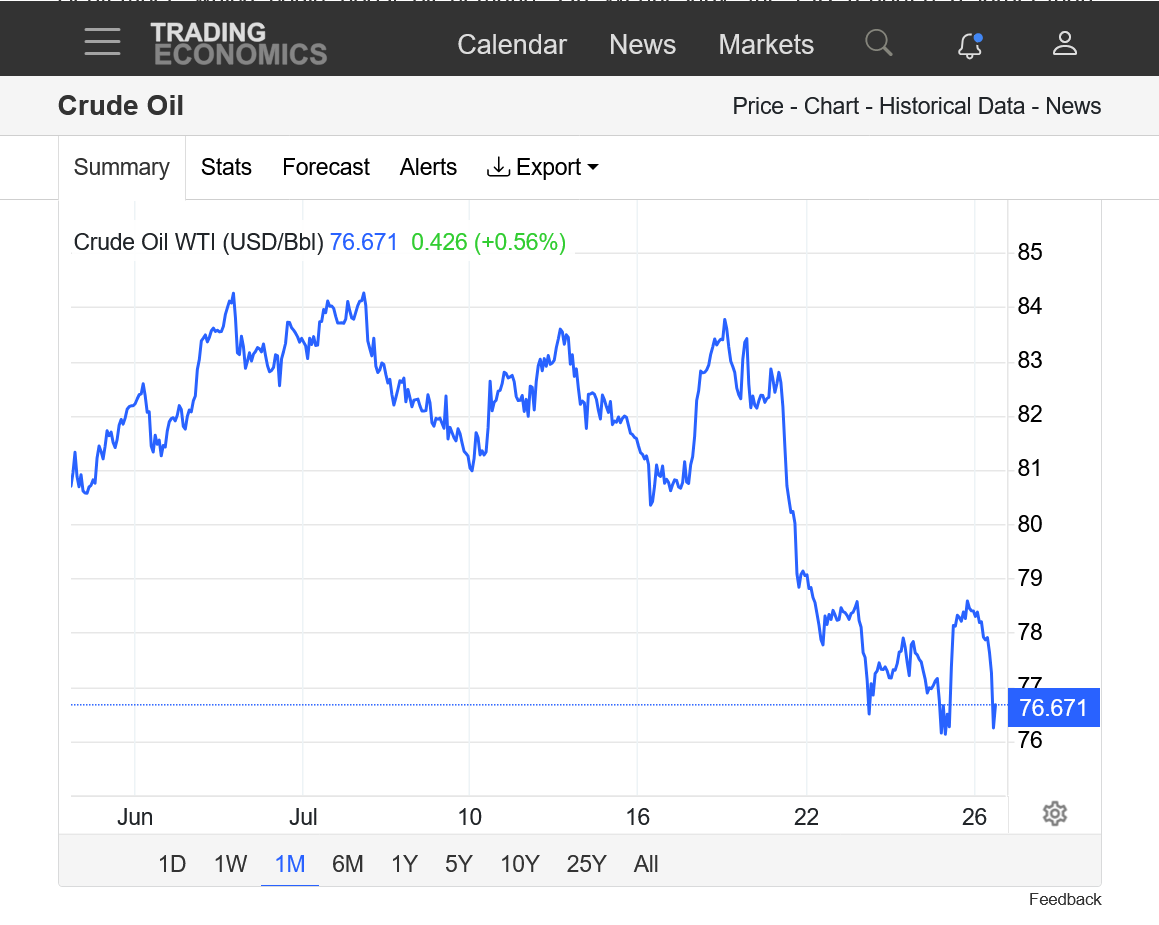
Downside outlook projection becoming a reality. Crude down sharply.
https://tradingeconomics.com/commodity/crude-oil


Thanks, fays!
Downside break out looks extremely likely DESPITE escalating tensions and increased chance of Middle East supply disruptions, which historically is very supportive to oil prices.
Impending recessions ALWAYS crush energy prices because they pull the rug from under demand. Especially a global recession.
1. 1 month-plunging $10
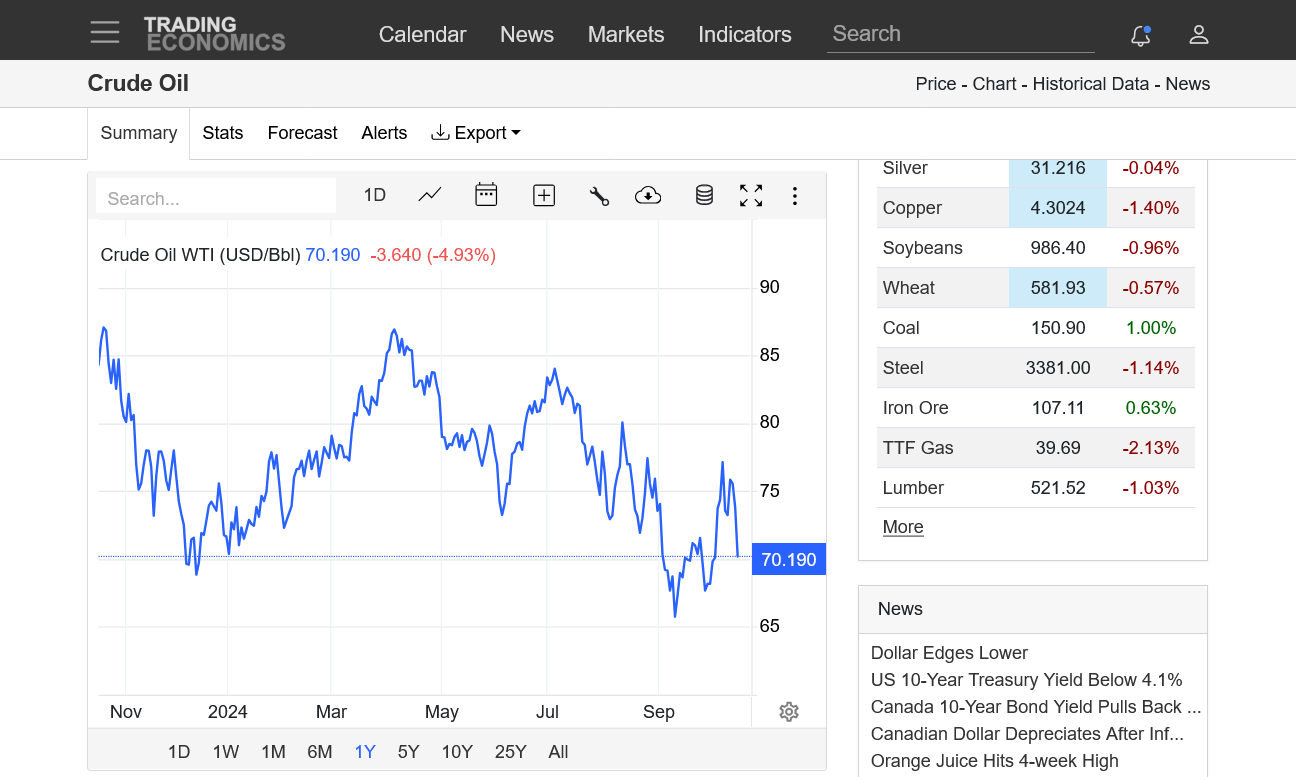
2. 1 year-verge of downside break out of wedge(lower highs and higher lows)
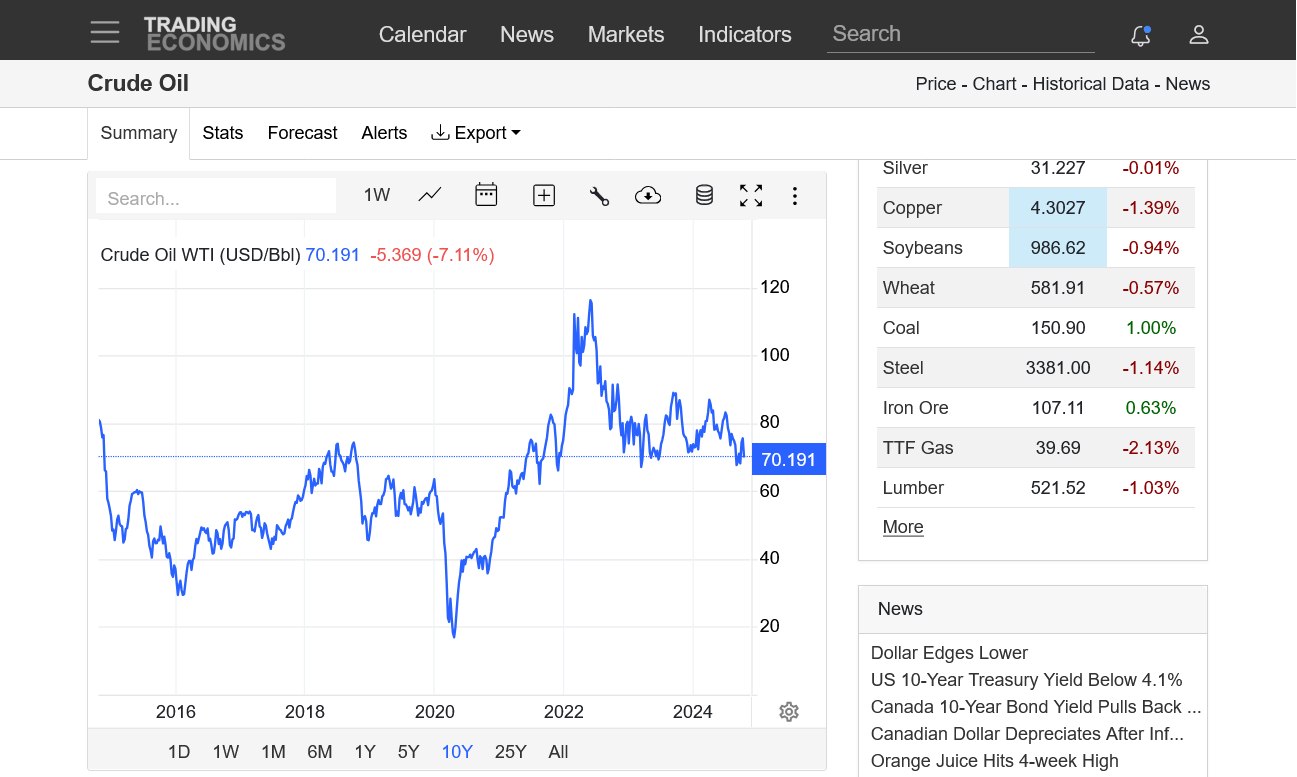
3. 10 years-downside break out of wedge likely
4. 40 years
https://tradingeconomics.com/commodity/crude-oil


+++++++++++++++
Plunging oil and gasoline prices will help Harris to be elected.
Crude continues to barely hang on to a key support level, when the Middle East news is extremely bullish and typically, would feature prices spiking higher...........but a global recession and reduced demand is weighing heavy.
1. 40 years
2. 10 years
3, 1 month
https://tradingeconomics.com/commodity/crude-oil


thanks, fays!
Longer term, could be a downside break out from a wedge pattern (lower highs and higher lows)
https://tradingeconomics.com/commodity/crude-oil
now new low made -- if it pull back to 7400 ish area and hold very important ---if break 6760 --5810==--- and we might see !! then !!--- mkt Dance move starts !!
Yes, great post and topic/market fays.
The price of crude oil is soooo important to everybody, even non traders because it greatly helps determine the cost of transportation and is a HUGE factor in inflation. We are at a fascinating place here for crude. Threat of a global recession is pressuring prices along with OPEC increasing production to try to help Harris get elected.
The charts are suggesting a potential major downside breakout from the wedge pattern (of lower highs and higher lows) but we could, use this as a last stand of MAJOR support. The fundamentals favor the downside but I'm not taking sides........just having fun doing analysis with people like you!
https://tradingeconomics.com/commodity/crude-oil
1. 1 month
2. 1 year
3. 35+ years

Here's an NTR thread on oil that is loaded with massive trading forum information:
Biden is a good commodity trader.
24 responses |
Started by joj - Sept. 4, 2024, 5:32 p.m.
https://www.marketforum.com/forum/topic/107174/
+++++++++++++++
The chart pattern suggests a downside break out but I would leave open the possibility that this could end up being a false break out.......unless we have a seriously global recession, which would keep oil prices suppressed from the reduced demand.
1. 1 year-downside break out
2. 5 years-downside break out
3. 10 years-encountering some solid support/potential buying
4. 30 years-the spikes lower the past 20 years WERE FROM RECESSIONS!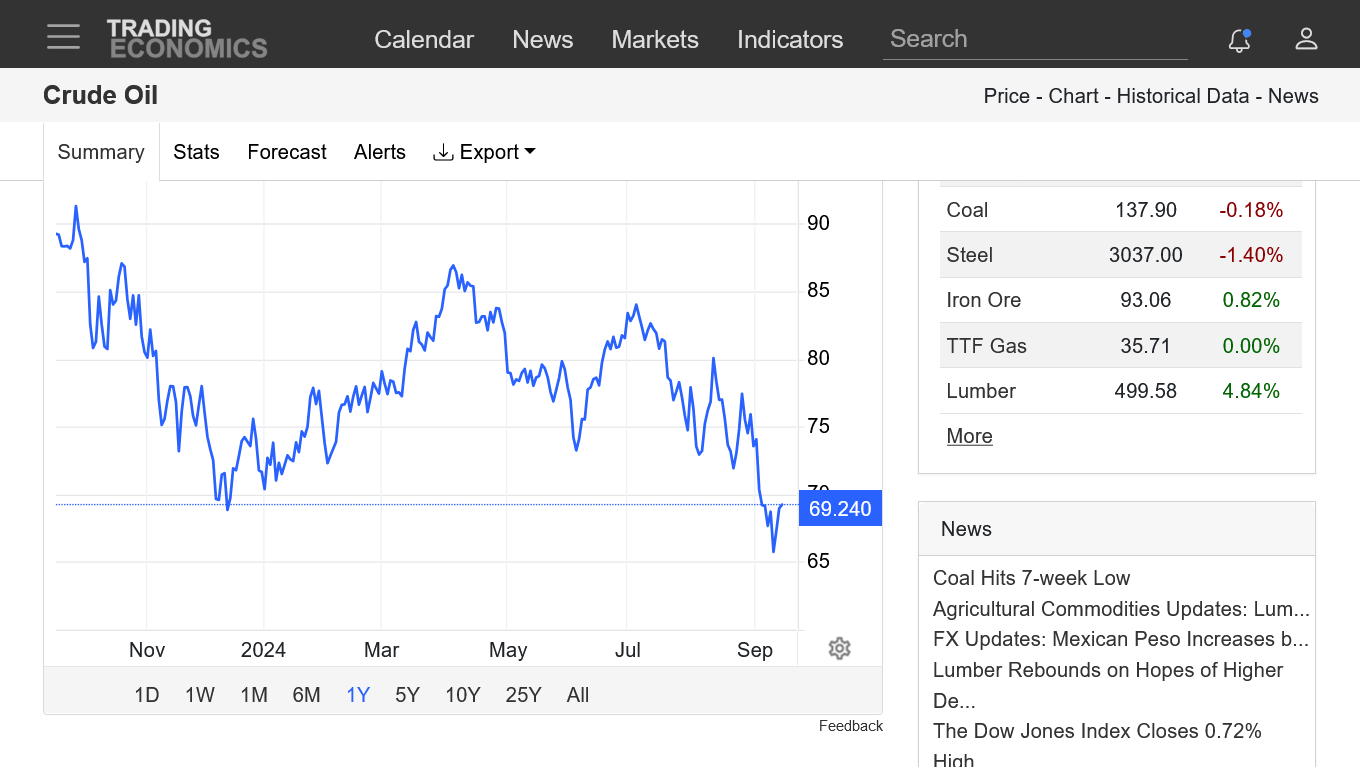


Another related thread:
Unleaded gas/crude
Started by metmike - Aug. 25, 2024, 8:56 p.m.
new low coming ---eclipse --7440 held so far -- now 6270 or 5840 !! rate cuts --
The Middle East conflict is impacting oil prices with added risk premium today ahead of Israel's massive strike against Iran. Currently +$3.60.
Technical analysis is of less value when the market trades unpredictable, black swan type news events like this. Note the spike higher when Iran attacked Israel. With continued gains since then.
https://tradingeconomics.com/commodity/crude-oil
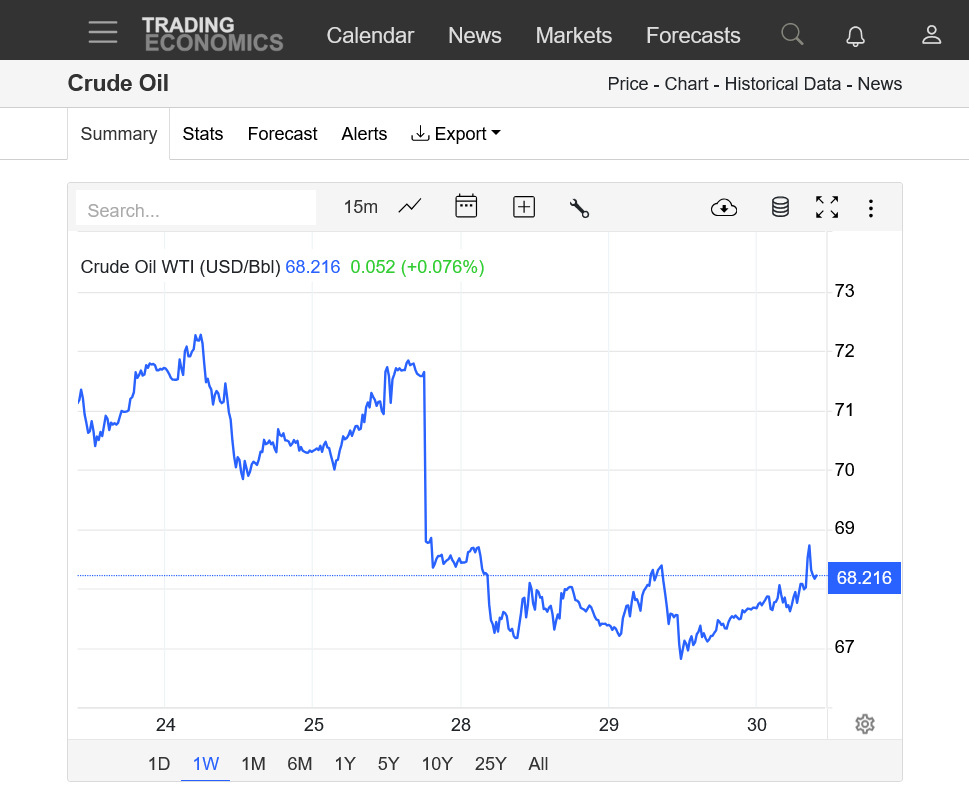
1. 1 week-between 8am-Noon on Tuesday, Oct. 1st, the price of crude spiked +$5!!! After the Iranian attack. Additional spike to new highs after Bidens comments greenlighting israel to take out Irans oil production. Held on a couple of tests of $70 support this week.
2. 1 month-Initially a major downside break out a month ago well below key $70 support, trading below $66! The market looked to be headed for a test of those lows earlier this week........THEN IRAN ATTACKED. Now, days later we have new highs, above strong, short term $72 resistance.
3. 1 year-testing the downtrend line from consecutive lower highs going back to April, 2024 when the price was above $86. Potential upside beak out above downtrend channel???(just a month after a MAJOR downside breakout below solid resistance at $70!) ……..except that this formation and signal is NOT reliable when the market is trading pure news In a volatile unpredictable political environment.
4. 40 years-lower highs going back to the June 2008 record high spike up. With the exception of the COVID spike lower, We also have mostly higher lows and an extremely long lasting, symmetrical triangle, wedge. Prices looked like they were breaking out to the downside on the long term charts and yearly chart BEFORE the Middle East war rescued the bulls from a price collapse.


=*360 gann circle -- cube 360 circle =cube?? earth circle ---- orbit 365.25 days 100 years ==?? circumference of earth --- with earth 100 years ==6812 = 6 sides 8 corners 12 lines ==lines 180 degrees corners=90 degrees sides square 4*90=360 and 91 day four season---- easy -- weasy lemon sqeazzy!!
Thanks, fays!
And now for a non gibberish, FUNDAMENTAL discussion to explain the price spike higher, almost +$4 today.
The crude market is dialing in significant risk premium for a global oil supply disruption with expectations that Israel will strike oil production facilities in Iran to take out its main source of income.
https://www.iranintl.com/en/202407018317
Iran’s crude oil and gas condensate exports surged to 1.7 million barrels per day (mb/d) in May, hitting a 5-year high point, since the imposition of full US sanctions in May 2019.
The country’s oil and gas condensate exports reached 1.65 mb/d in the first five months of 2024, according to oil analytics firm Vortexa, as the Middle East experienced its worst violence in decades, triggered by the October 7 attack on Israel.
Iran’s custom statistics also indicate increasing oil revenues by 34.8% year-on-year to $12 billion during the first three months of current Iranian fiscal year, started March 21.
++++++++++++
If we take 1.7 million barrels per day of supply off the global market, it's BULLISH to crude oil prices. Israel doing this would also deprive Iran of its main source of income that was $12 billion in just the first 3 months of this year.
The reason that we've seen oil (and products like unleaded/heating oil) prices crashing lower recently is that China is in the midst of a recession which is cutting demand for oil in the #1 demand country in the world. As a result, global supply had been EXCEEDING global demand.
If not for this extremely bearish factor to global oil fundamentals, crude would have responded even stronger to the potential supply disruption in Iran.
https://www.iea.org/reports/oil-market-report-september-2024
Oil prices spiralled lower in August and early September, with ICE Brent futures plunging by about $10/bbl as floundering Chinese demand and economic headwinds heightened oversupply fears. Investor selling added to the bearish sentiment, with net speculative exchange holdings slumping to multi-year lows. At the time of writing, Brent was trading at around $70/bbl - the lowest level since late-2021 and down $20/bbl from April's 2024 high.
++++++++++++++++++
Much of the reaction today(when Iran attacked 2 days earlier) was tied to this remark by Biden:
https://www.newsweek.com/oil-price-surge-response-biden-israel-retaliation-comments-1963194
++++++++++++++++
Anybody following the talks between the US and Israel knows that we can't trust a word that Biden says about anything related to it. However, for Biden to signal the green light for targeting Iranian oil production is pretty bullish because most of the time, he pretends(postures) to be compelling Israel to exercise restraint(which is futile and always ignored).
One would guess that this time, he's likely being honest.
By metmike - Oct. 3, 2024, 11:16 a.m.
+++++++++++
metmike: I would be surprised if Israel does not use this as an excuse to take out Iran's nuclear facilities (which makes sense considering the LEGIT threat) which makes Biden's statement about Israel and Iran's nuclear program completely absurd and similar to most of his nonsense the past year.
https://www.wsj.com/opinion/iran-israel-strikes-benjamin-netanyahu-joe-biden-8e6d044d
+++++++++++++++++++
+++++++++++++
https://foreignpolicy.com/2024/10/03/israel-iran-nuclear-weapons-biden-netanyahu-destroy-now/
++++++++++++
Some of those articles are pay walled but their headlines MAKE THE POINT CRYSTAL CLEAR about the dire threat to Israel WHEN Iran obtains the ability to arm one of its missiles with a nuclear payload.
In fact, it doesn't make sense for Israel to administer extreme, inhumane, collective punishment to 2 million mostly innocent people, mostly children and women that are a ZERO threat to Israel for almost a year and NOT take out the real threat to Israel in Iran(nuclear weapons).
Of course Netanyahu is doing what he is doing in Gaza because of hate, outrage, revenge and ethnic superiority/ethnic cleansing with Gaza having no ability to fight back and the entire world having no ability to stop him.
Iran is a much different dynamic. They are actually a threat.
Israel supposedly telling the US that it won’t attack irans oil or nuclear sites and only attack military sites has seen rhe price of oil gushing out risk premium since that statement before the afternoon close on Monday. Down almost $4 right now.
https://tradingeconomics.com/commodity/crude-oil
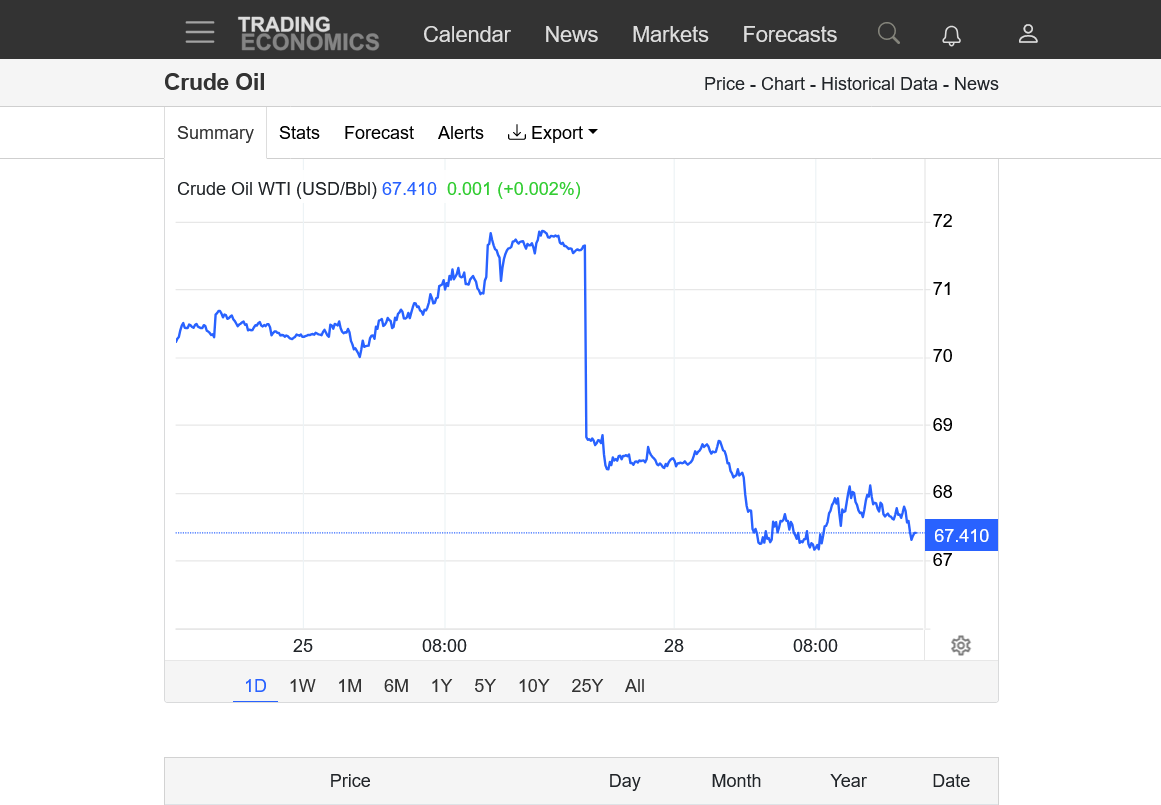
1. 1 day: Spike down late Monday afternoon ON NEWS!
2. 1 month: Top is in for this Iranian oil supply scare
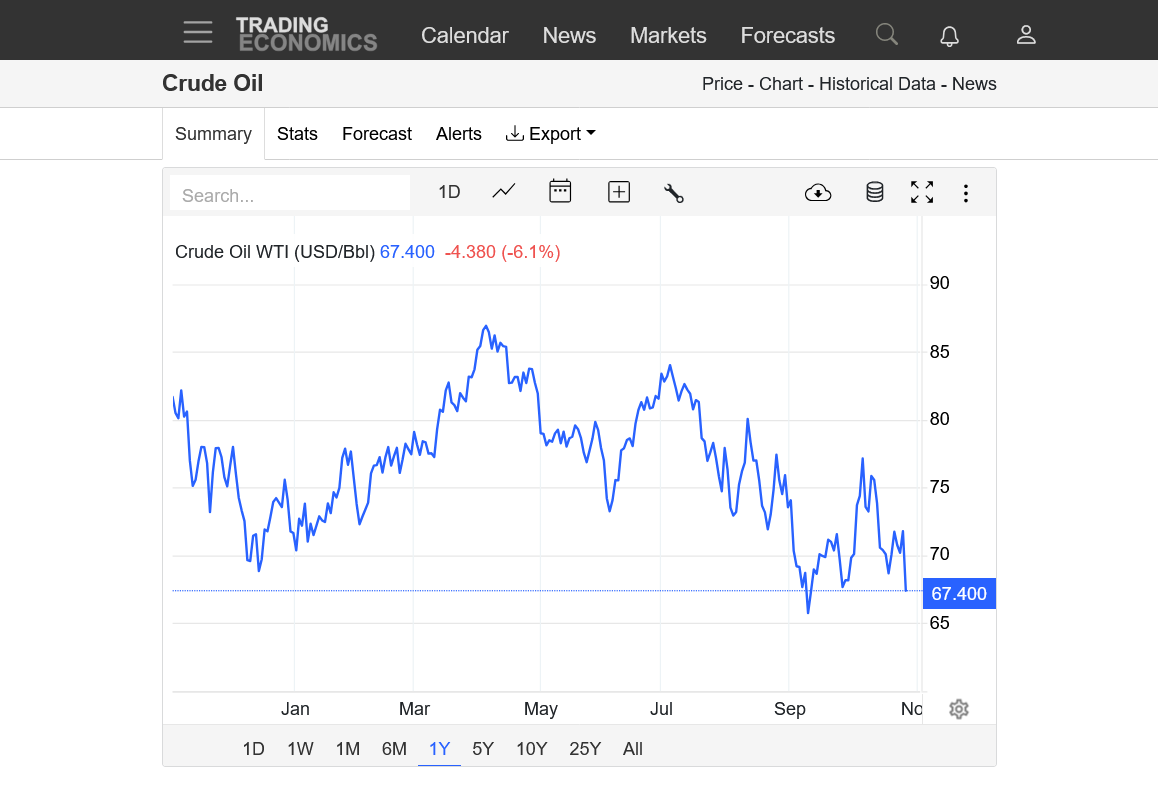
3. 1 year: Still in a downtrend
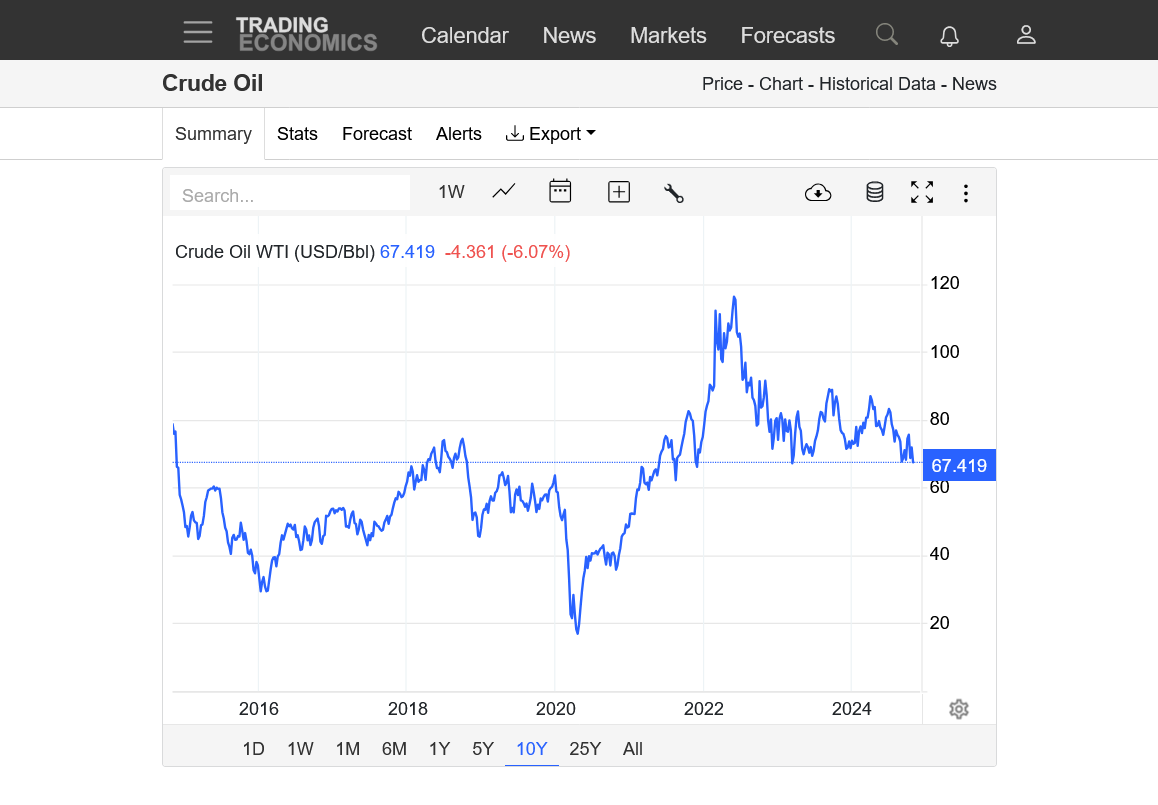
4. 10 years: On the verge of a downside breakout below major support, temporarily reversed by extreme news relating to the threat of losing oil coming out of Iran. Now back on that path??
5. 40 years: With the exception of the 2020 COVID spike lower, lower highs and mostly higher lows. Symmetrical wedge!


https://itez.com/en/blog/education/lower-highs-higher-lows-trading-guide


Thanks, fays!
Alot of news and contradicting/uncertainty. Charts don't have as much meaning.
1. Will Iran's production be impacted by Israel?
2. OPEC WANTS HARRIS ELECTED. They have been advertising an increase in production to try to coax prices lower to help her.
3. Netanyahu wants Trump elected. There will not be a ceasefire before the election. Nobody can predict what he will do.
4. Chinese demand is dropping.
5. Presidential election
Oil gapped much lower because Israel did not take out Iranian oil production With the strike very early on Saturday, their time.
down over $3 right now..
downside breakaway gap lower that also is threatening to break out to the downside of a symmetrical wedge formation!!! Down over $10 from the spike higher earlier this month on news.
Getting close to mega support just below $66 from the September 2024 low.
https://tradingeconomics.com/commodity/crude-oil
1. 1 day-massive gap lower on the open Sunday Night
2. 1 month-barely above the late Sept lows. Those lows are MAJOR support.
3. 1 year-downtrend with lower highs since the April 2024 high above $85
4. 10 years-near 3 year lows and MAJOR support Potential major break out to the downside BUT ONLY IF THIS SUPPORT CANT HOLD.

Major support held and crude has managed to work its way back up to the bottom of the gap lower to start this week(Sunday nights open).
The huge gap needs to be filled to negate this very bearish technical formation.If that happens, it becomes a BULLISH, selling exhaustion technical signature on the charts.
Again, this is a market dominated by volatile, unpredictable news that at times is trumping the typical fundamentals.
https://tradingeconomics.com/commodity/crude-oil
1. 1 week below
7244 MOB (make or Break) Friday close --above this ----New moon ---election --a lots of fun next week !!
Thanks, fays!
We've closed the weekly and daily gap lower. So this is now a gap and crap, selling exhaustion formation...which is bullish!
https://tradingeconomics.com/commodity/crude-oil
1. 1 month
How quickly the technical picture has changed from Sunday Night/Monday!!! Much of it tied to Middle East/news psychology.
From an extremely bearish mentality to the bulls taking control.
https://tradingeconomics.com/commodity/crude-oil
Crude dropped over $2 from the early morning highs to finish with a reversal down after making new highs for the week. Now around unch for the day but lower for the week and, once again flipping the tone/mentality back to bearish.
Impossible for me to trade or predict but fun to follow, analyze and share.
Crude oil seems volatile lately. Too much going on in the world. I haven’t traded oil in a while. $3-4 dollar swings are too much for me.
Thanks, Jim!
I never traded crude because weather isn’t a factor, so I should have said it would be impossible for me to trade if I traded it. Impossible to predict right now…..and you need price prediction skill if you want to be on the right side of a trade.

Thanks, fays!
sorry for the slow response. In Detroit with my 99 year old dad that isn’t doing so well.
no problem say hello 2 your dad , u R Lucky to have him with you ,stay blessed and prayer for good health