Previous thread:
Grains May 28, 2024+
90 responses |
Started by metmike - May 28, 2024, 2:51 p.m.
https://www.marketforum.com/forum/topic/104311/
+++++++
In July, WEATHER is KING!
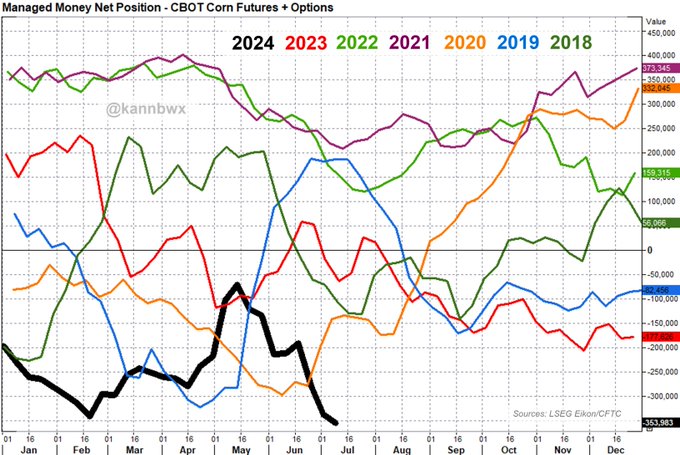
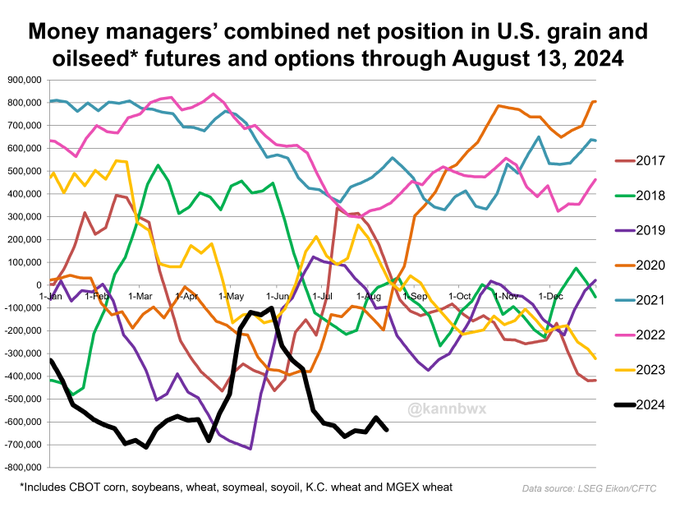
July 9: Money managers establish RECORD net shorts in both CBOT #corn & #soybeans. Combined, the two net shorts total about 527,000 futures & options contracts. That's obviously an all-time record and WELL above the prior July high of 192,000 in 2018.

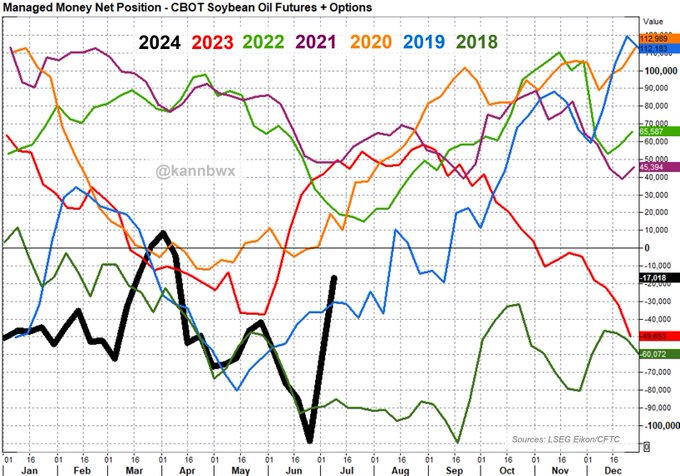
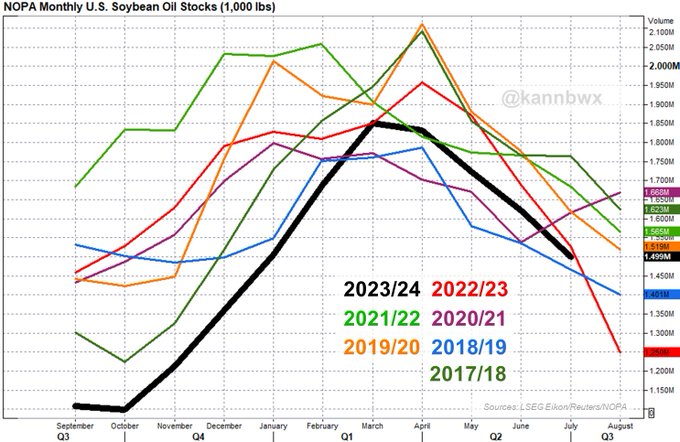
Specs have been selling everything but CBOT #soyoil. In the two weeks ended July 9, money managers were net buyers of more than 91k futures & options contracts, blowing away the prior two-week max of 69k in August 2016. The July 9 net short of 17k is a 13-week low.
USDA crop conditions entire report:
https://release.nass.usda.gov/reports/prog2824.txt
charts and graphs.........updated later:
https://www.nass.usda.gov/Charts_and_Maps/Crop_Progress_&_Condition/2024/index.php
++++++++++++++++++++++++
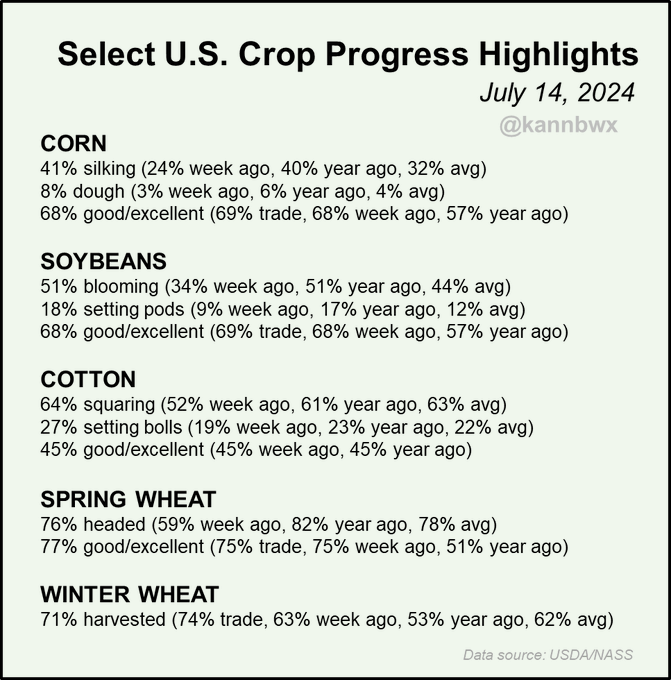
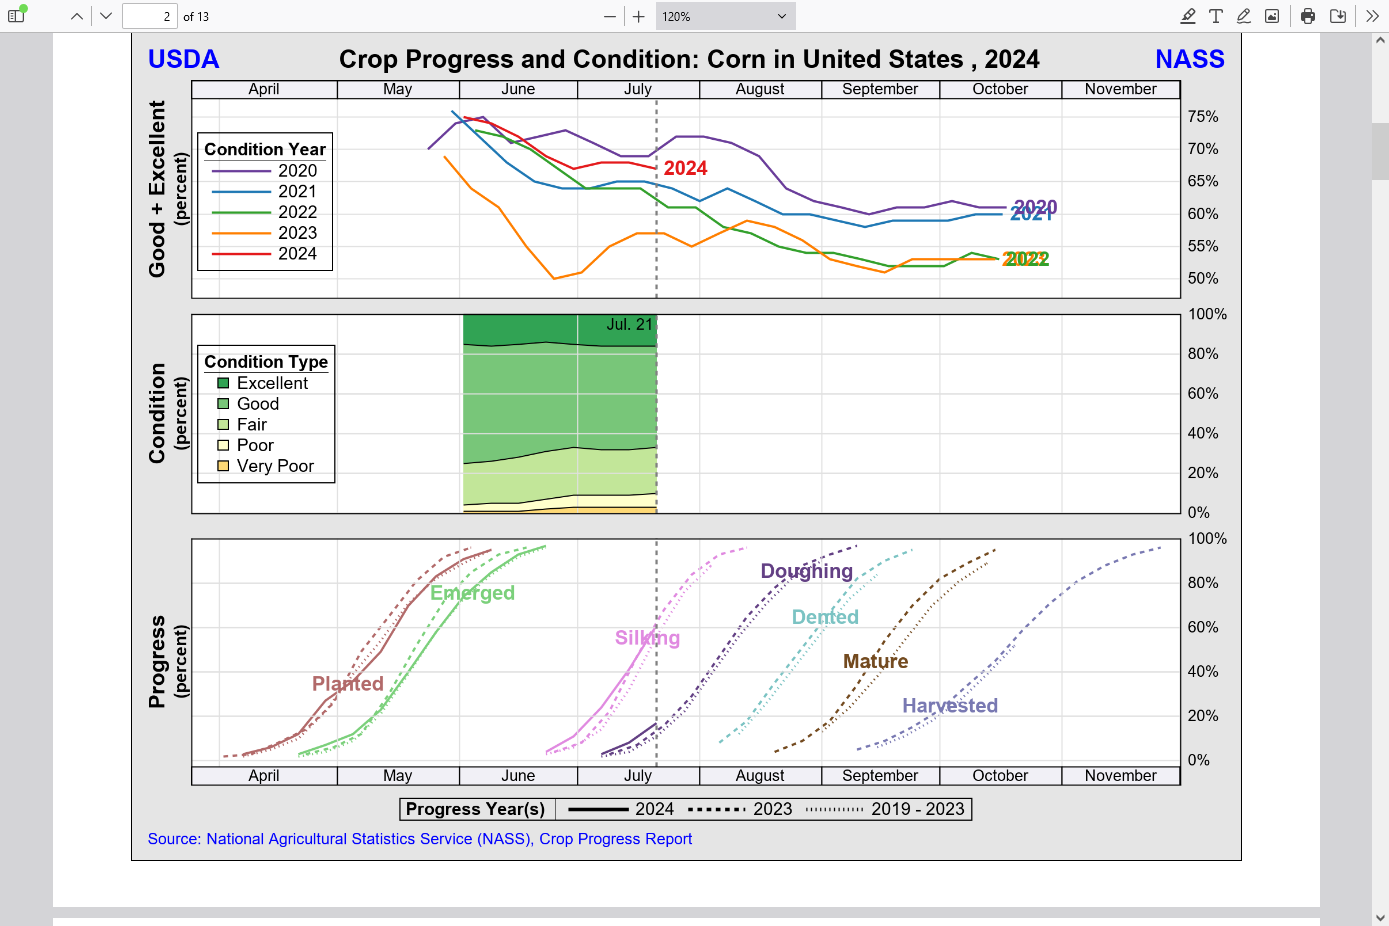
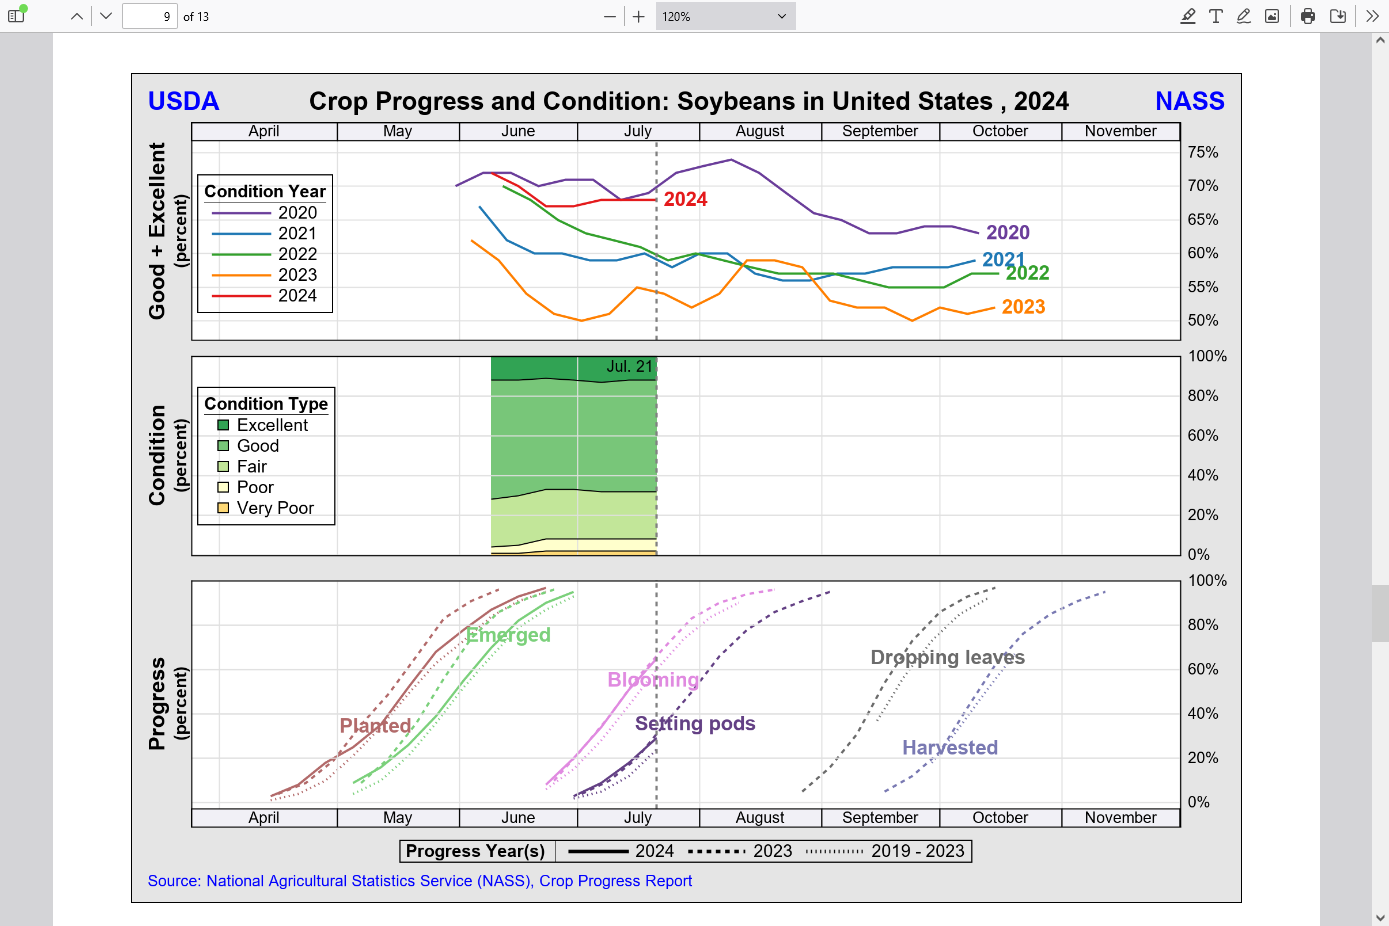
Crop conditions for U.S. #corn & #soybeans were unchanged on the week against expectations for a 1 pt rise, but spring #wheat conditions rose 2 pts (unch was expected). #Cotton conditions remained steady. Corn, soy & cotton development is ahead of average pace.
Northwest flow is bearish for grains in July.
There will be perturbations in the northwest flow that bring clusters of t-showers but the northwest half of the Cornbelt should see net drying the rest of the month, some spots potentially missing out on ALL rain.
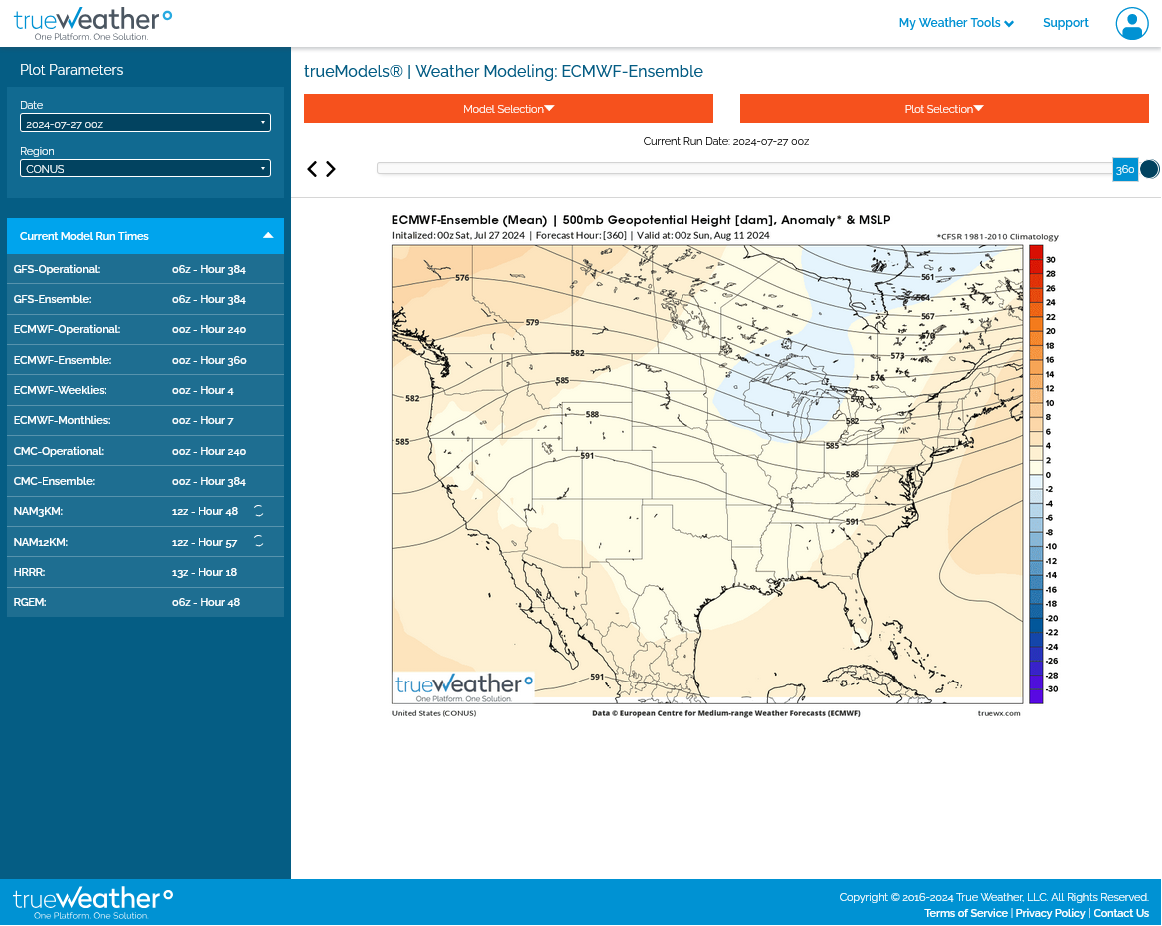
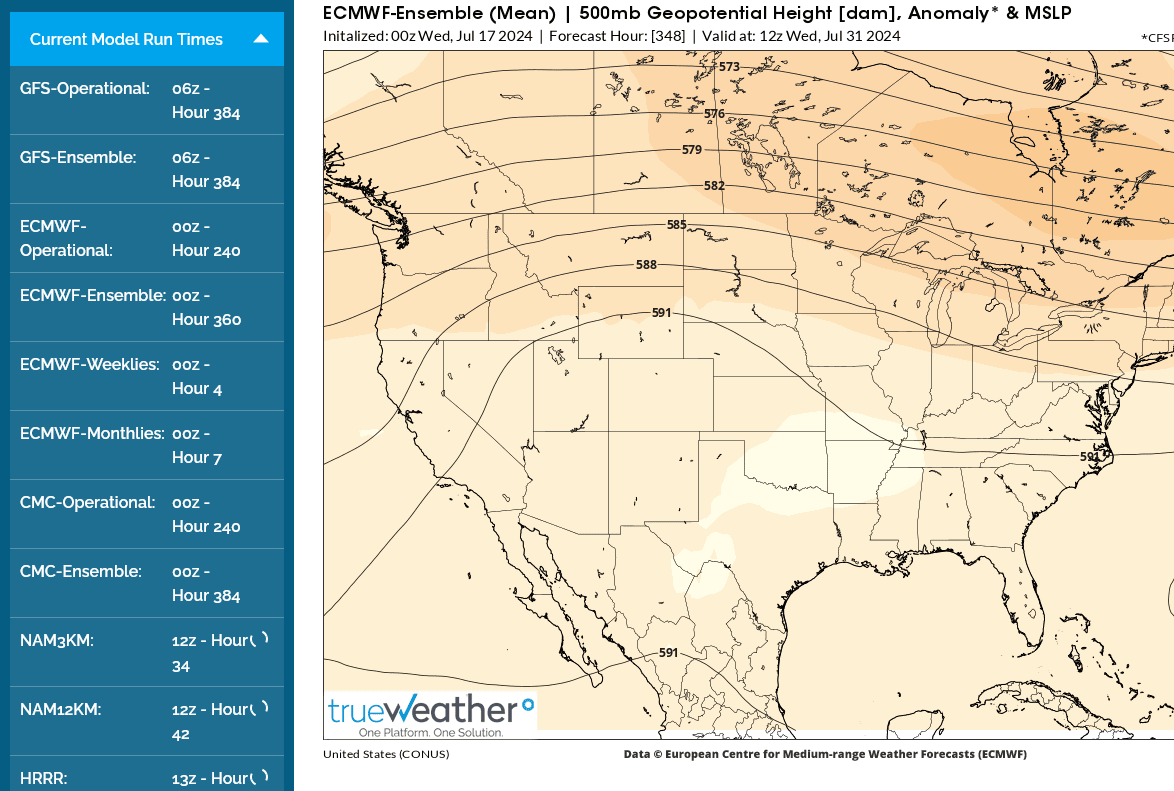
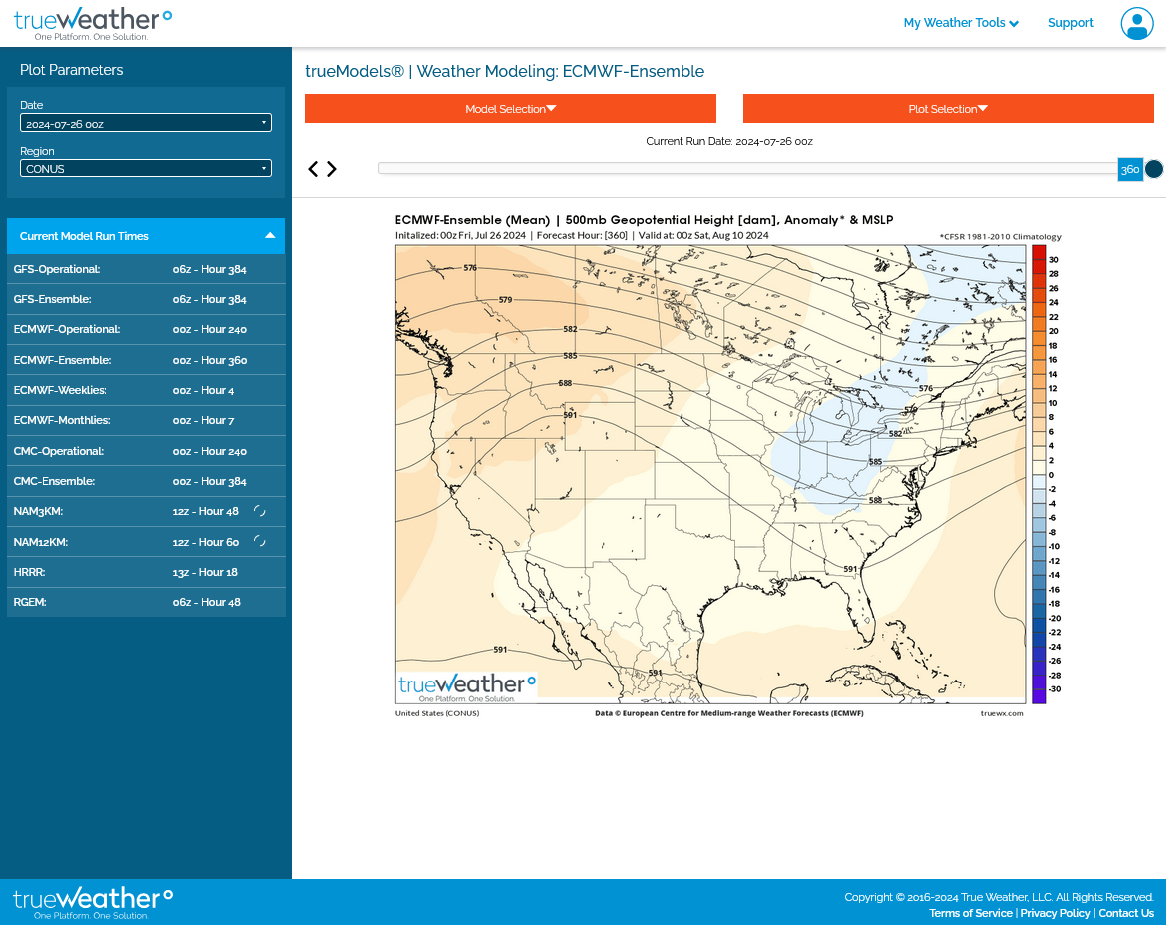
1. 500 mb, upper levels for the last day of July on the last 0z European model
2. Total rains-wet east TX. to Southeast to Mid Atlantic.

Heat in the Western Cornbelt, spreading across the northern tier in week 2 and net drying became bullish today:
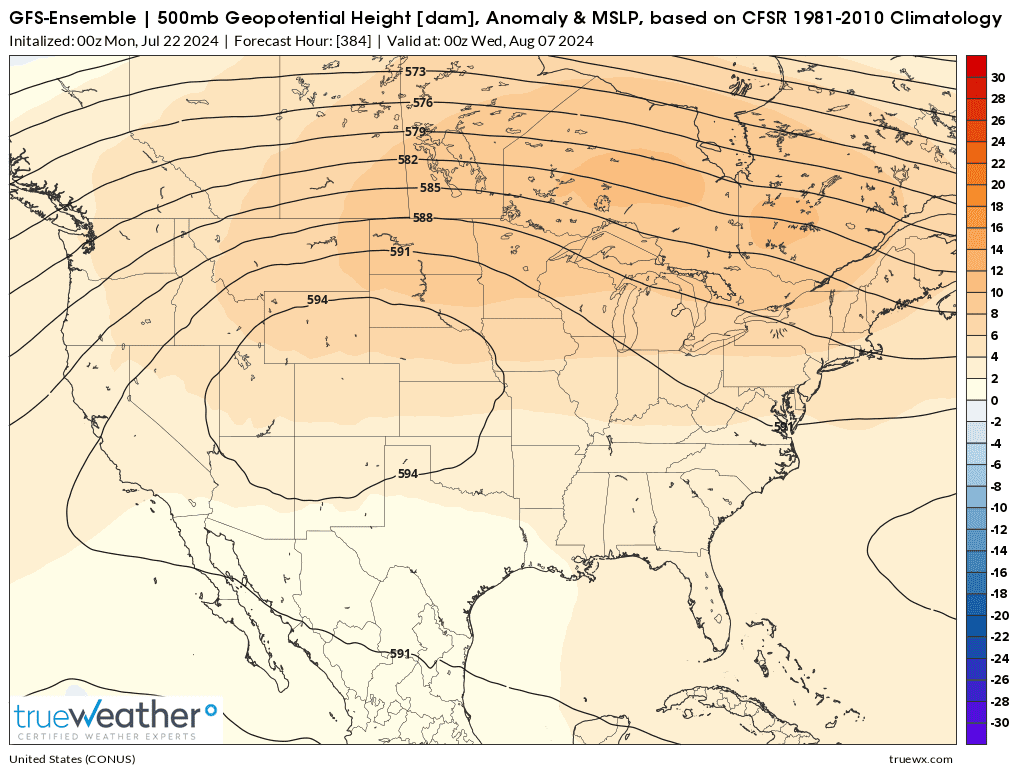
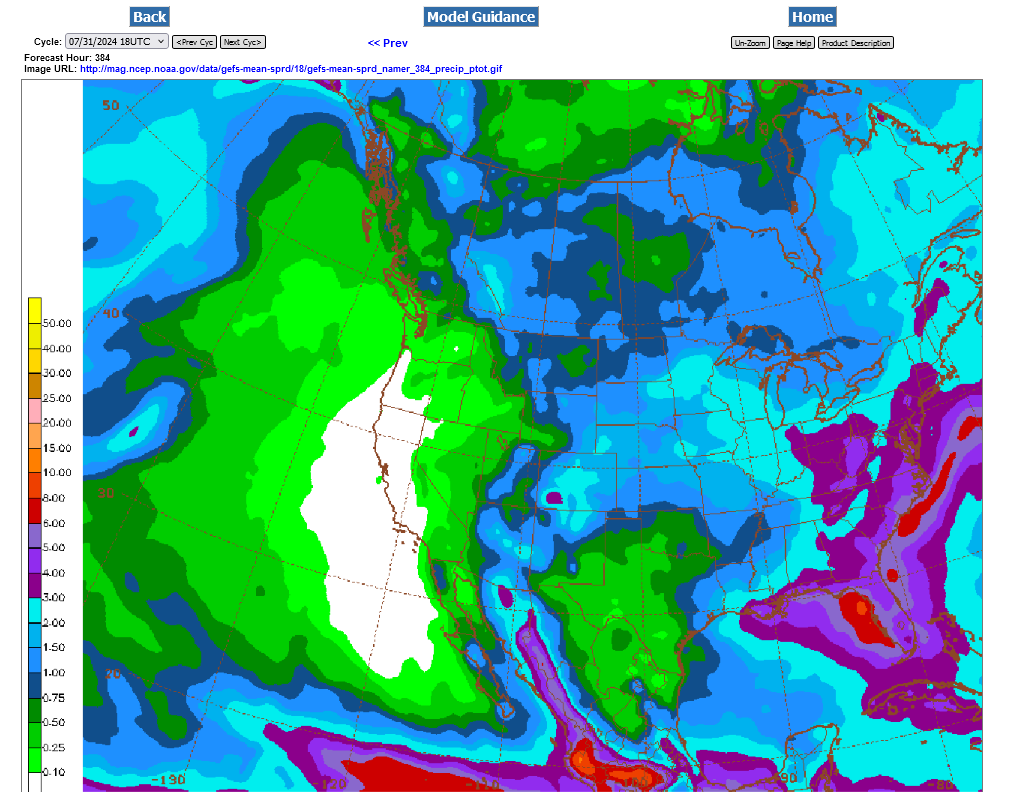
1. Upper levels in 2 weeks on the last 12z GEFS.
2. Total rains. Light blue =2+ inches. Those areas should be ok. Areas west and northwest of that with less rain and MAJOR heat will see drying. Some areas missing all the rain will see a great deal of drying.
3. Those same areas are pretty wet right now, so it won't have a serious impact until August..........the key month for beans that have flowered/complete flowering and do pod filling.

Soilmoisture anomaly:
These maps sometimes take a day to catch up to incorporate the latest data(the bottom map is only updated once a week).
https://www.cpc.ncep.noaa.gov/products/Soilmst_Monitoring/US/Soilmst/Soilmst.shtml#
![]()

Crop condition.
-1 corn
unch beans
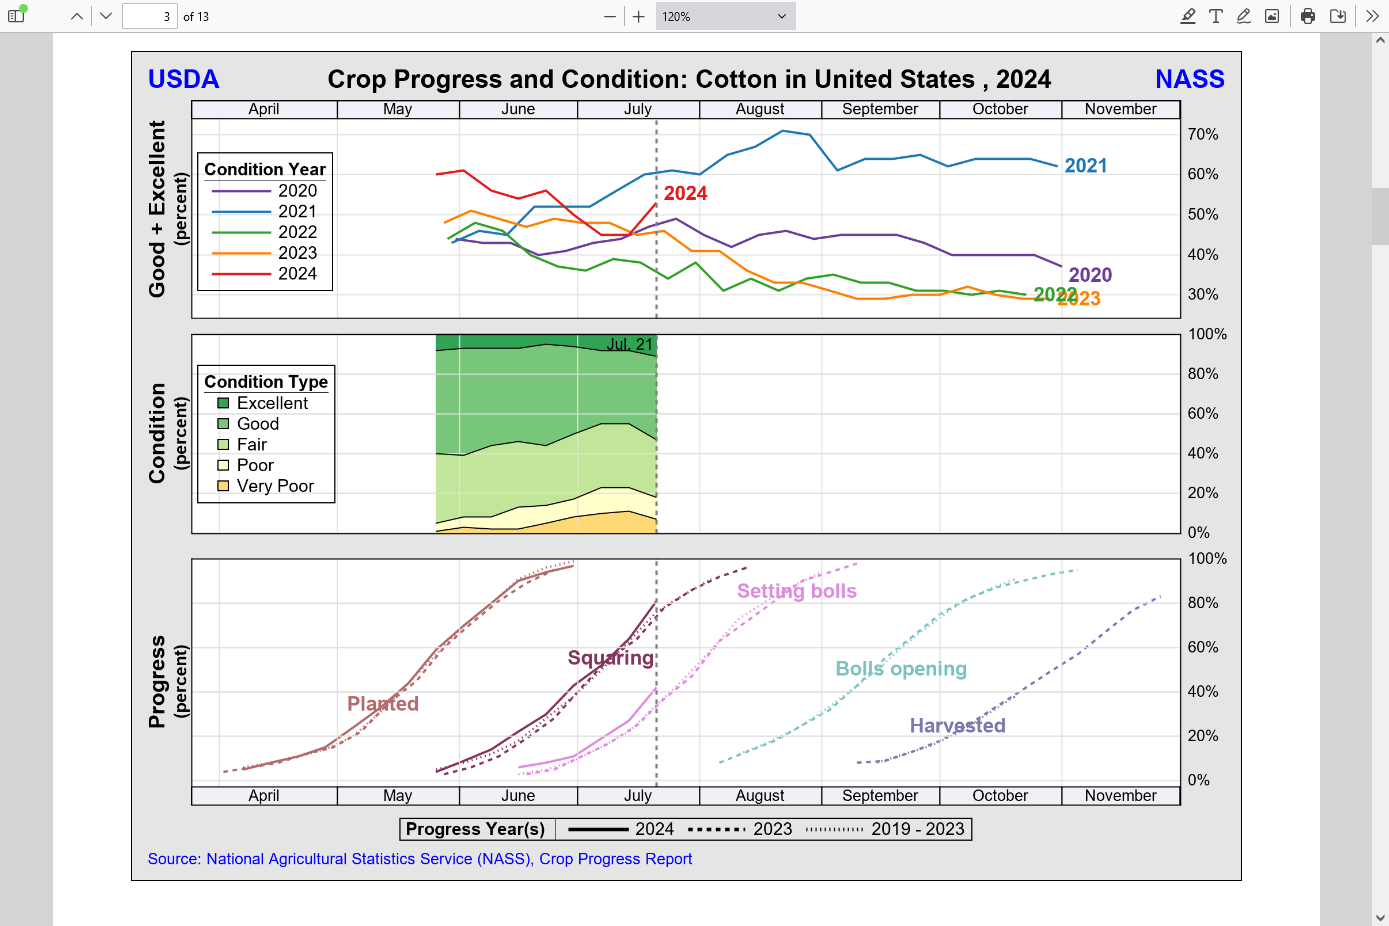
+8 cotton
++++++++++++++++
The improved ratings has caused a downside break out below 70c for cotton.
https://www.nass.usda.gov/Charts_and_Maps/Crop_Progress_&_Condition/2024/US_2024.pdf
Here's the just out, 12z Canadian model. Back to more northwest flow in the Midwest (dome backing up again) vs earlier in the week that showed the heat ridge expanding eastward.
This is for 384 hours, 16 days from now.
https://weather.gc.ca/ensemble/charts_e.html?Hour=384&Day=0&RunTime=12&Type=gz

After turning more bullish on Thursday, models overnight turned MUCH less bullish with the upper level ridge backing up far to the west. With strengthening northwest flow into the Midwest and a weak upper level trough in the Eastern Cornbelt that is downright BEARISH.
Last 0z European model for 15 days from now:
+++++++++++
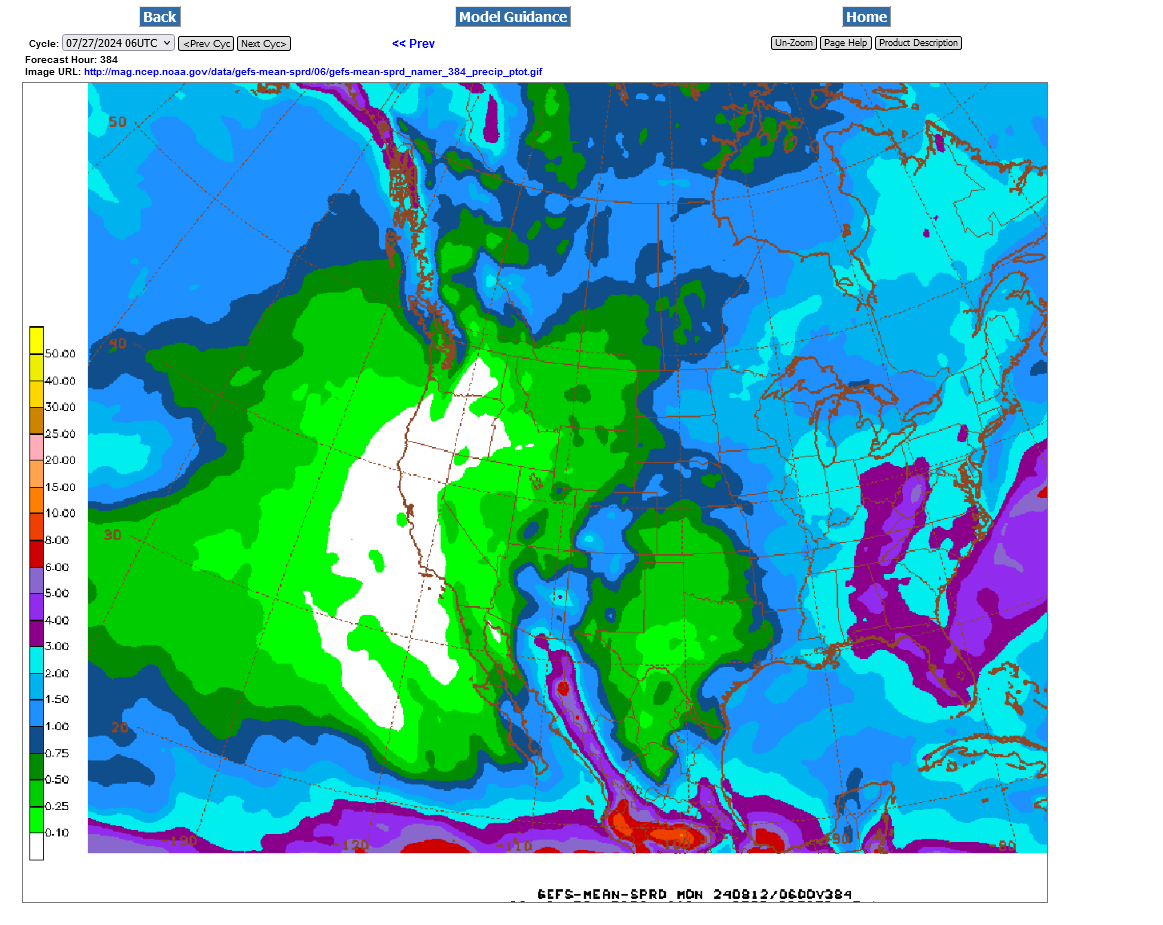
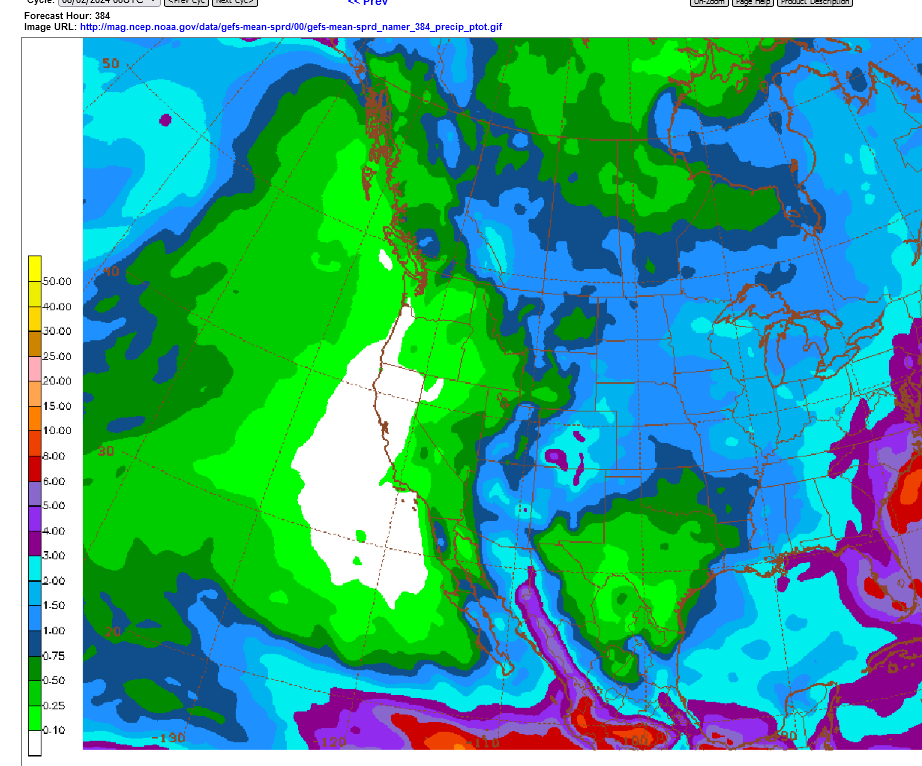
Last 6z GEFS run for 2 week, total rains: 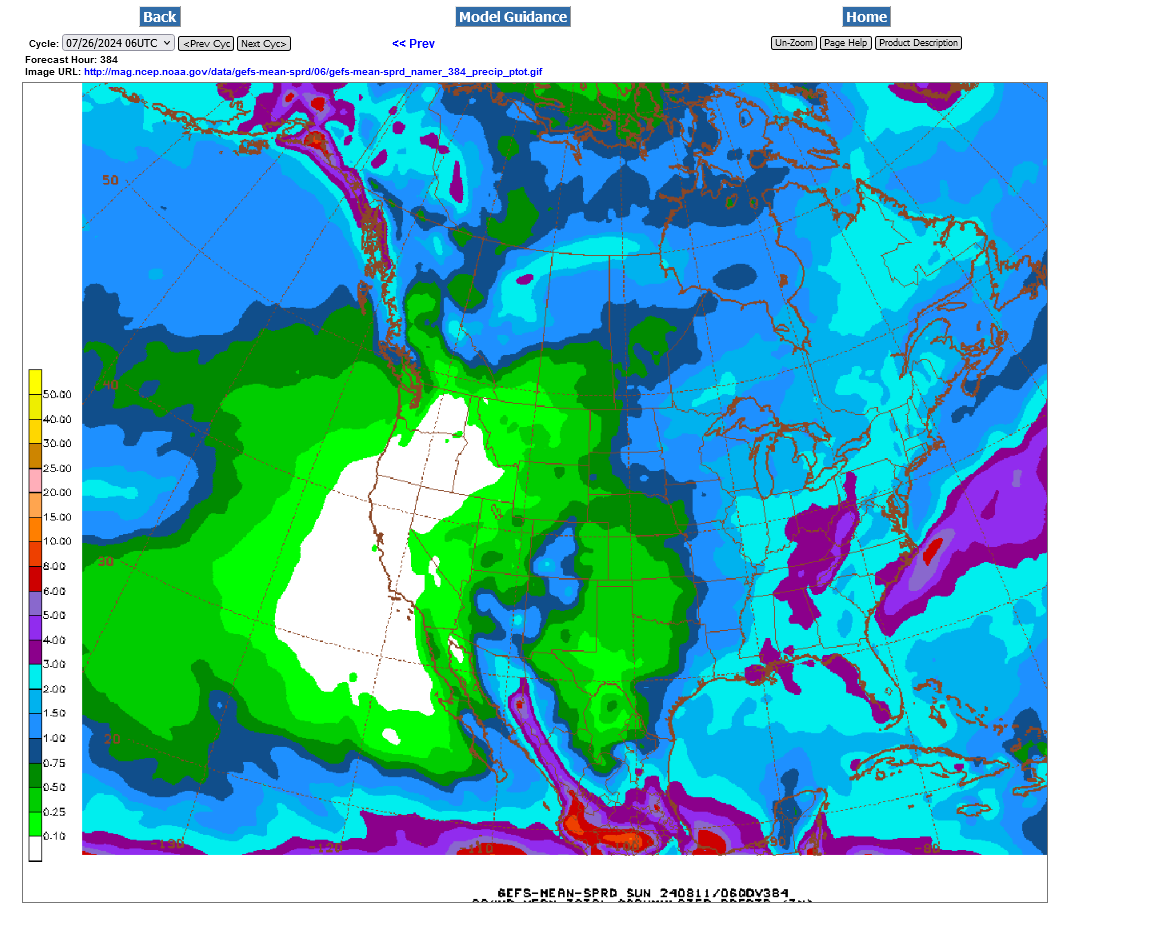
The 2 week rain totals from the last 6z GEFS tell us why beans are -25c this last Monday in July.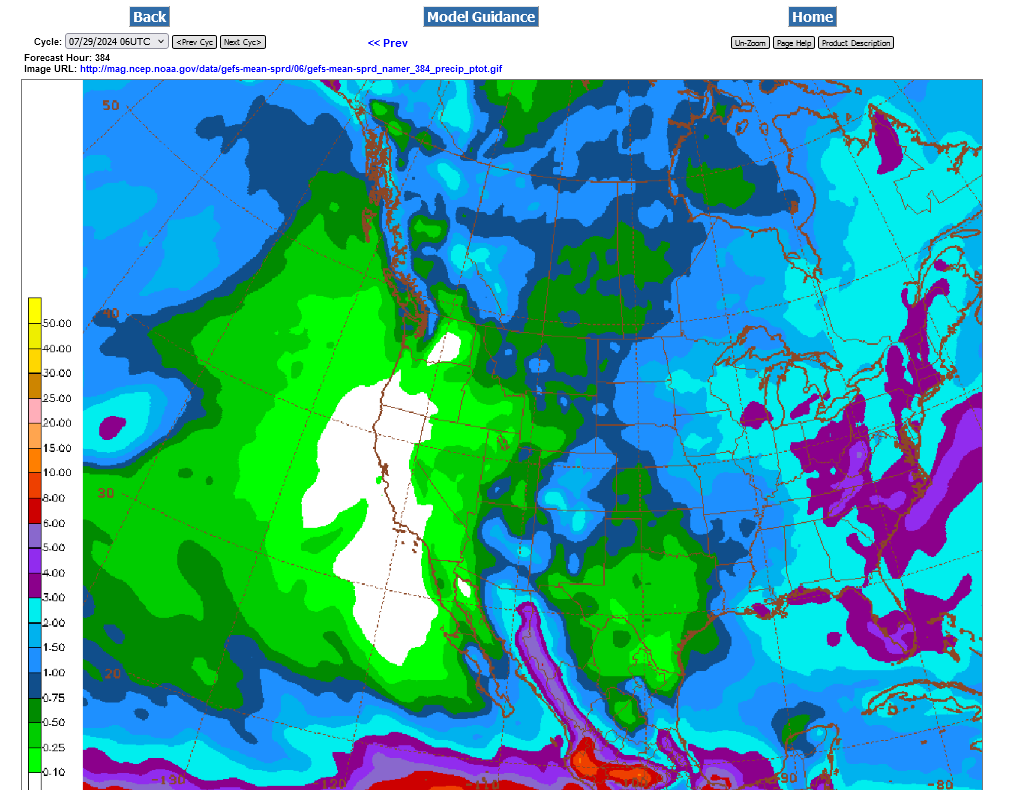
The upper level pattern is morphing to a ridge in the south in August. 2 weeks out below.........with clusters of storms, over the top, then sliding southeast, basically following the heavier rains configuration on the map above.
One huge reason for this to be a WET forecast for those areas is the strong Bermuda high, seen to the far right/bottom of this 500 mb map for 2 weeks from now. This will PUMP moisture in from the Gulf of Mexico on it's western side with southerly winds dominating.

Corn and beans had a tiny decline which is actually bearish in late july since crop conditions seasonally drop from evaporation rates exceeding rain amounts with just average heat.
cotton conditions were -4% after being +8% a week ago from nice rains in the cotton belt(2 weeks ago).
Cotton had a small gap higher on the open last night that looks like an upside break away gap as a result of this, as well as the rain suppressing heat dome being centered on top of cotton country the next 2 weeks.
Finally realizing my Olympic dream in Paris! I will be here covering gymnastics for Reuters over the next two weeks, so you won't see much ag stuff from me at the moment. Don't worry, that's temporary, unless I decide to stay in Paris forever!
Rain makes grain in a July/early August forecast.
Total 2 week rains from the just updated 6z GEFS. Storm clusters riding southeast along the periphery of the heat ridge! Light blue is 2+ inches. Magenda is 3+ inches. This is even WETTER than yesterday, which was even wetter than the weekend which was even wetter than last week.

Get all the weather here:
We just got .52 inches of wonderful rain in 10 minutes after 2 weeks of dry weather and missing several rains here in southwest IN.
8pm: another 1.3“ this evening.
1.82 for today, 7-30-24
Rains the past day. Yippee for Evansville IN
Note the heavy band coming around the top and tracking southeast around the heat ridge!
https://www.wunderground.com/maps/precipitation/weekly
Same pattern for the past week below:
The forecast continues to show abundant rain for much of the Cornbelt the next 2 weeks. This is from the just out 6z GEFS:

This is the upper level forecast in 15 days from the European model. The upper ridge has backed out of the picture with northwest flow. The yellow, is vorticity/spin in the atmosphere which contributes greatly to the lift that comes with rain making weather systems:

Looking like bumper crops this year
Do we have any agronomists on this site? When is there too much rain in growing season?
Any analog years with 'lots' of rain for predicting cycle low?
I bought a wheat sept call and oat futures based upon my predicted cycle low timeframe.
Good to read you, tjc!
When is there too much rain in growing season?
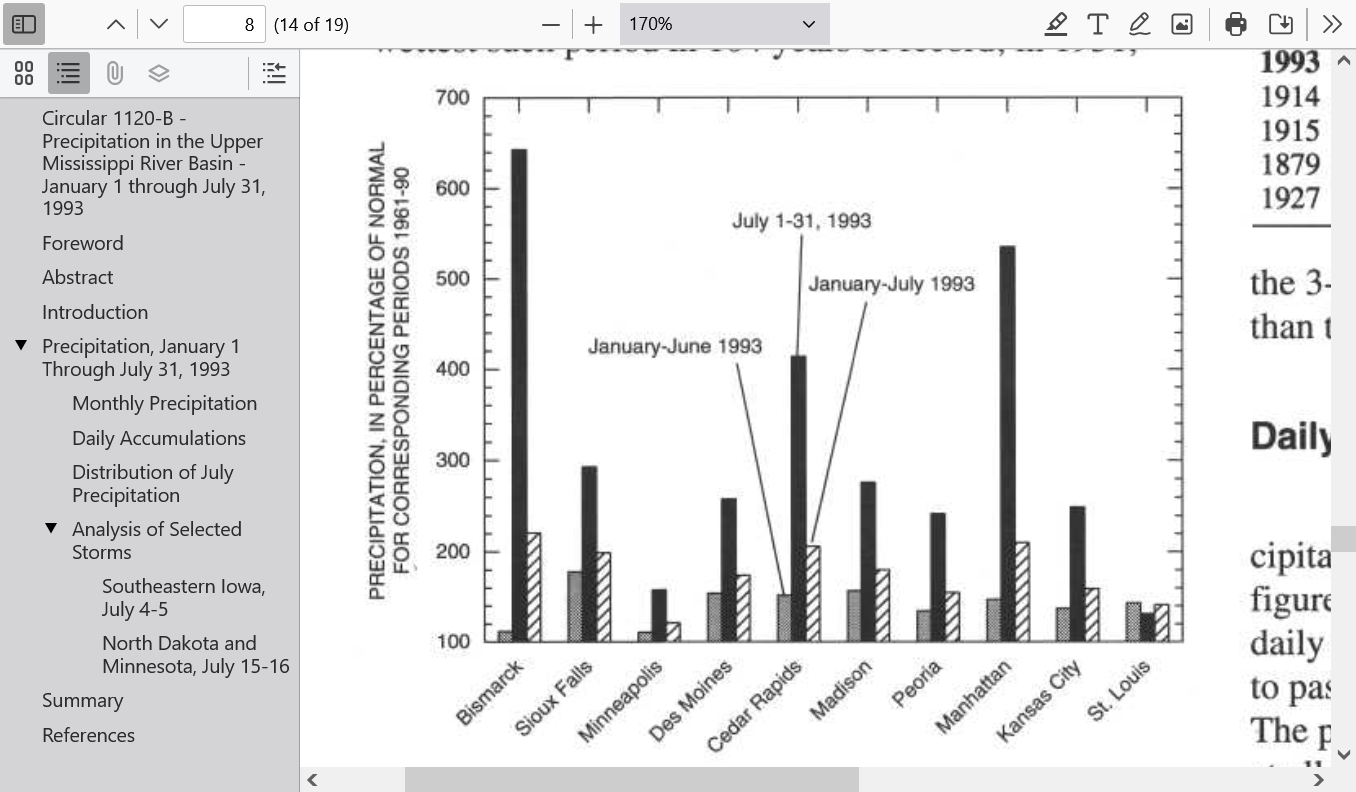
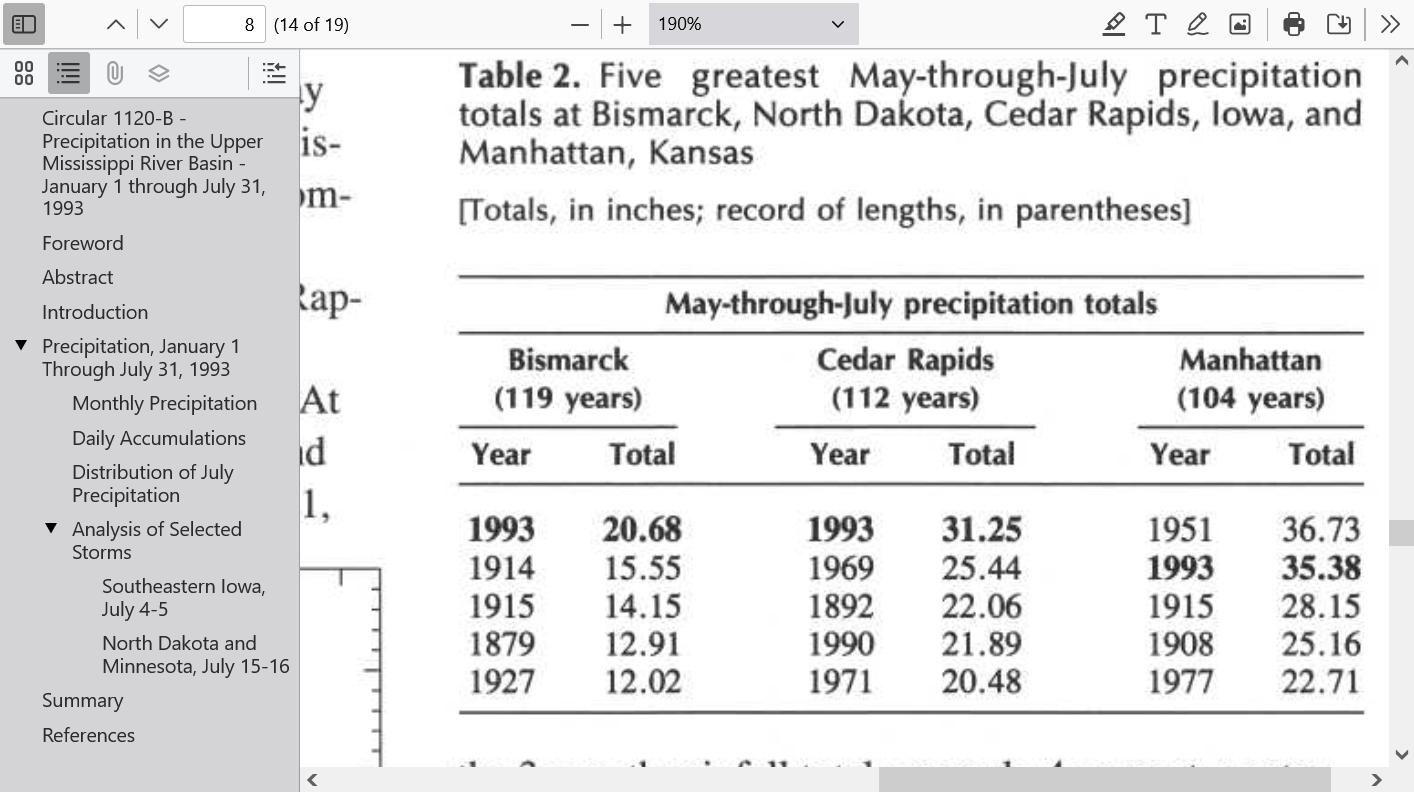
Almost never is there TOO MUCH rain but the year everybody remembers is 1993, just over 3 decades ago!
This is not even in the same league as 1993.
Interestingly, here along the Ohio River it was a hot//dry Summer with the heat ridge dominating that pumped up the moisture for making storms in the Upper Midwest.
https://pubs.usgs.gov/circ/1993/circ1120-b/pdf/circ_1120-b_a.pdf
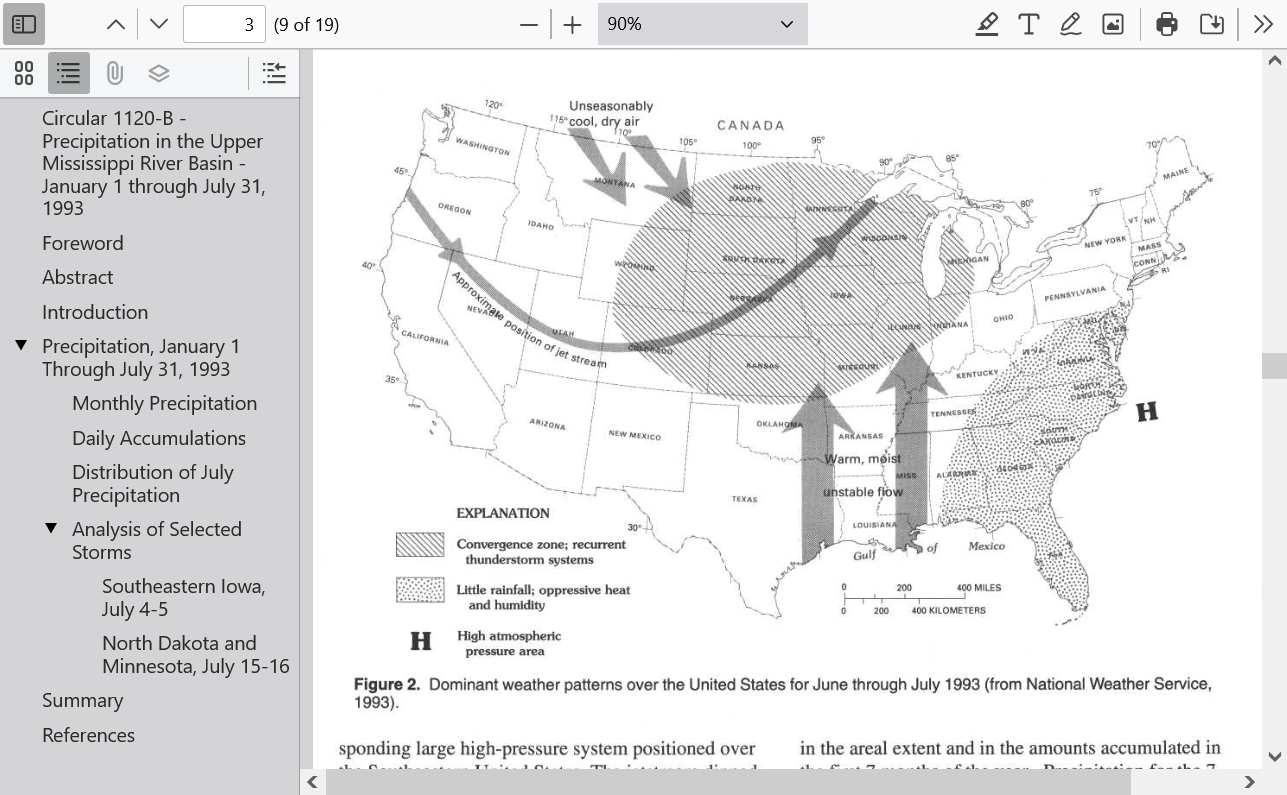
40 inches of rain from Jan-Jul 1993 in some places below:
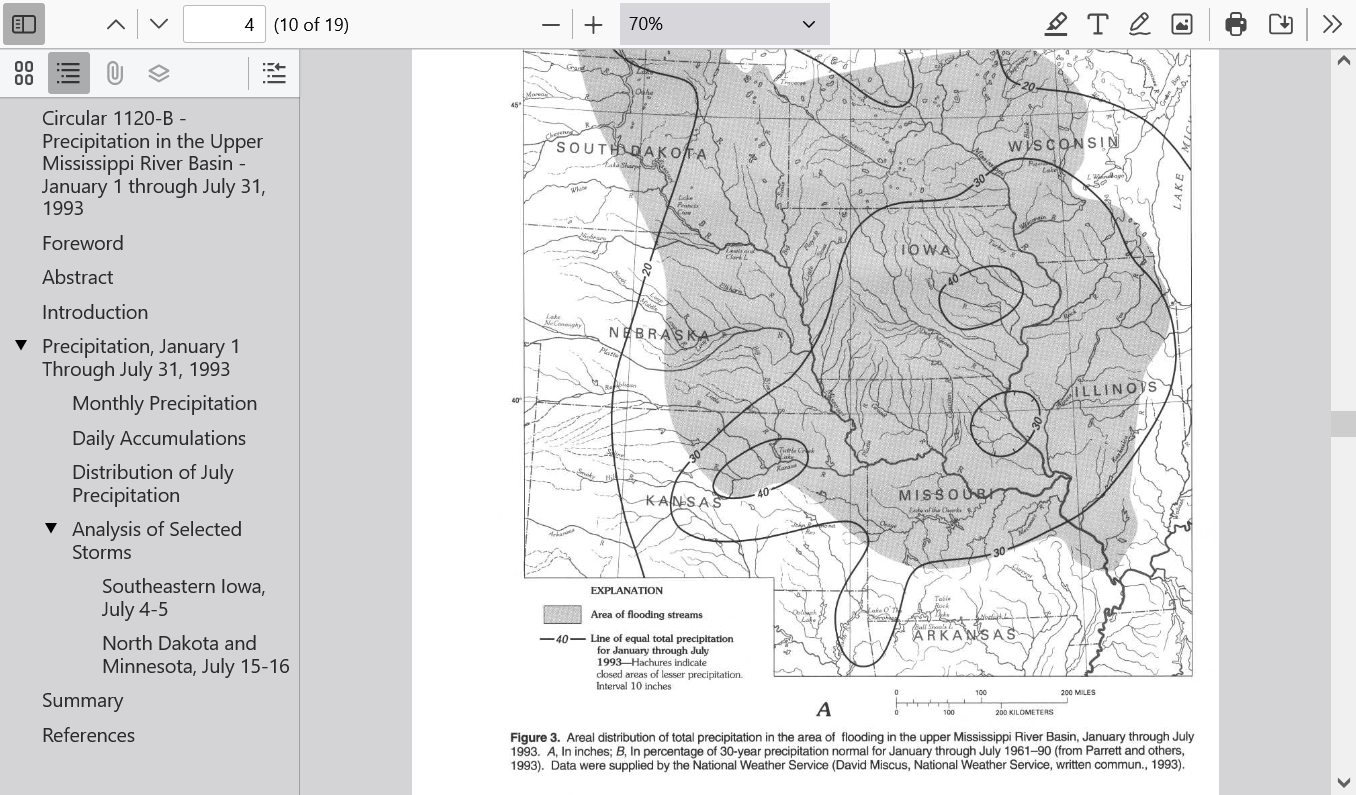
1993 obviously would not be an analog year because price soared HIGHER during July because of the excessive rains.,
2024 will be a year with potential analogs from very favorable conditions during the growing season.
We can make a case for excessive rains to cause leaching of nutrients, shallow roots and other negative factors but the bottom line is that we won't know until harvest if that impacted the crop when we see yields.
Until then, the market will do like it always does...........trade based on weekly crop ratings.
Crop ratings, especially for corn can be deceptive with wet and HOT years because the plants are green and healthy looking but heat fill causes tiny kernels from the accelerated maturity rate which cuts back on kernel filling time.
With another surge of cool air on track to hit the Midwest next week, heat fill is NOT going to be bullish trading item in August.
We should note that corn made new lows today because of that much cooler forecast:
| |||||||||
tjc,
In a typical, robust crop year like this, the market runs out of speculative sellers in early August, often after a bearish August crop report that increases production and results in a "selling exhaustion" where everybody that wants to be short is already in on news that everybody knows and is dialed into the price.
Then, often see a recovery for a month or so that used to be called "frost premium" especially in years when the crop is behind on maturity.
In recent decades, very favorable climate change to the Midwest has also greatly reduced the risk of an early freeze. There hasn't been a significant one in almost 3 decades.
We should also note that the increase in CO2 is also increasing crop yields/size.
Higher CO2 also assists plants exposed to drought and heat (closing the stomata more which reduces transpiration). Major drought is obviously not the problem this year.
Were the heavy rains increased by climate change?
Sure!
Instead of 10 inches of rain in a 2 month, the additional moisture in the air might be responsible for 10.6 inches of rain.
The vast, VAST majority of impacts on Midwest weather from climate change have been massively beneficial.
Anybody that states otherwise is completely weather/climate ignorant or dishonest. I'm getting worn out by all this nonsense, that includes the fake climate crisis!
DeathbyGREENING!
Started bymetmike - May 11, 2021, 2:31 p.m.
https://www.marketforum.com/forum/topic/69258/
+++++++++++++++++
Re: Re: National Climate Emergency??????????!!!!!!!!!!!
By metmike - June 20, 2024, 2:30 p.m.
Climate change made US and Mexico heatwave 35 times more likely
https://www.bbc.com/news/articles/czvvqdg8zxno
It's true that man caused climate change causes heat waves in some places to be 3 degrees F hotter than they would have been 100 years ago.
But they cherry pick, then exaggerate that fact in articles like this and NEVER, EVER tell the other side.
Winters have warmed the most and COLD STILL KILLS 10 TIMES MORE PEOPLE THAN HEAT!
The last 30 years or weather/climate/CO2 have been the best for life on this planet since BEFORE the Medieval Warm Period 1,000 years ago that was this warm.
In the Midwest SUMMERS, climate change has REDUCED EXTREME HEAT for instance.......though thats an exception, thanks to photosynthesis and evapotranspiration/higher dew points/moisture.
Summer Climate Change in the Midwest and Great Plains due to Agricultural Development during the Twentieth Century

1. We should note this rain forecast:
2. The difference between this pattern and the one in 1993 is that 1993 had a STALLED/BLOCKED pattern with SOUTHWEST flow that featured round after round of storms in the same spots because of a dome to the East that stopped the storms from progressing to the east to the bone dry Eastern Cornbelt.
3. This year, we have WEST/NORTHWEST flow around a dome which is PROGRESSIVE. It means more breaks between storm clusters and they move quickly in and out and don't sit on top of the same spots continuously for days.
July 1993 below-BLOCKED/STALLED-Dome in the Southeast/East

July 31, 2024-PROGRESSIVE, around the periphery of the dome in the SouthCentral US.

The forecast has turned drier but without intense heat in most of the Midwest:
2 week total rains from the last 0z GEFS:
7 Day Total precipitation below:
http://www.wpc.ncep.noaa.govcdx /qpf/p168i.gif?1530796126

Drier forecast continues. This was the last 0z European model. The colors stink but we still see the pattern. Dry IL/IN and points south. Wet(not excessive) Upper Midwest to S.Great Lakes. Excessive rains Southeast Coast from Debby.
Cooler temps keep this from being very bullish......at the moment.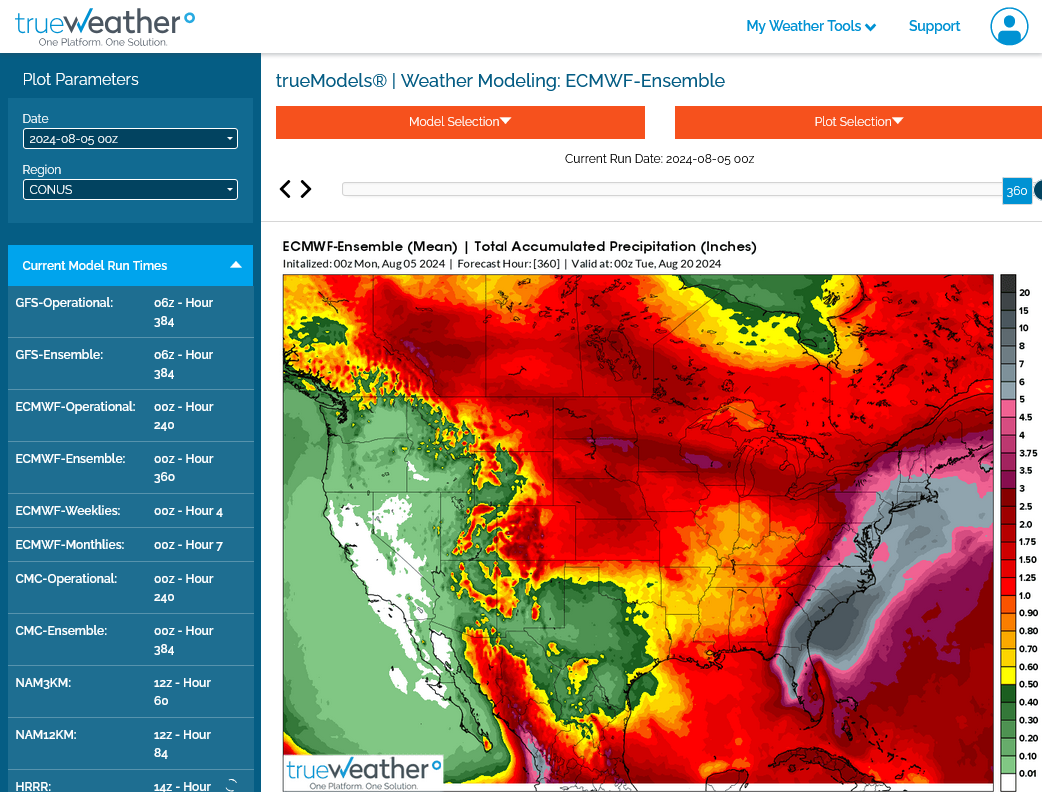
Crop ratings not much change:
-1% corn
+1% beans
-4% cotton with a +5% in the P/VP. That's pretty bullish but still +4% compared to 2023.
Total 2 week rains from the last 12z European model. Many areas of the Cornbelt will be on the dry side.
Mild temps the next week, then heating up.

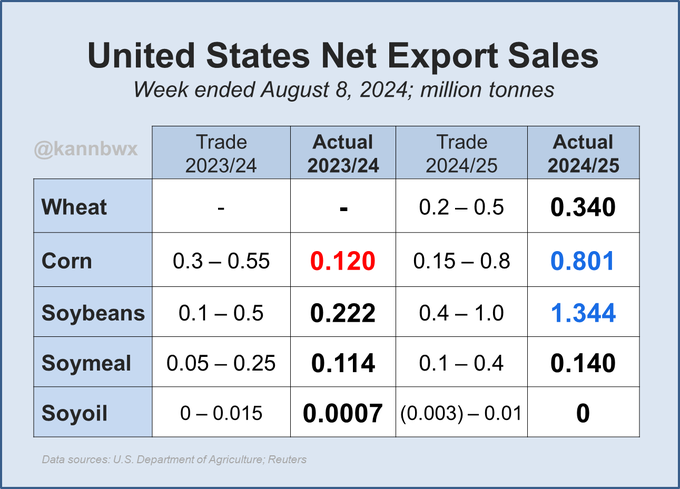
There has been virtually no bullish news for U.S. grains & oilseeds in the last several weeks (months?), but money managers have not materially changed their net bearish stance for over a month. CBOT corn, soybeans & soyoil set contract lows on Friday, soymeal did it Weds.
Money managers in the week ended Aug. 13 went from a net long in CBOT #soymeal fut&opt of 42k contracts to basically flat - the biggest weekly selloff since records began in 2006. Meal futures had plunged 8.4% on the week and then marked a 4yr low of $298.50/short ton on Weds.