NHC watching this one as the models all are developing this either in the Gulf or in the Bahamas weekend as of today’s 12Z runs:

Tropical Weather Outlook
NWS National Hurricane Center Miami FL
200 PM EDT Sun Jul 28 2024

For the North Atlantic...Caribbean Sea and the Gulf of Mexico:

1. Near the Leeward Islands and Greater Antilles:
An area of disturbed weather over the central tropical Atlantic
Ocean is expected to interact with an approaching tropical wave
during the next couple of days. Environmental conditions are
forecast to become conducive for some development thereafter, and
a tropical depression could form mid to late week while the system
is near or over the northern Leeward Islands, Greater Antilles, or
southwestern Atlantic Ocean.
* Formation chance through 48 hours...low...near 0 percent.
* Formation chance through 7 days...medium...40 percent.
Thanks much, Larry!
I hadn't been watching but, more often than not, you're the first to tip us off well before a major tropical system develops!
Here's the main page link for the NHC to get constant updates:
This is their 7 day outlook link, that you showed:
https://www.nhc.noaa.gov/gtwo.php?basin=atlc&fdays=7
https://www.nhc.noaa.gov/gtwo.php?basin=atlc&fdays=7
* Formation chance through 7 days...medium...60 percent.

Previous hurricane thread with WxFollower alerting us to Beryl BEFORE it became a hurricane:
Invest 95L headed to Caribbean: could become Beryl before
https://www.marketforum.com/forum/topic/105227/
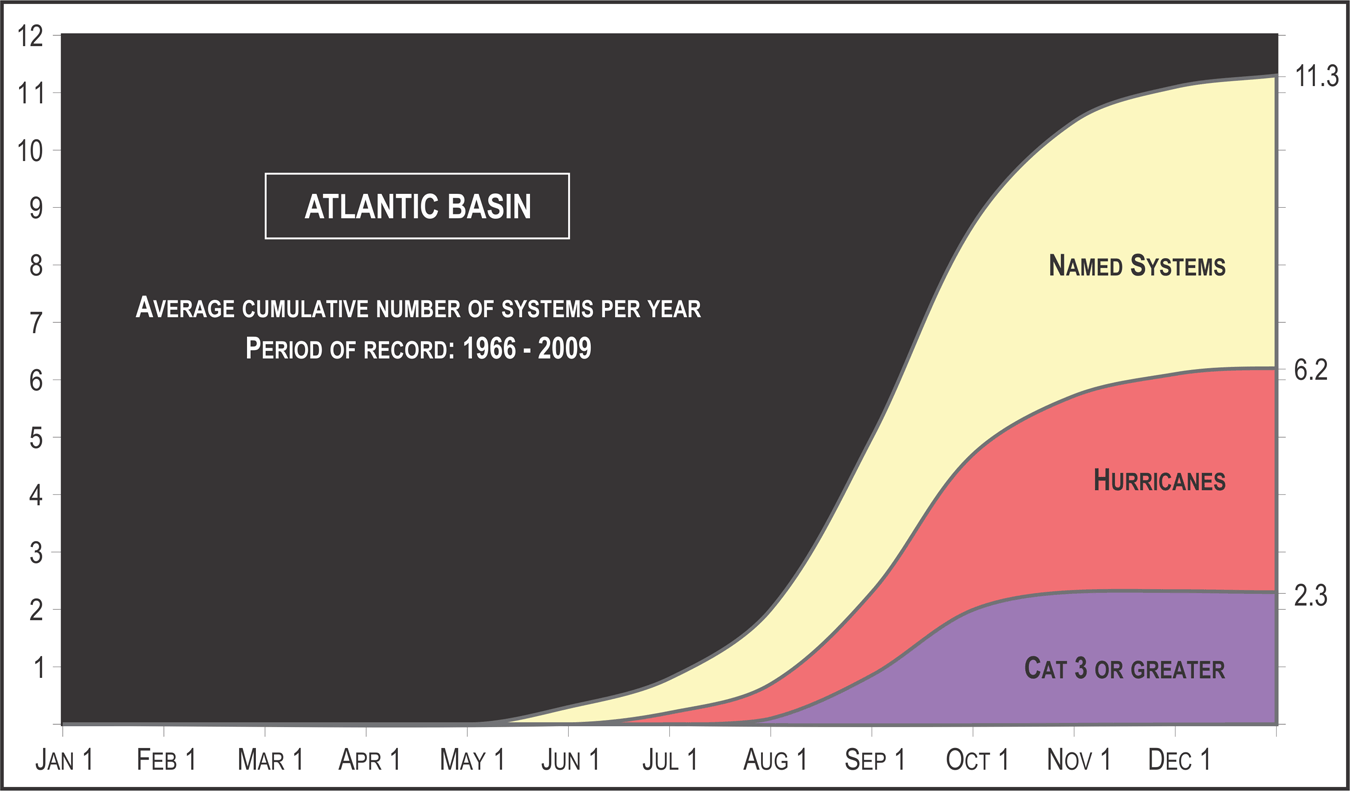
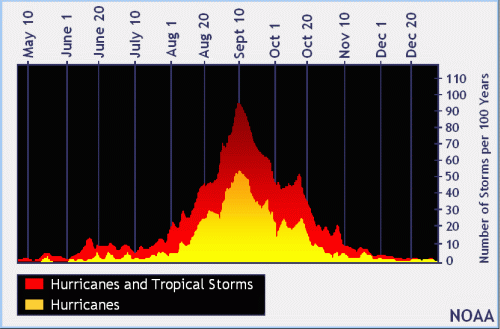
The figures below show the zones of origin and tracks for different months during the hurricane season. These figures only depict average conditions. Hurricanes can originate in different locations and travel much different paths from the average. Nonetheless, having a sense of the general pattern can give you a better picture of the average hurricane season for your area.
https://www.trackthetropics.com/hurricane-season-statistics/


Some extremely warm water in the Gulf of Mexico right now!!!
This increases the POTENTIAL for rapid intensification of tropical systems in that area:
https://www.ospo.noaa.gov/products/ocean/sst/contour/


https://www.thoughtco.com/celcius-to-farenheit-formula-609227
For example, to convert 26°C to °F (the temperature of a warm day):
°F = (°C × 9/5) + 32
°F = (26 × 9/5) + 32
°F = (46.8) + 32
°F = 78.8° F
Temps of around 26+ Deg. C or 79+ Deg. F are needed to produce the heat for a tropical system to develop/strengthen. The warmer the water, the faster the potential to strengthen.
+++++++++++++
31 C X 9/5 +32 = 87.8 Deg F
Much of the far Eastern Gulf of Mexico is this warm right now. Also off the far northern coasts.
Just because the water is very warm, does not mean a tropical storm will rapidly strengthen. Other conditions must be favorable. However, the models/forecasters have the lowest forecasting skill when tropical systems experience rapid intensification.
https://en.wikipedia.org/wiki/Rapid_intensification
Rapid intensification (RI) is any process wherein a tropical cyclone strengthens dramatically in a short period of time. Tropical cyclone forecasting agencies utilize differing thresholds for designating rapid intensification events, though the most widely used definition stipulates an increase in the maximum sustained winds of a tropical cyclone of at least 30 knots (55 km/h; 35 mph) in a 24-hour period. However, periods of rapid intensification often last longer than a day. About 20–30% of all tropical cyclones undergo rapid intensification, including a majority of tropical cyclones with peak wind speeds exceeding 51 m/s (180 km/h; 110 mph).

Hurricane Patricia's 54 m/s (190 km/h; 120 mph) 24-hour wind speed increase was the largest of any tropical cyclone on record.
| Category 5 major hurricane | |
|---|---|
| 1-minute sustained (SSHWS/NWS) | |
| Highest winds | 215 mph (345 km/h) |
| Lowest pressure | 872 mbar (hPa); 25.75 inHg (Record low in Western Hemisphere; second-lowest globally) |
+++++++++++
Hurricane Patricia(eastern Pacific) was the most powerful tropical cyclone on record worldwide in terms of maximum sustained winds and the second-most intense on record worldwide in terms of pressure, with a minimum atmospheric pressure of 872 mbar (hPa; 25.75 inHg), behind Typhoon Tip's 870 mbar(1979).
Both these storms were in the Pacific Ocean.
http://www.atmo.arizona.edu/students/courselinks/fall10/atmo336/lectures/sec2/hurricanes.html
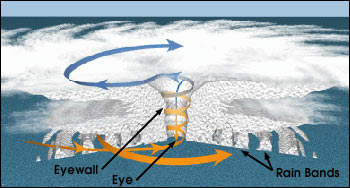
Structure of a hurricane:
Correlation between air pressure and wind speed:

++++++++++++++++++++++
https://www.aoml.noaa.gov/hrd/hurdat/All_U.S._Hurricanes.html
+++++++++++
Here are the 10 most intense hurricanes in U.S. history, as measured by central pressure, according to the National Oceanic and Atmospheric Administration (the lower the pressure, the more intense the storm).
The top 2 really stand out above all others with their intensity, especially the Labor Day Hurricane of 1935. .....BEFORE climate change!
The 1930's featured the most extreme weather in the United States recorded history by a very wide margin.
1. Florida (Keys) - 1935, 892 mb-89 years ago
2. Camille (Mississippi, Louisiana, Virginia) - 1965, 900 mb-59 years ago
3. Michael (Florida) - 2018, 919 mb
4. Katrina (Louisiana) - 2005, 920 mb
5. Andrew (Florida, Louisiana) - 1992, 922 mb
6. Texas (Indianola) - 1884, 925 mb
7. Florida (Keys) - 1919, 927 mb
8. Florida (Lake Okeechobee) - 1928, 929 mb
9. Donna (Florida) - 1960, 930 mb
10. Louisiana (New Orleans) - 1915; Carla (north and central Texas) - 1961; Ian (southwest Florida) - 2022, 931 mb
++++++++++++++++
Despite the warmer oceans and more tropical systems, we've NOT had an increase in the high end, land falling hurricanes in the United States.
Once again, Larry/WxFollower tipped us off about this system, a week before it becomes tropical storm Debby, possibly a weak cat. 1 Hurricane Debby!
The extremely warm waters, shown above with a low sheer environment in this area could cause rapid strengthening before it hits northwest Fl early on Monday.
https://www.marketforum.com/forum/topic/106248/#106344
+++++++++++++++++++++
NHC predictions:
https://www.nhc.noaa.gov/refresh/graphics_at4+shtml/094934.shtml?tswind120#contents


The FL West Coast will be on the RIGHT SIDE of the hurricane, which means its forward speed of around 15 mph will ADD to surface winds AND increase storm surge a bit.
https://www.unidata.ucar.edu/data/NGCS/lobjects/chp/structure/


Rainfall below

Thanks Mike!
The progged very heavy rainfall along and near the SE coast may be the biggest concern. Many of those areas have a very wet ground/high water table due to plentiful and well above normal PM convection the last 2 weeks.
Tropical Storm Debby!
Up to 90 mph on Monday Morning before making landfall and weakening. Heavy rains are the main threat, as Larry indicated.
https://www.nhc.noaa.gov/graphics_at4.shtml?start#contents

Excessive rain threat.
https://www.wpc.ncep.noaa.gov/qpf/excess_rain.shtml
Current Day 1 Forecast
Day 1 Threat Area in Text Format
Current Day 2 Forecast |
Day 3 outlook

Debby is now a minimal, cat. 1 hurricane. Should hit land Monday morning, then weaken in Florida.
BUT RESTRENGTHEN A BIT after it tracks back into the warm ocean, off the coast of Georgia.
https://www.nhc.noaa.gov/graphics_at4.shtml?start#contents
https://www.nhc.noaa.gov/refresh/graphics_at4+shtml/034938.shtml?tswind120#contents

https://www.nhc.noaa.gov/refresh/graphics_at4+shtml/034938.shtml?cone#contents

Temperatures are still warm enough off the Southeast Coast for the tropical system to use as strengthening fuel.
Nothing like the north/east Gulf.
https://www.ospo.noaa.gov/products/ocean/sst/contour/#ocean-43

https://www.cbsnews.com/news/hurricane-debby-florida-landfall/
Debby was expected to move eastward over northern Florida and then stall over the coastal regions of Georgia and South Carolina, thrashing the region with potential record-setting rains totaling up to 30 inches beginning Tuesday through Saturday morning. Flooding is expected to be especially severe in low-lying areas near the coast, including Savannah, Georgia; Hilton Head, South Carolina; and Charleston, South Carolina.
Savannah Mayor Van R. Johnson II told CBS News that Debby could unleash as much as 30 inches of rain in some areas in the coming days – an amount in many areas that "means obliteration," Johnson said, adding, "It is forecast to be a historic event for Savannah."
https://www.nhc.noaa.gov/refresh/graphics_at4+shtml/095139.shtml?rainqpf#contents


++++++++++++++
https://www.nhc.noaa.gov/graphics_at4.shtml?start#contents

Debby has strengthened a bit with slightly lower pressure's and is crawling along, at around 5 mph to the east(reason from extreme rains).
Debby has more circulation over the warm water now which is helping to slightly strengthen it to 60 mph and that may continue but be limited to a minimal hurricane threshold before hitting land again early Thursday.
https://www.spc.noaa.gov/exper/mesoanalysis/new/viewsector.php?sector=18#

https://www.nhc.noaa.gov/graphics_at4.shtml?start#contents

The predicted 1 in 1,000 year rainfall event from climate change............never happened.
Extremely heavy rains, yes but the hype and sensationalizing greatly exceeded the reality..........AGAIN!!
Some forecasters were calling for up to 30 inches of rain in the Savannah area.
https://www.weather.gov/chs/qpf


 https://climateknowledgeportal.worldbank.org/country/georgia/extremes
| Return Levels, Historical: 1985-2014 (center 2000) (mm) | ||||||||||||||||||
|---|---|---|---|---|---|---|---|---|---|---|---|---|---|---|---|---|---|---|
| Event | 5-yr | 10-yr | 20-yr | 25-yr | 50-yr | 100-yr | ||||||||||||
| 10th | median | 90th | 10th | median | 90th | 10th | median | 90th | 10th | median | 90th | 10th | median | 90th | 10th | median | 90th | |
| Historical | 26.43 | 35.07 | 45.49 | 29.86 | 39.86 | 51.59 | 33.23 | 44.51 | 58.21 | 34.30 | 46.02 | 60.33 | 37.64 | 50.55 | 66.78 | 40.98 | 55.16 | 73.65 |

++++++++++++++++++
Keep in mind the totals from Debby above are FOR MORE THAN 1 DAY!
https://www.reddit.com/r/MapPorn/comments/1cedt55/how_much_precipitation_fell_during_the_wettest/

++++++++++++++
So instead of a 1 in 1,000 year event, this might be more like a 1 in 30 year event CAUSED BY NATURAL VARIATION and slightly enhanced by the mostly beneficial climate change.
A place that got 15 inches of rain from Debby, might have only received 14 inches of rain 100 years ago before the beneficial global warming occurred. For every increase of 1 deg. C, the atmosphere can hold around 6-7% more moisture.
++++++++++++++++++++++++
It really boils down to this, once again(Cliff Mass can be counted on as an elite source for using objective, authentic science)
https://cliffmass.blogspot.com/2016/03/the-golden-rule-of-climate-extremes.html
The GoldenRule
Considering the substantial confusion in the media about this critical issue, let me provide the GOLDENRULE OF CLIMATE EXTREMES. Here it is:
The more extreme a climate or weather record is, the greater the contribution of natural variability.
Or to put it a different way, the larger or more unusual an extreme, the higher proportion of the extreme is due to natural variability.
For every degree Celsius that Earth’s atmospheric temperature rises, the amount of water vapor in the atmosphere can increase by about 7%, according to the laws of thermodynamics.
TORNADO WARNING
NATIONAL WEATHER SERVICE RALEIGH NC
221 AM EDT THU AUG 8 2024
THE NATIONAL WEATHER SERVICE IN RALEIGH HAS ISSUED A
* TORNADO WARNING FOR...
NORTHEASTERN WAYNE COUNTY IN CENTRAL NORTH CAROLINA...
SOUTHERN WILSON COUNTY IN CENTRAL NORTH CAROLINA...
* UNTIL 300 AM EDT.
* AT 220 AM EDT, A CONFIRMED LARGE AND EXTREMELY DANGEROUS TORNADO
WAS LOCATED 7 MILES NORTHWEST OF SNOW HILL, OR 12 MILES SOUTHWEST
OF FARMVILLE, MOVING NORTHWEST AT 30 MPH.
THIS IS A PARTICULARLY DANGEROUS SITUATION. TAKE COVER NOW!
HAZARD...DAMAGING TORNADO.
SOURCE...RADAR CONFIRMED TORNADO.
IMPACT...YOU ARE IN A LIFE-THREATENING SITUATION. FLYING DEBRIS
MAY BE DEADLY TO THOSE CAUGHT WITHOUT SHELTER. MOBILE
HOMES WILL BE DESTROYED. CONSIDERABLE DAMAGE TO HOMES,
BUSINESSES, AND VEHICLES IS LIKELY AND COMPLETE
DESTRUCTION IS POSSIBLE.
* THE TORNADO WILL BE NEAR...
EUREKA AROUND 225 AM EDT.
BLACK CREEK AROUND 235 AM EDT.
OTHER LOCATIONS IMPACTED BY THIS TORNADIC THUNDERSTORM INCLUDE
SARATOGA, LUCAMA, BLACK CREEK, EUREKA, AND STANTONSBURG.
PRECAUTIONARY/PREPAREDNESS ACTIONS...
TO REPEAT, A LARGE, EXTREMELY DANGEROUS AND POTENTIALLY DEADLY
TORNADO IS ON THE GROUND. TO PROTECT YOUR LIFE, TAKE COVER NOW! MOVE
TO A BASEMENT OR AN INTERIOR ROOM ON THE LOWEST FLOOR OF A STURDY
BUILDING. AVOID WINDOWS. IF YOU ARE OUTDOORS, IN A MOBILE HOME, OR IN
A VEHICLE, MOVE TO THE CLOSEST SUBSTANTIAL SHELTER AND PROTECT
YOURSELF FROM FLYING DEBRIS.
Thanks, Larry!
Many tropical systems can also cause tornadoes.
The Southeast United States, being on the left side of Debby has help to minimize that this time.
https://www.spc.noaa.gov/climo/reports/yesterday.html
Tornadoes yesterday in red: 3 in NC, including the one above in your post

Previous day/2 days ago: 0 tornadoes

3 days ago: 3 tornadoes in SC:

4 days ago: 5 tornadoes in FL, part of which was on the RIGHT side of Debby
TS Debby is weakening over land and still creeping along at around 5 mph. It will drop down to a depression later today and begin accelerating to the northeast, getting picked up by a trough in the Midwest after that.

https://www.nhc.noaa.gov/refresh/graphics_at4+shtml/115305.shtml?cone#contents


++++++++++++++++++++++
A question one can ask is whether they will be using the D name, Debby again in 6 years?
The NHC retires the names of noteworthy tropical systems, then uses a new name in 6 years for the letter of retired systems, keeping all the same letters for the majority of systems that were not significant.
I will guess that the NHC will retire Debby because of so much memorable hype for the rain in the Southeast but am not sure.
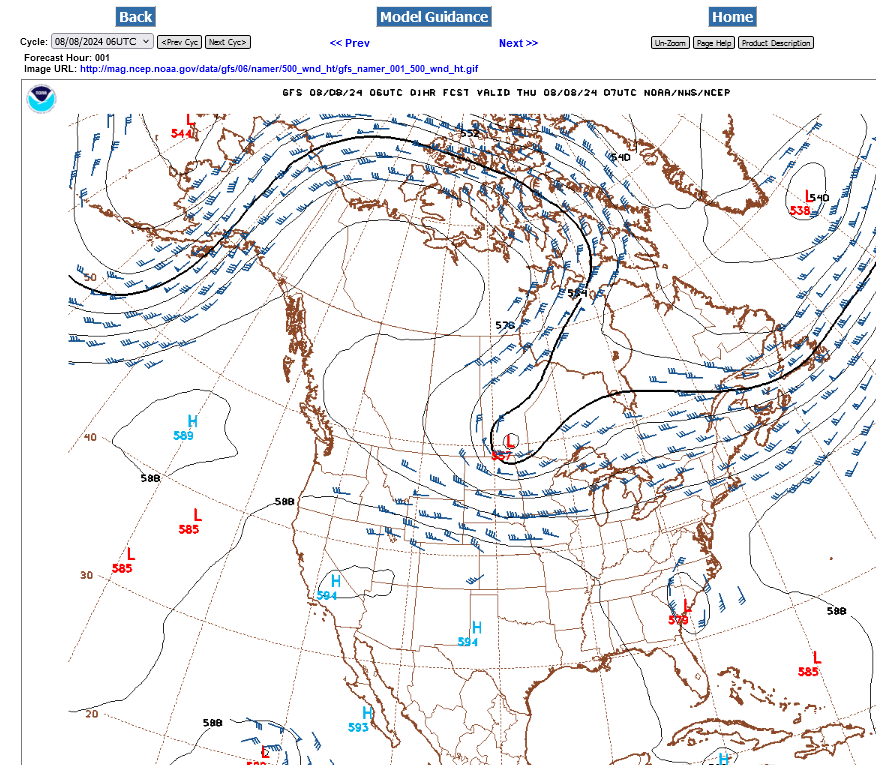
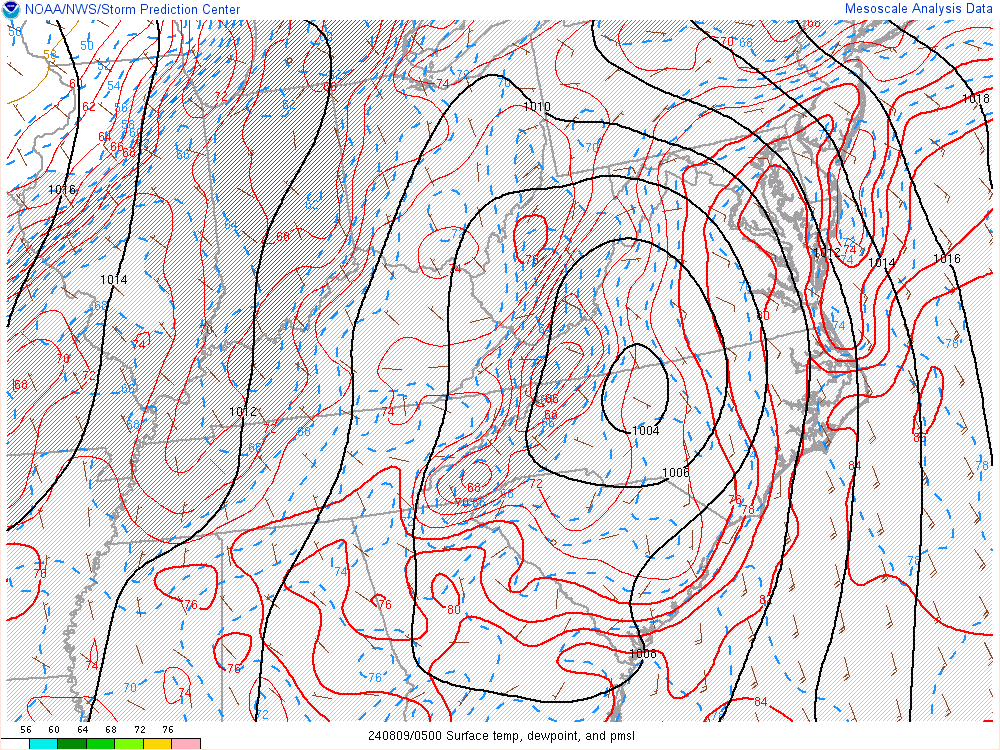
Current 500mb winds:
How high up is 500 mb??? 18,000+ feet, which is around 3.5 miles above the ground.
However in the Summer, with warmer air masses(less dense), this 500 mb pressure level exists closer to 20,000 feet. 500 mb is around the mid point of the atmosphere. Half above it, half below it. The half above it is much thinner and spread out much higher for an equal amount of atmospheric mass below it.
https://www.boqueteweather.com/millibars_altitude.htm
| Level | Standard Height | |
| 1000 MB | 364 ft | 111 m |
| 925 MB | 2498 ft | 762 m |
| 850 MB | 4781 ft | 1458 m |
| 700 MB | 9882 ft | 3013 m |
| 500MB | 18289 ft | 5576 m |
| 400 MB | 23574 ft | 7187 m |
| 300 MB | 30065 ft | 9166 m |
| 250 MB | 33999 ft | 10366 m |
| 200 MB | 38662 ft | 11787 m |
| [Boqueteweather.com] | ||
| Copyright © 2007 Boqueteweather.com | ||
+++++++++++++++
Watch the remnants of Debby get picked up by the approaching 500 mb trough below on the GFS model forecast maps thru the next 42 hours:
Lastest:
Later today:

Early Friday:
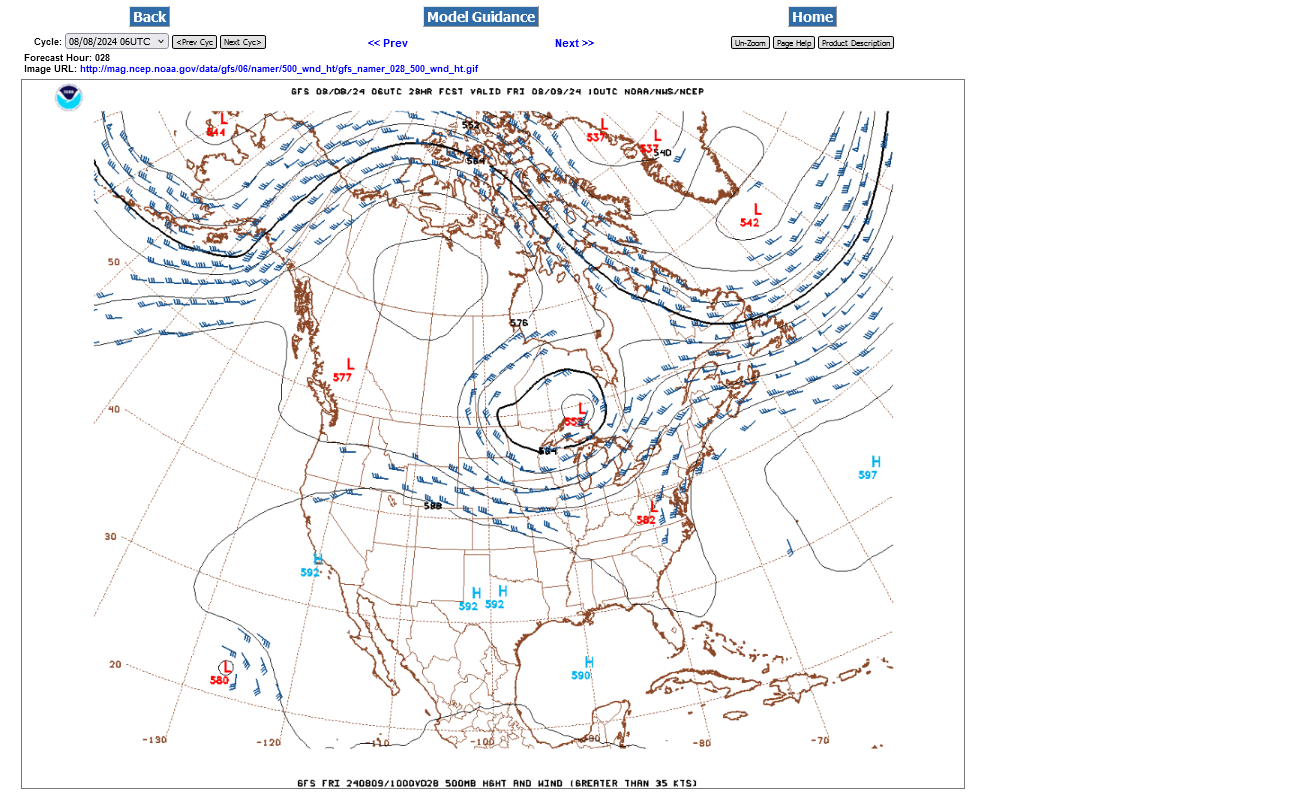
Friday Noon:

Friday Midnight/early Saturday:
Also note the HUGE Bermuda High in the Western Atlantic that's steering Debby north right now and blocking it from tracking east. Keeping it from being able to track back into the ocean, which is often the path a tropical system will take.
I know it is early in the hurricane season but. could this be a limiting factor IF it continues, to the number of nemed storms in the Atlantic.
Saharan Air Layer Tracking (daculaweather.com)
Absolutely this is a very important factor, cutworm.
Thanks especially because I almost always overlook it!!
Your link is a keeper to refer to during the entire hurricane season!
Saharan Air Layer Tracking (daculaweather.com)
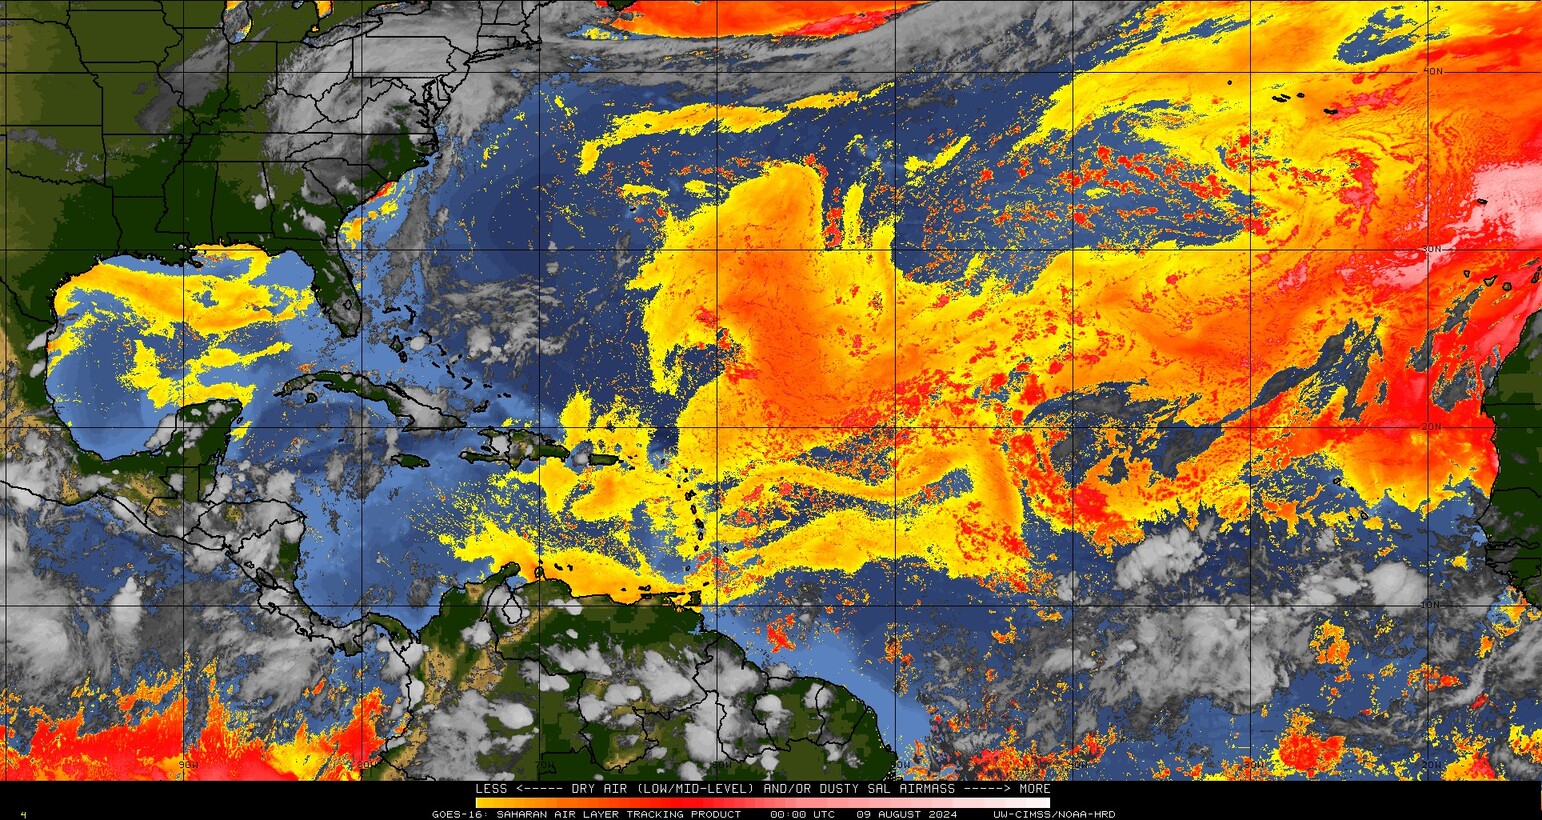
Saharan dust is a tricky factor.
Thick dust can suppress hurricanes by reducing solar heating of the ocean below but lighter amounts can INCREASE rainfall by acting similar to cloud seeding with silver iodide .......adding condensation nuclei to the air for water vapor to condense out on to and in the formation of ice crystals.
New research underscores the close relationship between dust plumes transported from the Sahara Desert in Africa and rainfall from tropical cyclones along the U.S. Gulf Coast and Florida.
https://news.stanford.edu/stories/2024/07/saharan-dust-regulates-hurricane-rainfall
Debby is now just a tropical depression at 30 mph.
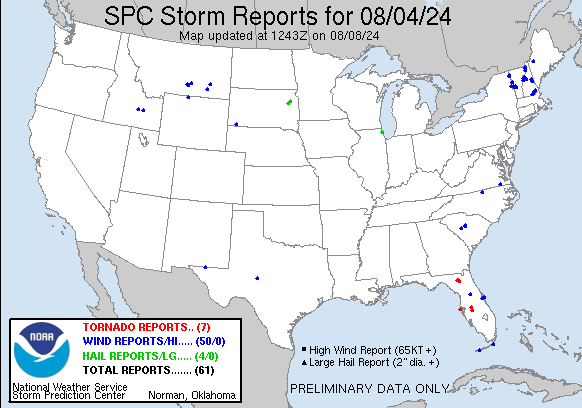
We had 7 more tornadoes today, with a larger land area on the RIGHT side of Debby.
https://www.spc.noaa.gov/climo/online/

https://www.nhc.noaa.gov/refresh/graphics_at4+shtml/044219.shtml?ero#contents


Severe Storm Risk......updated daily(days 1 and 2 twice daily).
Just a slight risk of severe weather in yellow.
https://www.spc.noaa.gov/


Tornadoes (weak) on the RIGHT side of Debby peaked at 9 on Thursday:
https://www.spc.noaa.gov/climo/reports/240808_rpts.html

1 tornado yesterday, 8-9-24

Debby has been absorbed into the east side of the upper level trough....no longer identifiable.