
Triple top level being tested a 4th time.
Typically, the market eventually breaks thru in the direction of the prevailing trend with that many tests.
Or that resistance level could be especially tough to get above.
Nothing is typical about many markets or the times right now.
+++++++++++
Previous gold thread:
GOLD dance!!!
45 responses |
Started by fays - June 6, 2024, 7:09 a.m.
Gold is another market with an unsustainable, irrational exuberance/speculative bubble price signature that features the price greatly exceeding the intrinsic value of the gold.
I've never traded gold and am not making predictions, despite the comment of this currently looking like a topping formation on the price charts.
1. 60 years Parabolic move higher with steepening slope of the curve/uptrend
2. 6 months 2300 strong support
3. 1 month
4. No way to know when this will end!
https://tradingeconomics.com/commodity/gold


If you adjust for inflation it looks less parabolic.
That's a great point, joj.
The chart pattern, if dialing in inflation and going back 15 years looks more like a wedge, with lower highs and higher lows.
From that perspective, we need to close above ~2520 to have an upside break out.........well above the life of contract highs of the inflation-less charts.
We've yet to break above the 2020, COVID highs but are close on the inflation adjusted chart. A failure here, would look like a triple top on the inflation adjusted chart.
1. 10 years
2. 55 years
3. Gold price, adjusting for inflation


OK, I found a really good one from another site that allows copying:
https://graphics.thomsonreuters.com/11/07/CMD_GLDNFLT0711_VF.html

2512 ish above close lead higher CAsh Gold --2885 by early year next year --!!
Will gold break out to the upside if, when Iran does a full-scale invasion????
Great question, cutworm!!
Or could we see buy the rumor, sell the fact?
Crazy world right now. Crazy markets!
Not sure how this site plots each time frame by they don't always match perfectly, like the imperfect match we see below. Regardless, if we close above ~2500 or so, the chart formation is an upside break out and potential for more upside.
But again, this parabolic move higher is unsustainable. That doesn't mean it will end soon or can't still go MUCH, MUCH higher.
1. 55 years
2. 1 month
https://tradingeconomics.com/commodity/gold


Gold breaking out to the upside this week! All time highs!
Recent sideways trading was just another bull flag temporary pause in the incredible move higher!
https://tradingeconomics.com/commodity/gold
1. 1 year chart
2. 55+ years


2512 break -----------------!!!dance
CNBC did an interview with ceo of Barrick. Says china demand is huge because their real estate and stock market are dead so they're haven buying.
2581 /2605ish if break 2515 on daily close --then some choppy reactions!!
Thanks for the positive contribution!
Agree with both you guys!
Uncharted, unprecedented territory!
1. Gold 1 year
2. Gold 55 years. WOW! Unsustainable, parabolic move up(steepening slope of uptrend). But with no way to know how long or how high it will go. A spike higher in this environment could exceed anything reasonable based on intrinsic value or what makes sense. Bubbles trade on irrational exuberance at times. .....EMOTIONS. If the world feels all hell is breaking lose everywhere from wars an economic instability........it can ramp up the safe haven emotions TO PANIC BUYING and shorts getting run over, turning into buyers at the market to reduce massive losses.
https://tradingeconomics.com/commodity/gold


Gold seems to have a wedge pattern on the daily chart, and near all-time highs. As mtp says which way will it break?
I see what you mean cutworm!
After breaking to all time highs on August 20th, Gold has paused with the wedge pattern you referred to.
The formation likely represents:
1. Another bull flag as a continuation pattern which has dominated gold trading in recent years. Confirmed when we have another upside break out, closing above the August 20 highs.
2. A potential, short term topping formation as we continue failing to get above the August 20 highs that have acted as brick wall resistance. Repeatedly rejecting numerous attempts to get above that level.
3. We should also note this wedge formation is featuring higher lows and slightly lower highs(this week) which makes it a classical wedge pattern. Very astute observation, cutworm.
https://tradingeconomics.com/commodity/gold

still 2512 is ---Dance is onnnn--!!
Yep, we're right at that price now.
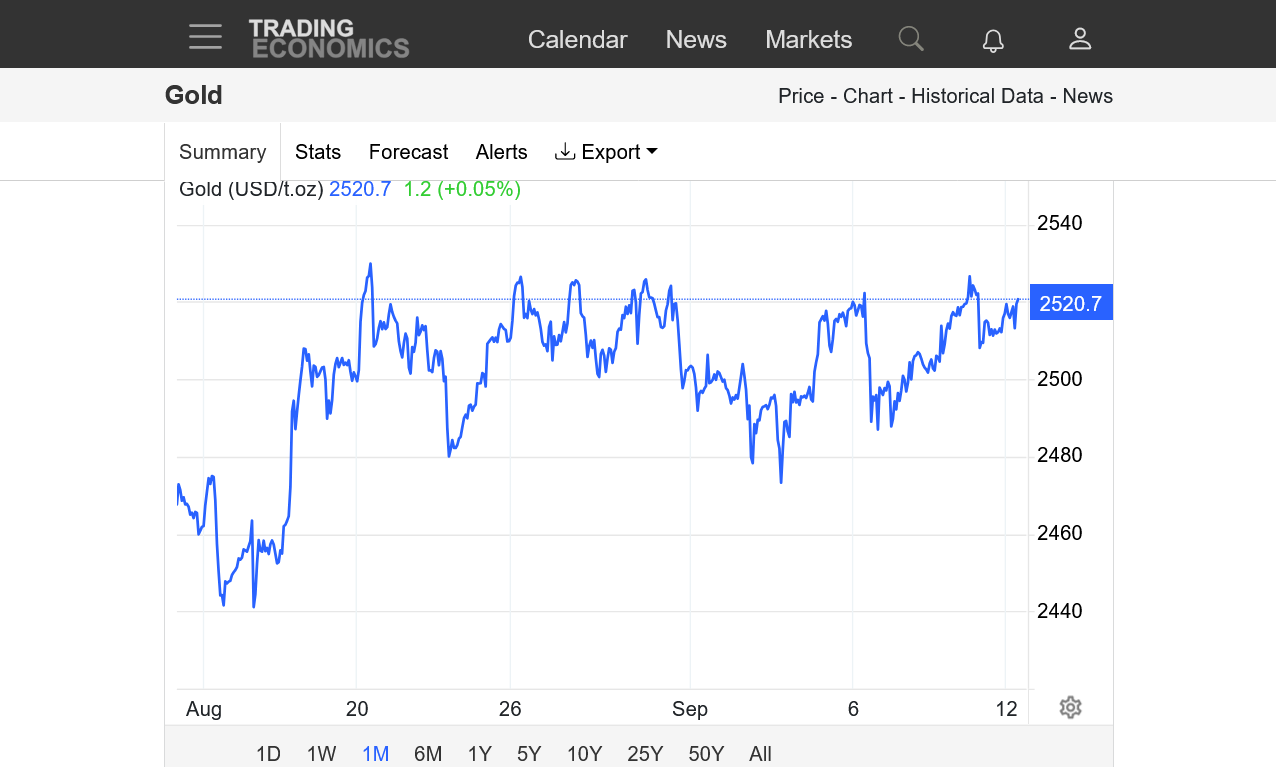
We've tested 2525, 5 times now in the last month and its been a brick wall but the fact that we keep coming back up to test it again, tells us that there's still plenty of underlying support after we fail to break thru and drop off a bit. History suggests that many tests mean its just a matter of time before we get ABOVE 2525 but it could just as easily be the final wall that gold can't climb over. With a parabolic, unsustainable move higher like this, the end often features extreme volatility and wild price spikes. Gold is incredibly quiet at these record high prices.
Maybe all the uncertainty from both sides? Maybe we need some especially crazy news about the wars or presidential election to fuel the next move. Or certainty about the result of the upcoming election.......which will put the losing side in a rage.
No predictions, just having fun doing the analysis!
https://tradingeconomics.com/commodity/gold

Gold is in a wedge pattern. When and which direction will it breakout.
Thanks much, cutworm.
Fascinating market. This is the technical formation that I feel we are etching out right now. It is a type of wedge and what I would call an ascending triangle or potential bull flag in a bull market/uptrend.
https://www.reddit.com/r/StockMarket/comments/107hkxh/reading_chart_patterns_ascending_triangle_and/

+++++++++++++++++
Here are the latest gold charts that illustrate this. Note the rising lower trendline but a flat upper trendline. The news will determine which way that we break but the formation is telling us that every time we try to sell off........ buyers are stepping in at higher and higher prices. But sellers have a line in the sand with extremely solid resistance. One would make the case that prices should break out in one direction before the price hits the apex of the triangle/wedge for it to remain valid. Prices are more likely to break to new highs based on the trends and formation.
Gold is also in a massive, unsustainable parabolic move higher long term. That could go on for years or end with a failure of this bull flag.
https://tradingeconomics.com/commodity/gold
1. 1 month
2. 6 months
3. 55 years
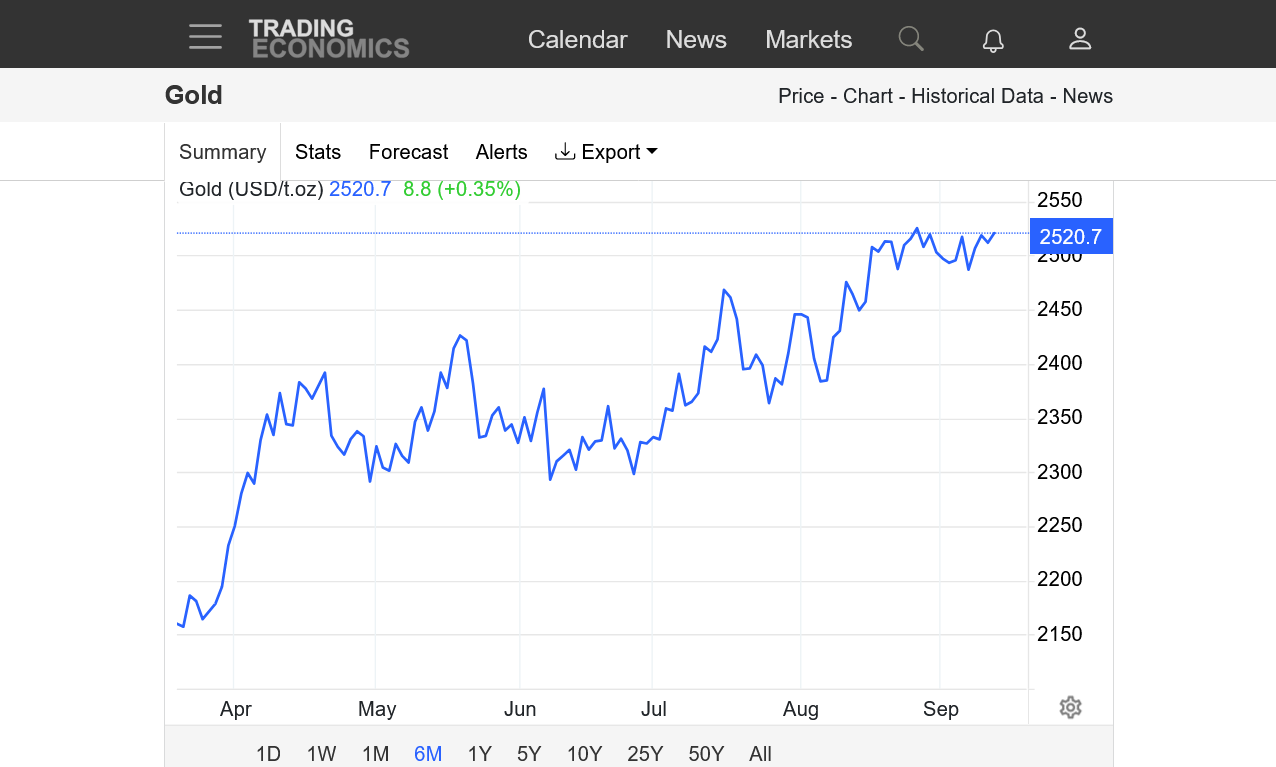

The upward trend continues, with a break to new all time highs yesterday.
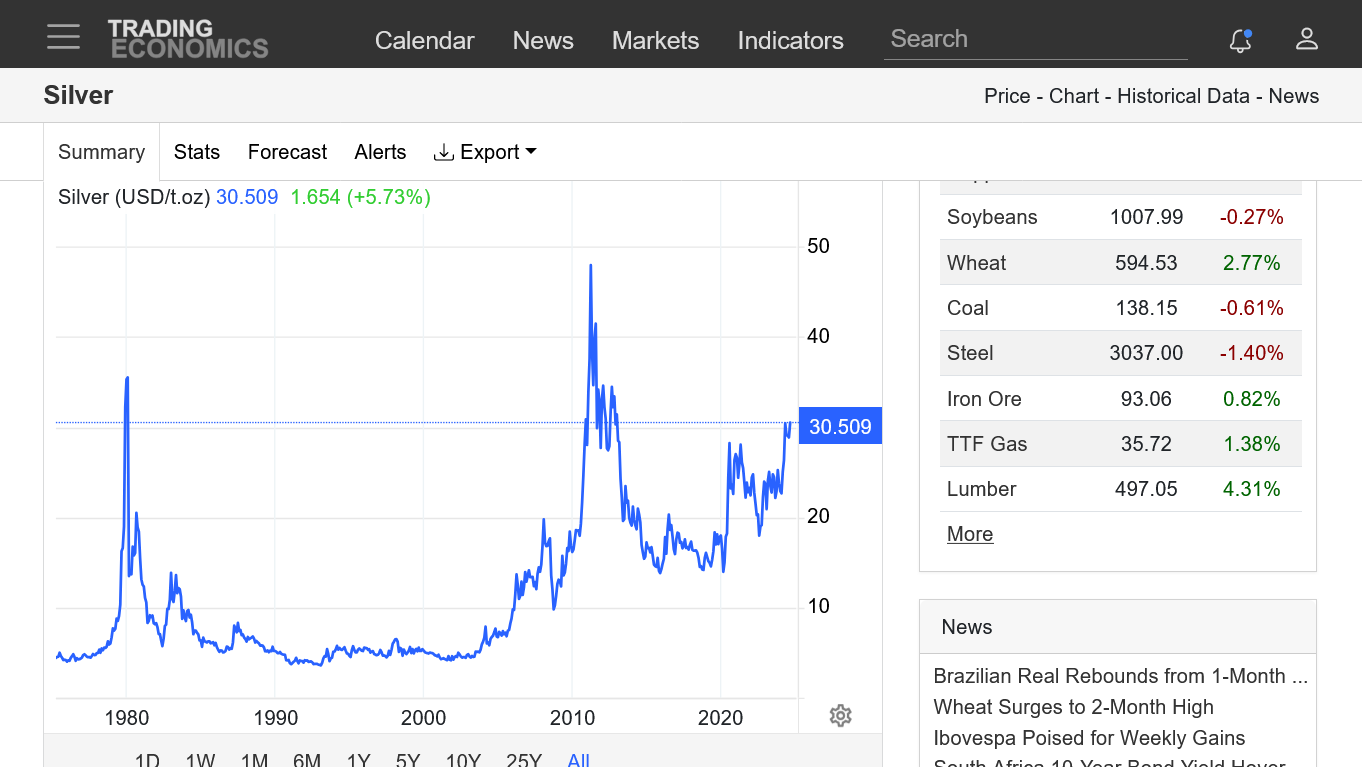
Silver while lagging gold for years, outperformed gold yesterday in percentage terms.
Looks like sliver is right at a downward sloping trend line. A break here would be bullish, and it looks like it will do that today???
Still a long way from the all-time highs.
Yes indeed, cutworm!
See the economic news that triggered this upside breakout at the link below. Weak economy, interest rate hike, weaker dollar./lower bond yields.
I counted 7 times that 2525 held gold back but we finally broke thru, confirming the bull flag, ascending triangle/wedge formation. Thanks for bringing this to our attention yesterday/today!!!! I would have completely missed it. 1 month below.
https://tradingeconomics.com/commodity/gold

Great point, joj and one that I'd likely never see because of not following this fascinating market.........unless you guys bring it up here.
cutworm,
Your take is the EXACT thing that immediately struck me when I looked at the updated 1 year silver chart!
Previous silver post:
https://www.marketforum.com/forum/topic/105493/#106380
Current silver:
https://tradingeconomics.com/commodity/silver
These charts don't always line up perfectly at different time frames but the source is free and wonderful, along with reliable news!
1. 1 month-NEW HIGHS
2. 1 year. Distinct bull flag that cutworm pointed out, with the top of the flag, drawn from May high to July high to current price.
3. 10 years. You can make out that bull flag formation.
4. 50 years. 1980 highs, then new all time highs in 2011 really stand out.


now stopped out t day high --2685 and mkt is going lower again my projection point 2602 and 2540 and on the high side ---!2702 possible if break above 2685=--- but i am stopped out ------------!!
