Got another buy signal on wednesday. So now over double the amount long.
Maybe it will do similar to last time. Got out at 35% and 15% profit
Then short june 28 till july 22 for around 40%.
Got stopped out of some at 10% profit and the rest for a 1% loss. Wait for the next signal.
thanks, baker..
Ng weather continues modestly bullish, along with the storage surplus shrinking from apparent production/supply cut backs.
Previous thread:
Natural Gas 6-2-24+
85 responses |
Started by metmike - June 2, 2024, 6:57 a.m.
https://www.marketforum.com/forum/topic/104476/
7 day temps for tomorrows EIA storage report at 9:30 am.
After last weeks bullish shocker...........only the 3rd Summer withdrawal in the last 3+ decades......this one should be much less bullish because of the much cooler weather from the Midwest to East Coast.
Still hot in the West and South.
https://www.cpc.ncep.noaa.gov/products/tanal/temp_analyses.php
As expected, less bullish.
However, we continue to erode the massive surplus. Note the blue line slowing sinking into the top of the 5 year average below.
https://ir.eia.gov/ngs/ngs.html
![]()
for week ending August 16, 2024 | Released: August 22, 2024 at 10:30 a.m. | Next Release: August 29, 2024
| Working gas in underground storage, Lower 48 states Summary text CSV JSN | |||||||||||||||||||||||||
|---|---|---|---|---|---|---|---|---|---|---|---|---|---|---|---|---|---|---|---|---|---|---|---|---|---|
| Historical Comparisons | |||||||||||||||||||||||||
| Stocks billion cubic feet (Bcf) | Year ago (08/16/23) | 5-year average (2019-23) | |||||||||||||||||||||||
| Region | 08/16/24 | 08/09/24 | net change | implied flow | Bcf | % change | Bcf | % change | |||||||||||||||||
| East | 735 | 723 | 12 | 12 | 727 | 1.1 | 676 | 8.7 | |||||||||||||||||
| Midwest | 888 | 869 | 19 | 19 | 826 | 7.5 | 790 | 12.4 | |||||||||||||||||
| Mountain | 263 | 260 | 3 | 3 | 205 | 28.3 | 185 | 42.2 | |||||||||||||||||
| Pacific | 288 | 287 | 1 | 1 | 241 | 19.5 | 262 | 9.9 | |||||||||||||||||
| South Central | 1,125 | 1,125 | 0 | 0 | 1,078 | 4.4 | 1,017 | 10.6 | |||||||||||||||||
| Salt | 280 | 286 | -6 | -6 | 263 | 6.5 | 245 | 14.3 | |||||||||||||||||
| Nonsalt | 845 | 839 | 6 | 6 | 815 | 3.7 | 772 | 9.5 | |||||||||||||||||
| Total | 3,299 | 3,264 | 35 | 35 | 3,078 | 7.2 | 2,930 | 12.6 | |||||||||||||||||
Totals may not equal sum of components because of independent rounding. | |||||||||||||||||||||||||
Working gas in storage was 3,299 Bcf as of Friday, August 16, 2024, according to EIA estimates. This represents a net increase of 35 Bcf from the previous week. Stocks were 221 Bcf higher than last year at this time and 369 Bcf above the five-year average of 2,930 Bcf. At 3,299 Bcf, total working gas is within the five-year historical range.
For information on sampling error in this report, see Estimated Measures of Sampling Variability table below.

Note: The shaded area indicates the range between the historical minimum and maximum values for the weekly series from 2019 through 2023. The dashed vertical lines indicate current and year-ago weekly periods.
+++++++++++
Responding to the latest storage print for the week ended Aug. 16, natural gas futures moved lower Thursday as a relatively large injection foiled the recent pace of tightening supply.
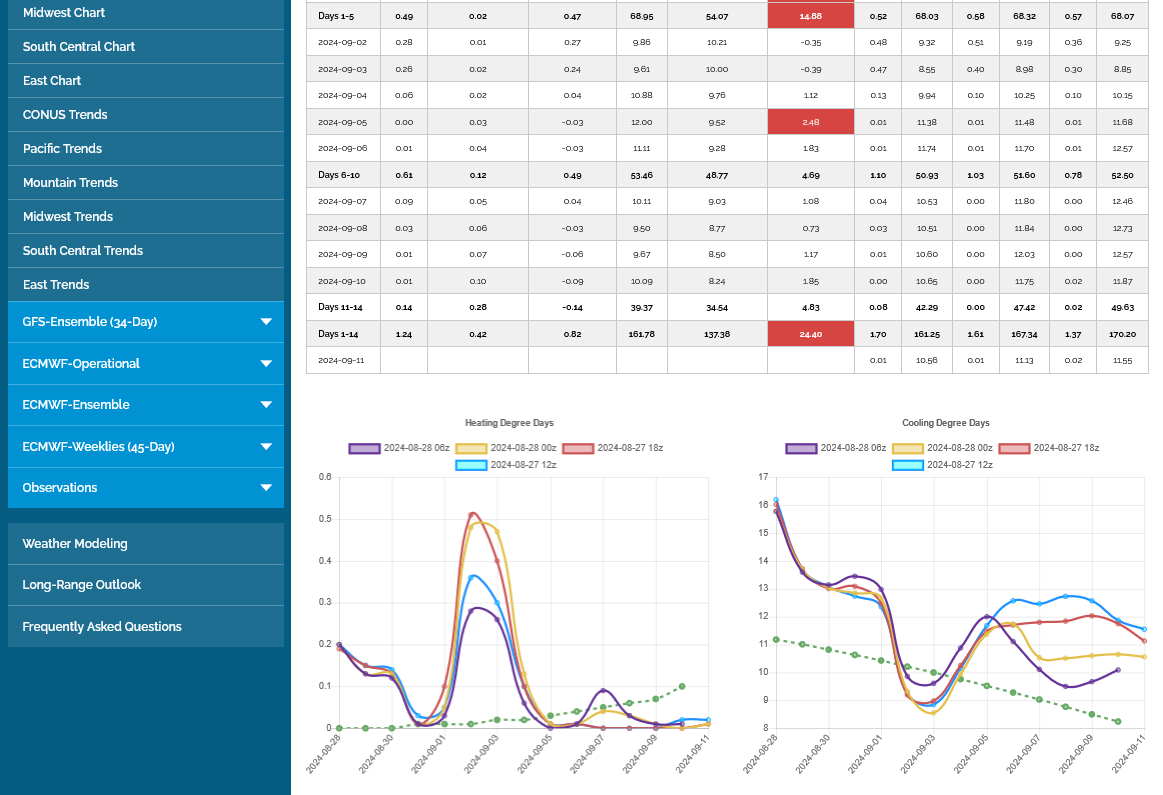
The weather models continue with the cooler trend for the 3rd day in a row which has been putting pressure on ng prices. Cooler weather in the cooling season means lower AC use. NG is burned to generate electricity for air conditioning.
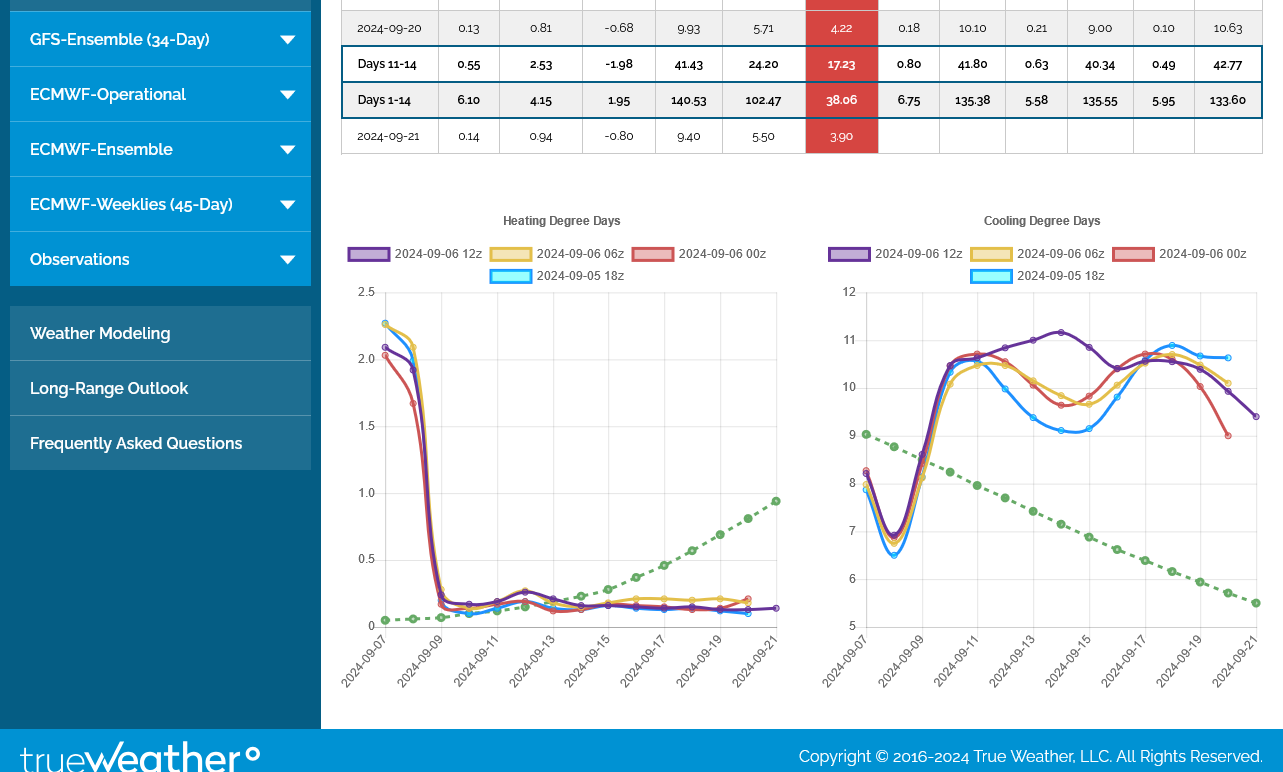
These were the last 4 GEFS CDDs(right) with purple being the last, still coming out 12z run.
This current spike higher in CDDs was dialed in early in the week. Since then, the market has been trading the drop in CDDs which is actually a bit faster than the slow seasonal drop seen with the dashed green line. By the end of the 2 week period. CDDs are almost but not quite down to average. There will be significant cooling in the Midwest again, similar to much of this Summer.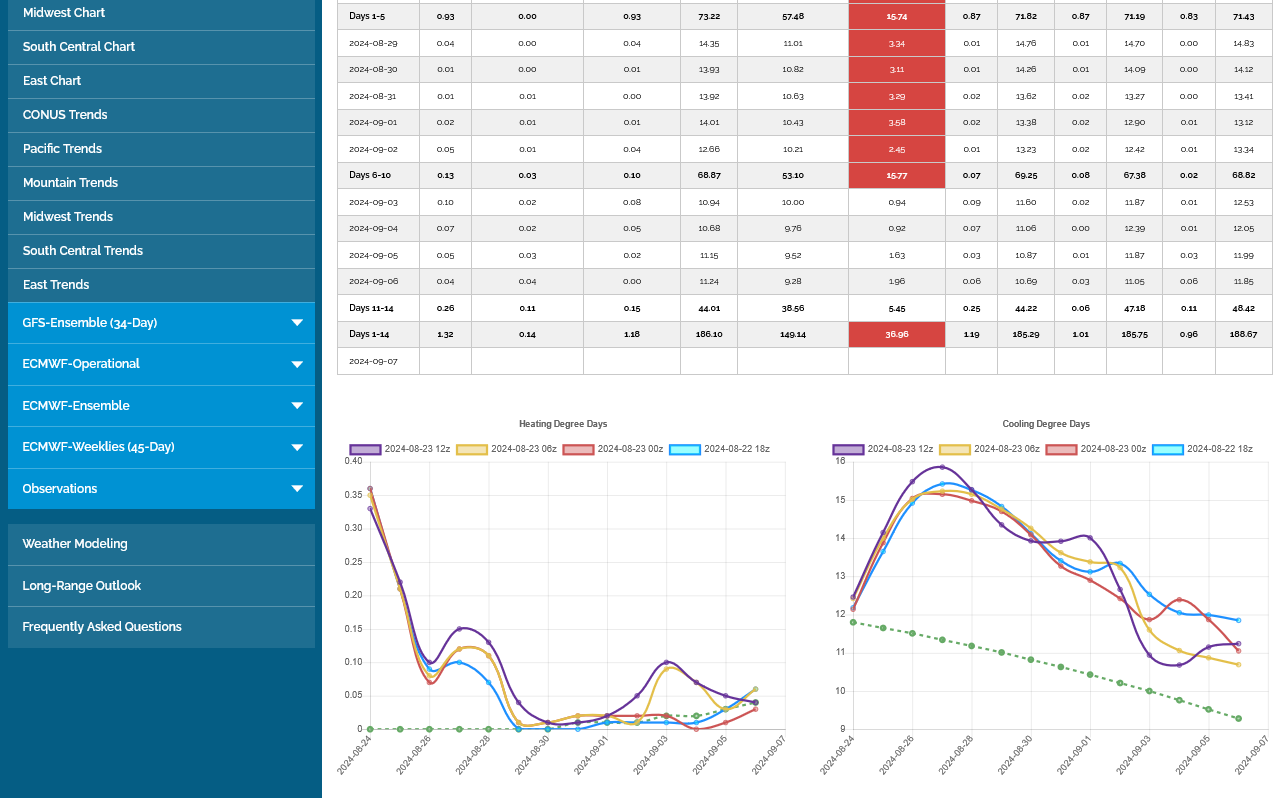
Still out, no buy signal this week.
But there was a sell signal this week if one wanted to be short on an aggressive signal.
NG back below $2. Pretty amazing!
Still think that an impending recession and industrial demand losses must be a factor for us to be this low and going lower at this time of year.
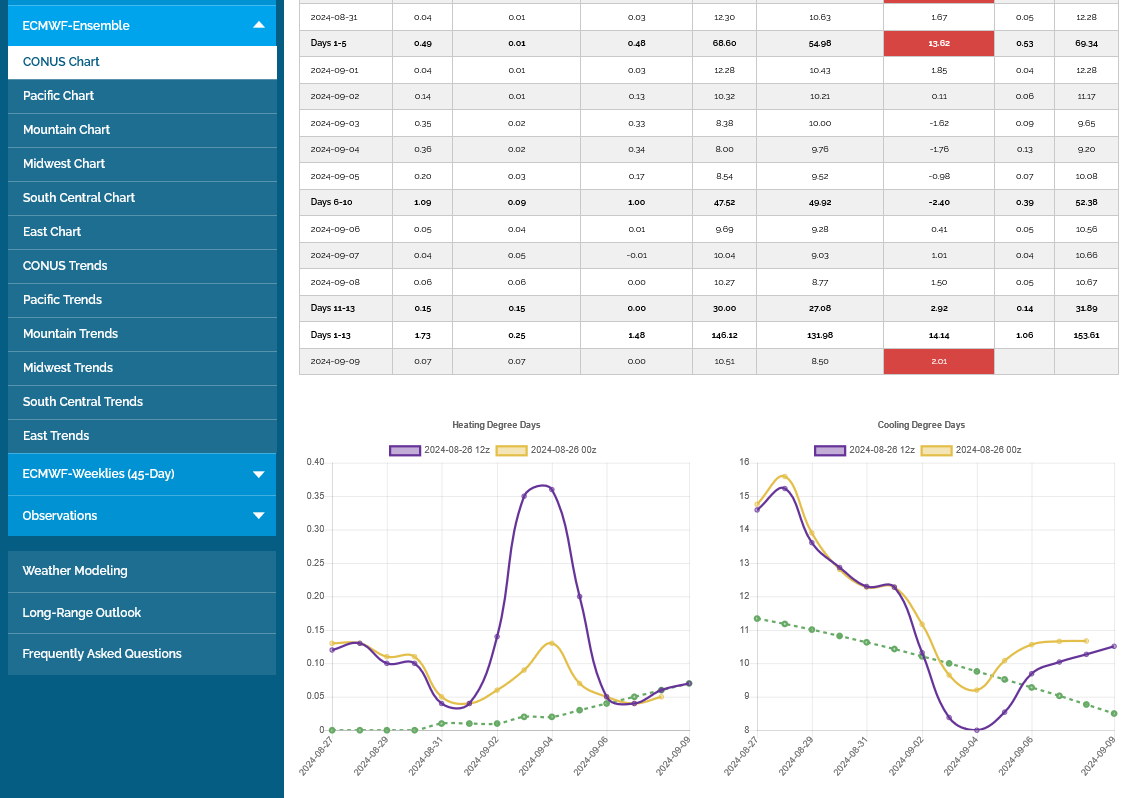
Of course the BIGGEST ONE right now is that the forecasts keep getting less and less hot, now cooler and cooler.
The last 0z European model in purple on the right was another -3 CDDs vs the previous 12z run. Temps even drop BELOW the historical average briefly(slowly dropping green line)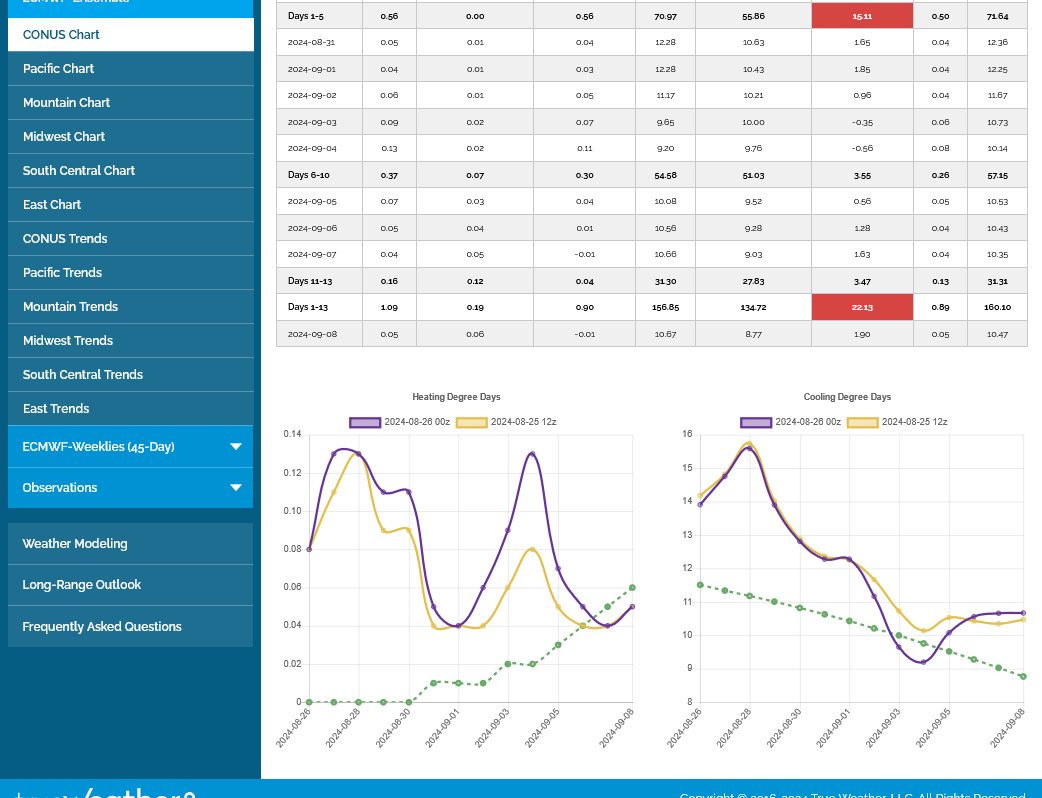
The last 12z European model was a whopping -7.5 CDDs! Bottom/right in purple.
Hey Mike,
Did that lead to NG dropping when or soon after it was coming out?
Larry,
Great question. I was going to mention that the market had its been plunge lower much earlier in the day, almost as if it was anticipating this in the early afternoon.
Overnight, the 0z European model was similar to the previous cooler 12z run but the last 0z GEFS was -3 CDDs vs the previous 18z run, which was -2.5 CDDs vs the previous 12z run, which was -6 CDDs vs the previous 6z run for a total of -11.5 CDDs over the last 3 runs.
++++++++++++++++++++
1. 1 day-that price of $2 was at 9am, Monday with a $500/contract spike lower before 10am(in less than an hour). When the bearish 12z European model came out in the afternoon, there wasn't a strong price move. The price tonight has continued the weakness with the GEFS, shown above especially cooling off more.
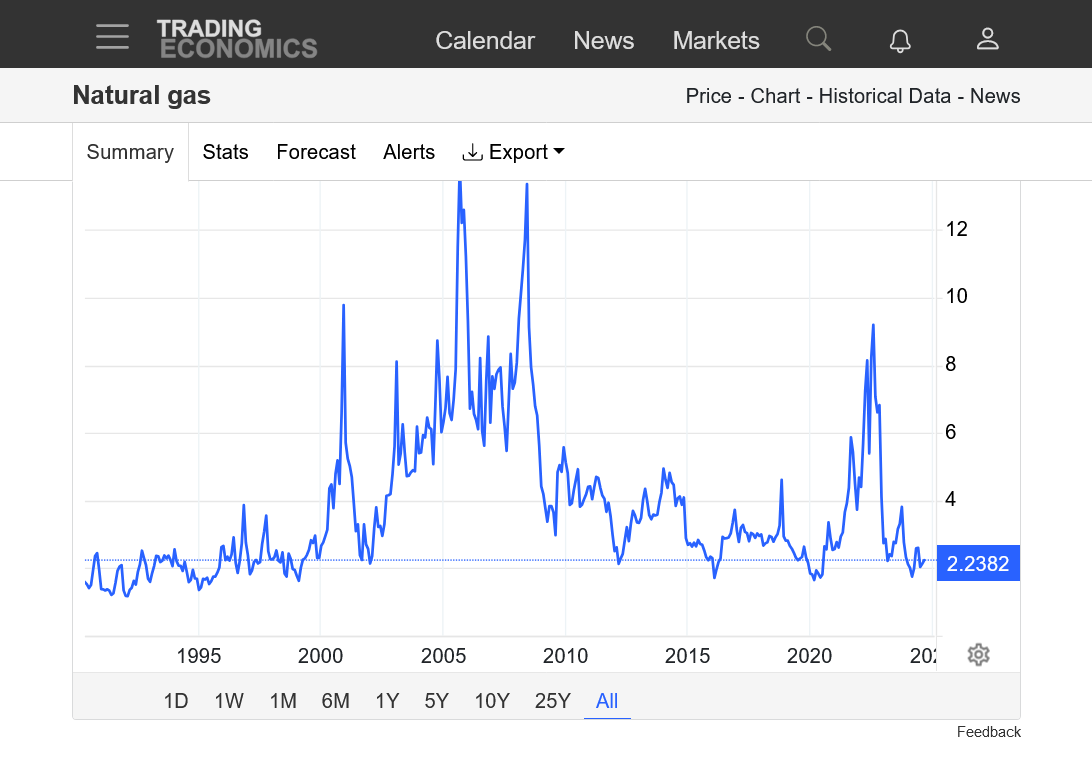
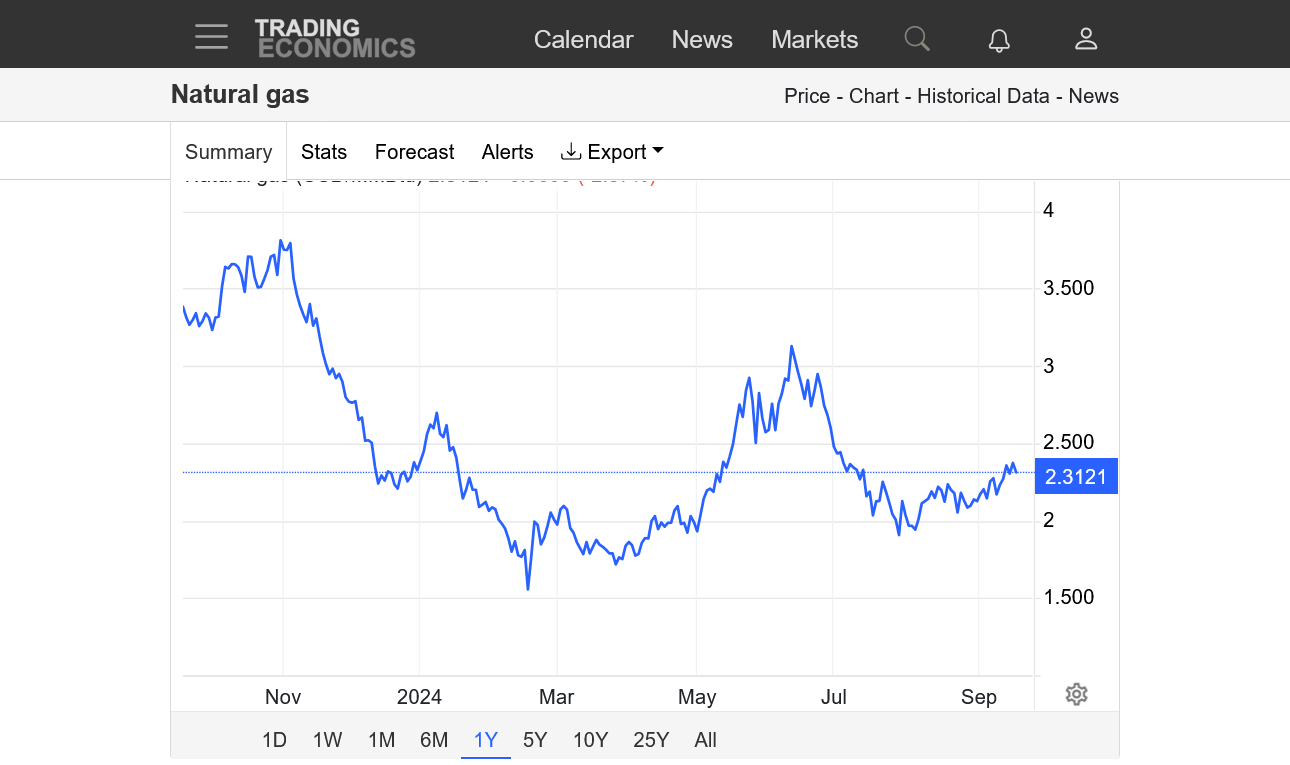
2. 1 month-testing the lows from a month ago
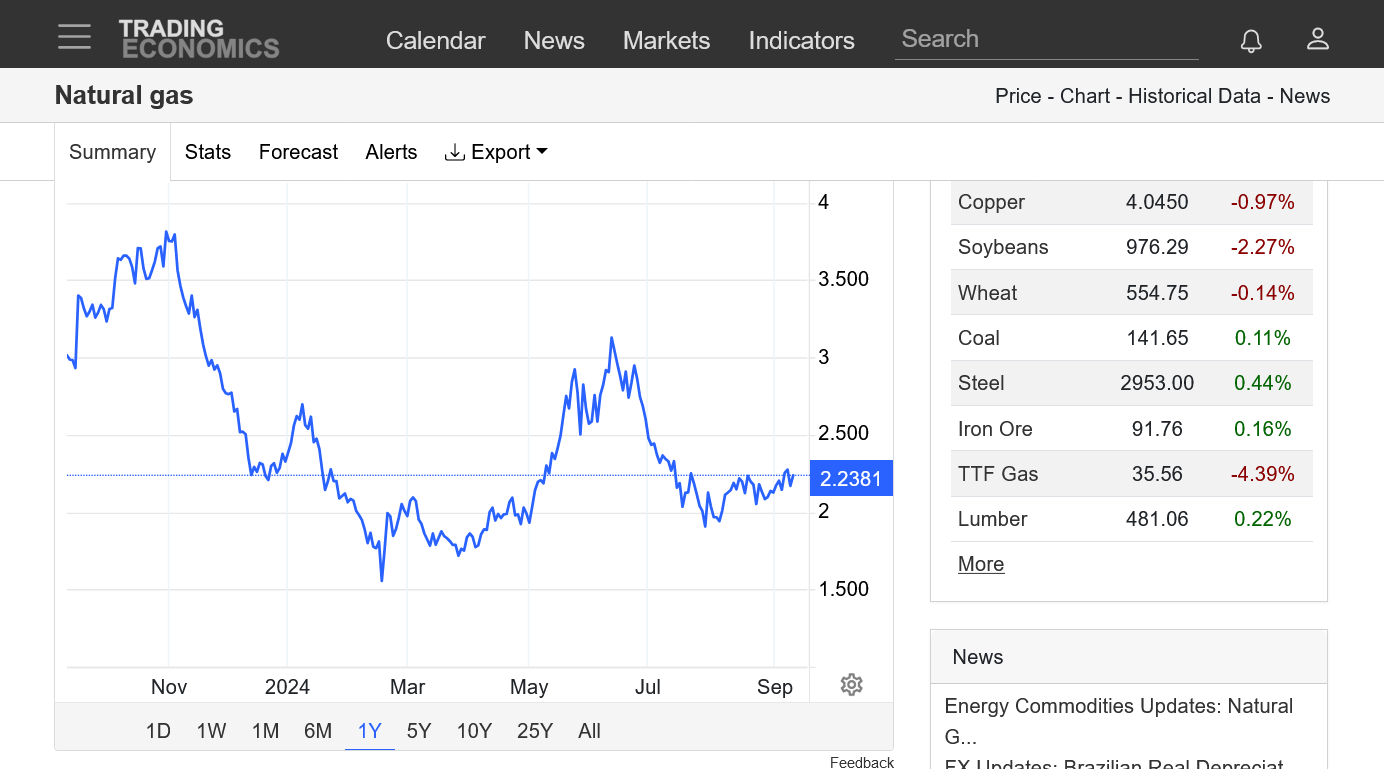
3. 1 year-still above the Spring lows
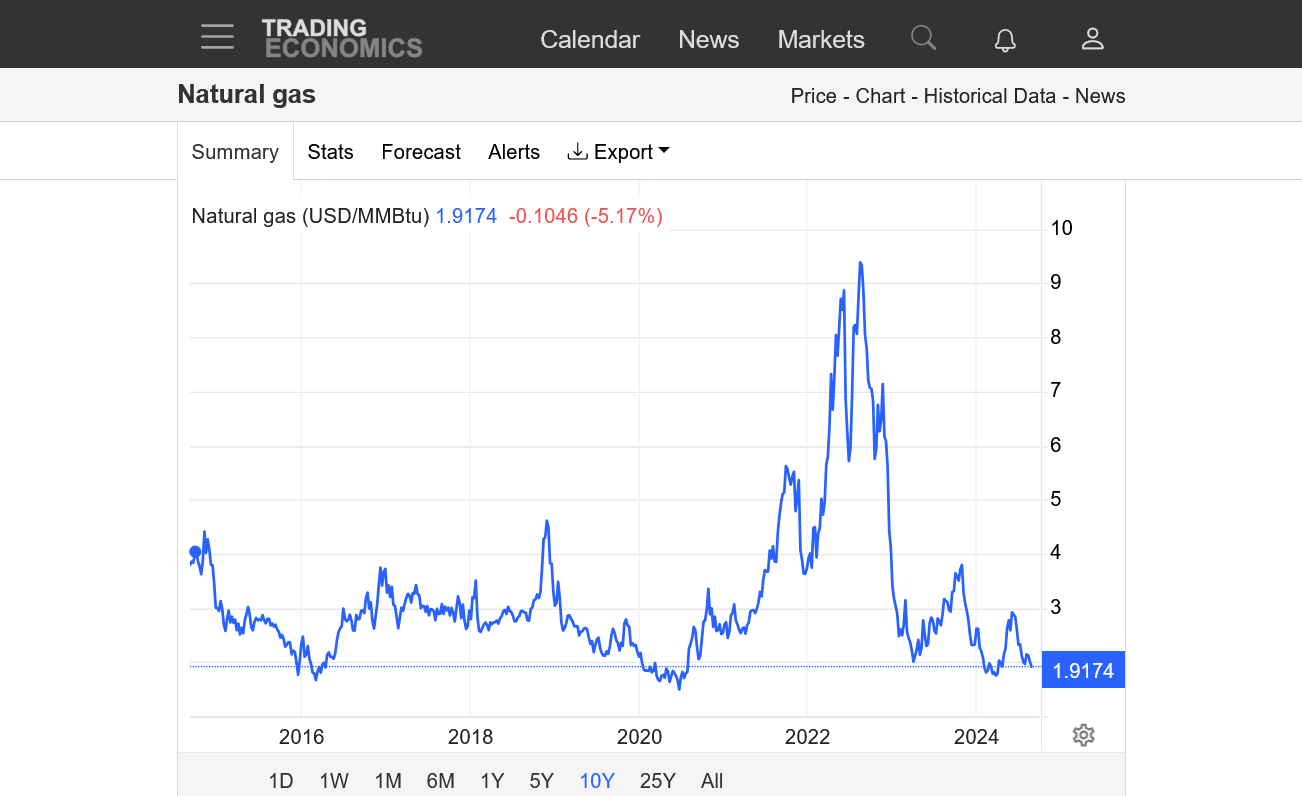
4. 10 years-not far from COVID lows
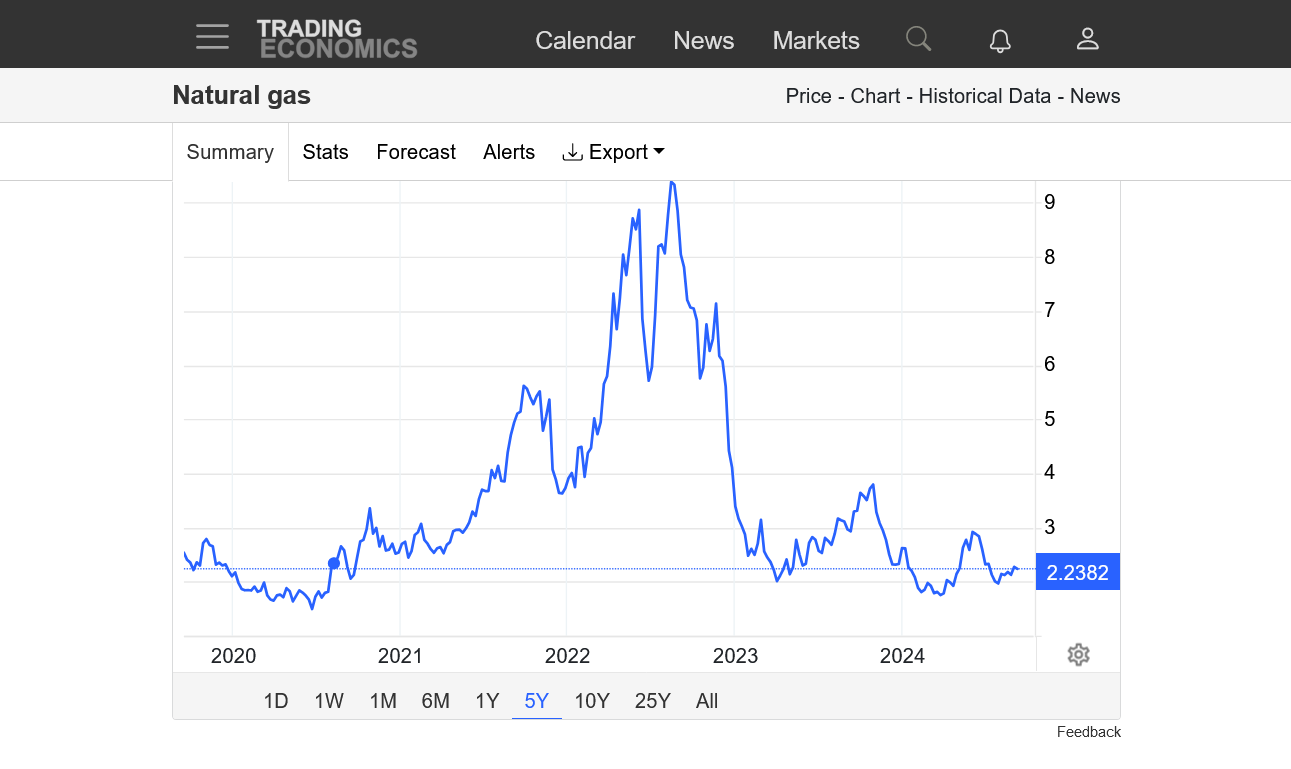
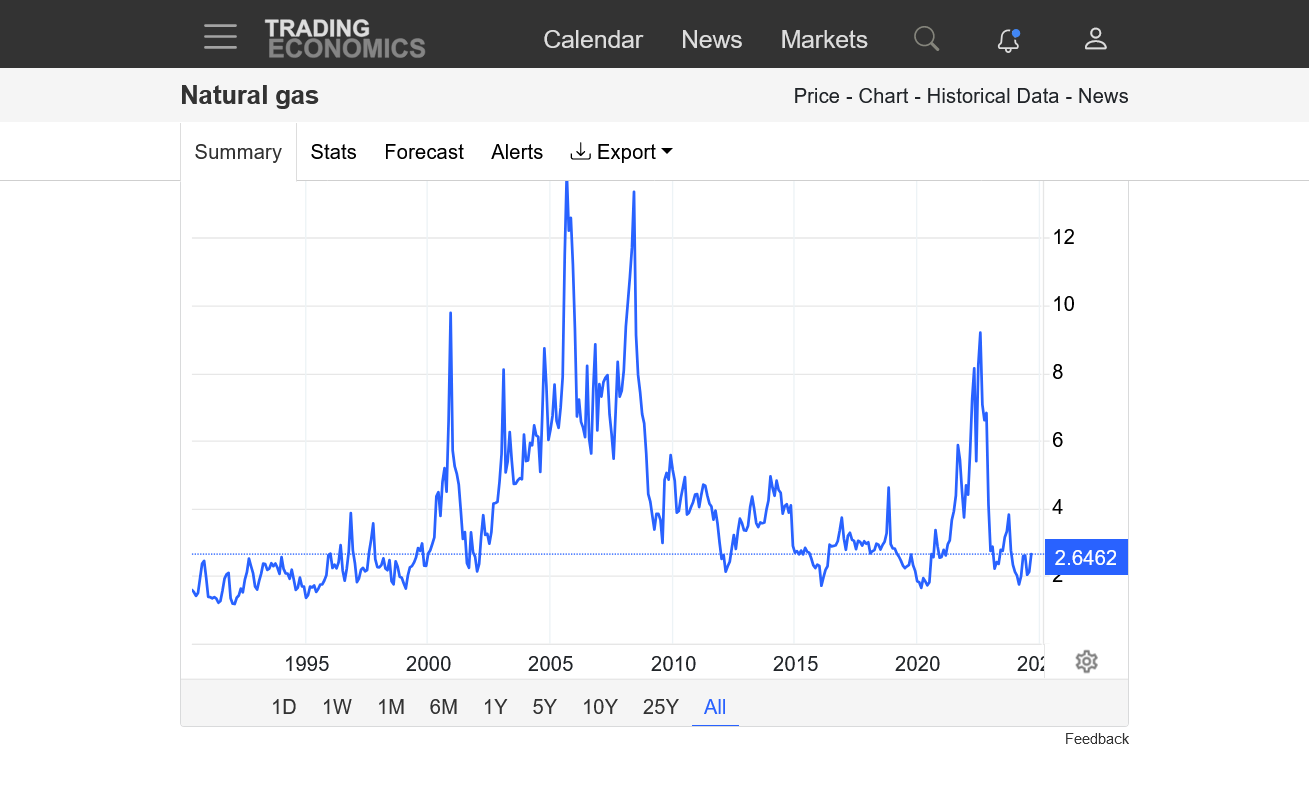
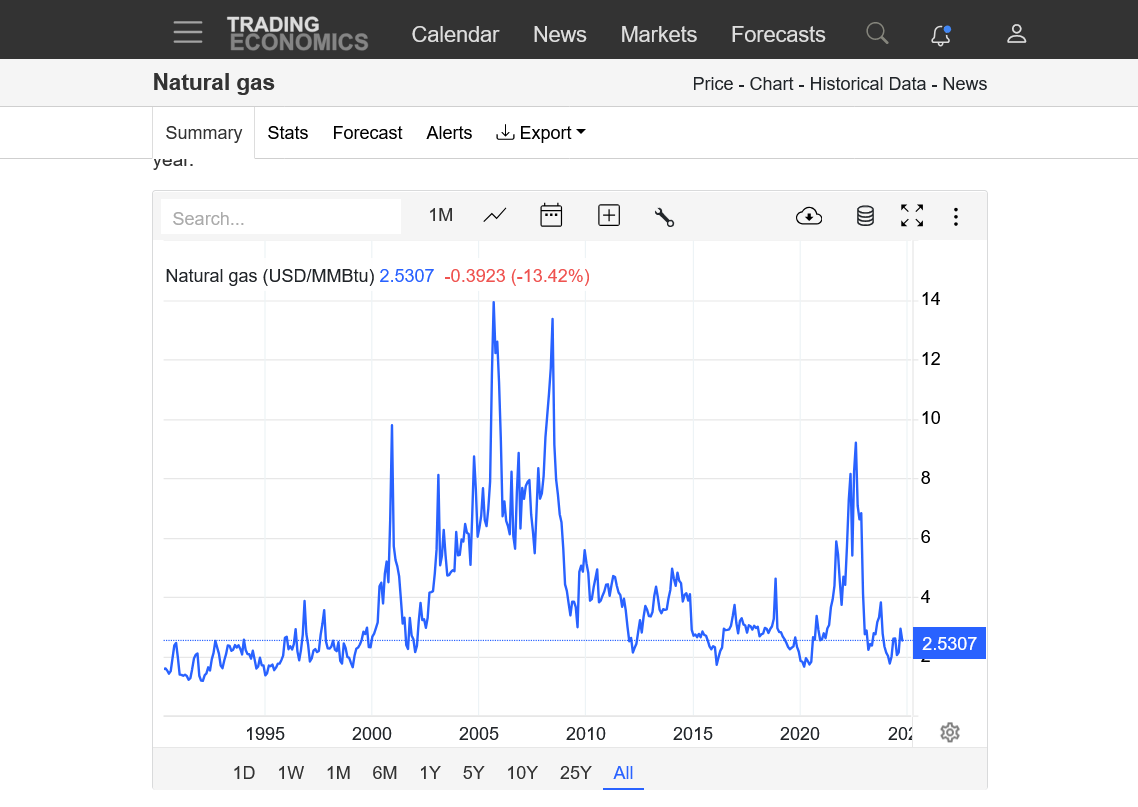
5. 35 years-Historically low prices for this century. In the bottom 1% compared to prices since 2000 and that's amazing considering inflation for almost everything else. NO INFLATION for natural gas prices. A big part of this is massive production/supplies. They have been intentionally lying about the desire to shut down fracking and fossil fuel production. It will NEVER happen. No way! Using it for political agenda, crony capitalism, sensationalizing, activist media reporting, dishonest science and misinformed but sincere environmentalists.
Also, these very low prices right now could be a symptom of a rapid slow down in the economy with reduced industrial demand.
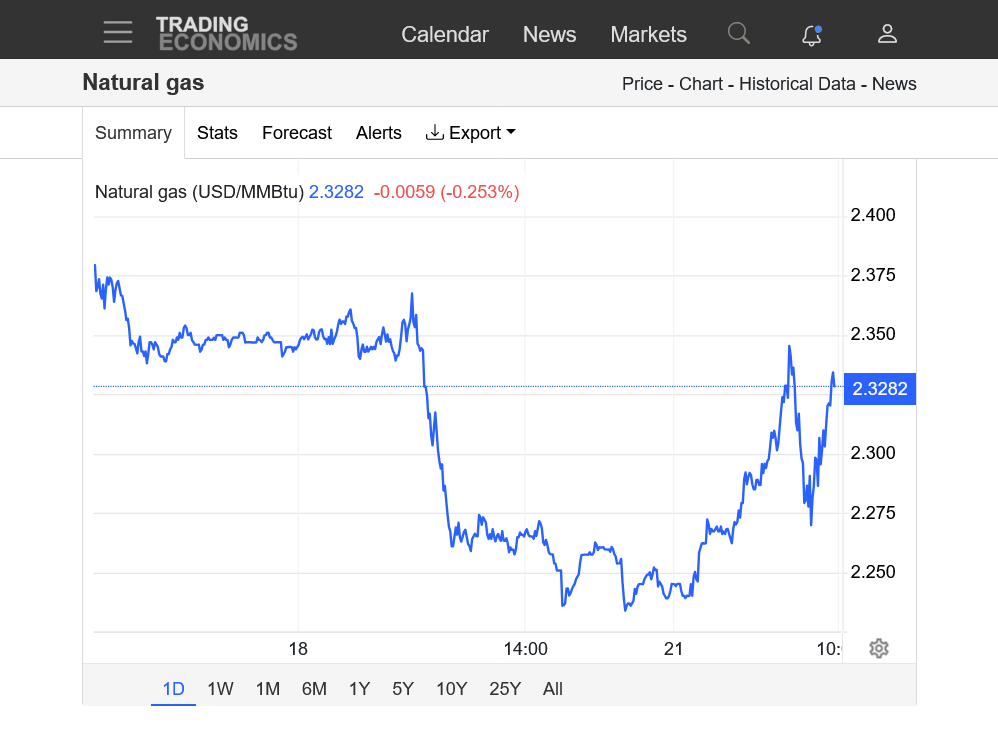
https://tradingeconomics.com/commodity/natural-gas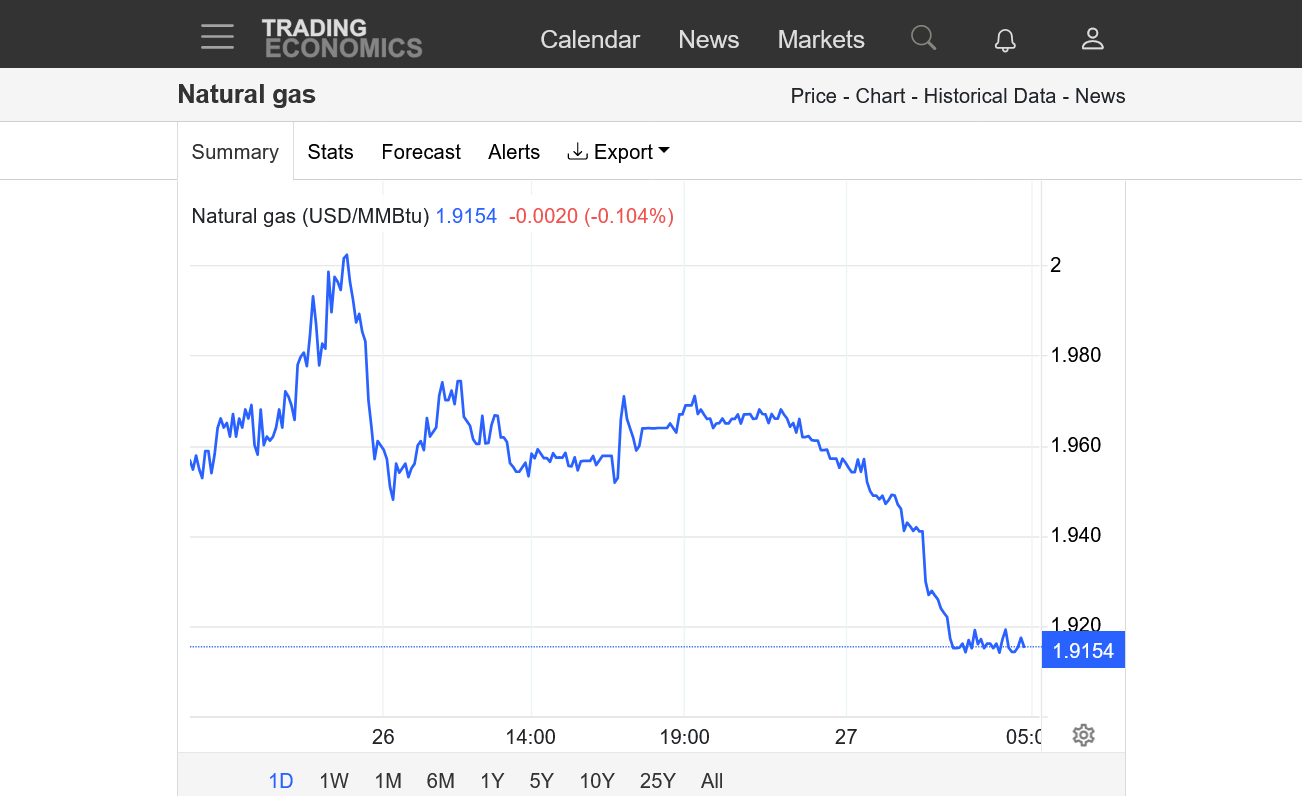
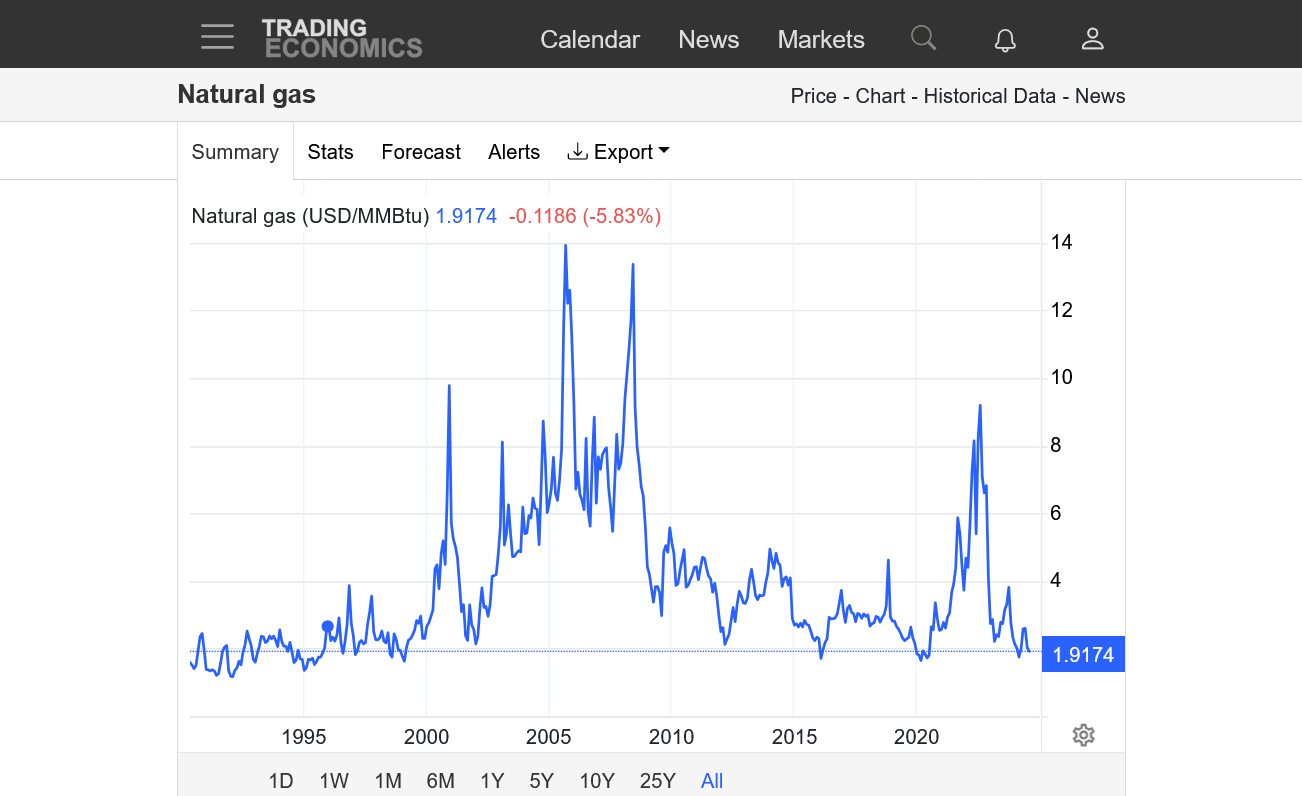
The last time that natural gas prices were this low in the month of August was 1995!!!!
Robust production/supply that kicked in almost 2 years ago boosted storage to record smashing levels by this past Winter, which also featured very mild temps............allowing natural storage levels to blow away previous records.
This surplus has slowly eroded over the past several months. No long a record but still very ample.
Low prices are great but this isn't happening, necessarily for all great reasons. This market has always predicted recessions BEFORE the recession is obvious. Industrial demand for ng drops in a recession, for one thing and the big money (not me) thats on top of fundamentals is trading them BEFORE everybody else and we see it reflected in the futures market prices, which is PREDICTING the future based on the latest information, some of which is not making headline news yet.
https://tradingeconomics.com/commodity/natural-gas
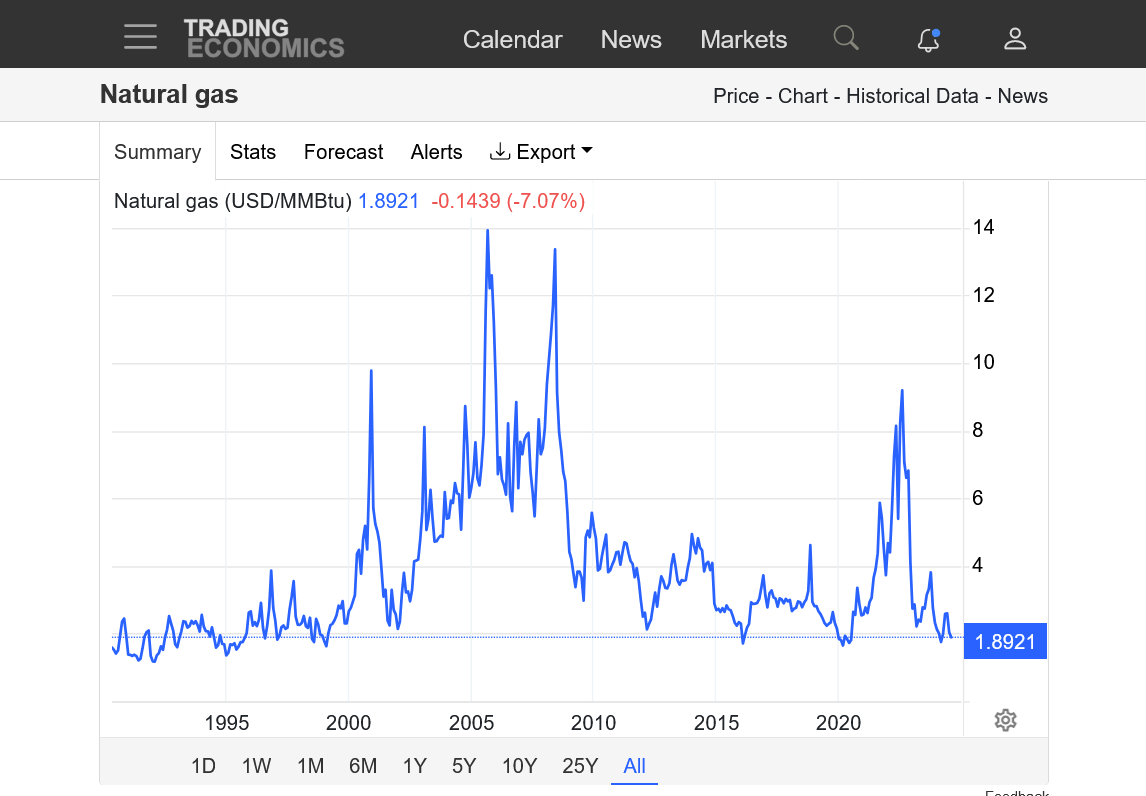
This is just 1 explanation but regardless, consumers should be celebrating how cheap this fossil fuel is right now to heat and cool our homes and generate electricity to propel modern society in 2024.........while greening up the planet with the CO2 emissions!
++++++++++++++
This also shows how incompetent/inefficient and corrupt our local energy provider, CenterPoint is.
They are RAISING natural gas rates charged to customers here in Indiana in this environment!!!
ww.marketforum.com/forum/topic/106220/
https://www.marketforum.com/forum/topic/106220/#106226
Front month, September expires today. This has likely been a factor in the recent weakness with the other factors mentioned previously.
These were the last 4 runs of the GEFS for 2 week CDDs on the right, purple being that last and coolest in week 2.
Cool Eastern half of the country last week. HOT in TX!
https://www.cpc.ncep.noaa.gov/products/tanal/temp_analyses.php
In line storage injection. Eroding the surplus a tiny bit more.
Much less heat on the way=bearish weather forecast.
https://ir.eia.gov/ngs/ngs.html
![]()
for week ending August 23, 2024 | Released: August 29, 2024 at 10:30 a.m. | Next Release: September 5, 2024
| Working gas in underground storage, Lower 48 states Summary text CSV JSN | |||||||||||||||||||||||||
|---|---|---|---|---|---|---|---|---|---|---|---|---|---|---|---|---|---|---|---|---|---|---|---|---|---|
| Historical Comparisons | |||||||||||||||||||||||||
| Stocks billion cubic feet (Bcf) | Year ago (08/23/23) | 5-year average (2019-23) | |||||||||||||||||||||||
| Region | 08/23/24 | 08/16/24 | net change | implied flow | Bcf | % change | Bcf | % change | |||||||||||||||||
| East | 754 | 735 | 19 | 19 | 745 | 1.2 | 696 | 8.3 | |||||||||||||||||
| Midwest | 909 | 888 | 21 | 21 | 847 | 7.3 | 816 | 11.4 | |||||||||||||||||
| Mountain | 266 | 263 | 3 | 3 | 211 | 26.1 | 188 | 41.5 | |||||||||||||||||
| Pacific | 287 | 288 | -1 | -1 | 246 | 16.7 | 263 | 9.1 | |||||||||||||||||
| South Central | 1,119 | 1,125 | -6 | -6 | 1,056 | 6.0 | 1,010 | 10.8 | |||||||||||||||||
| Salt | 272 | 280 | -8 | -8 | 252 | 7.9 | 238 | 14.3 | |||||||||||||||||
| Nonsalt | 847 | 845 | 2 | 2 | 804 | 5.3 | 772 | 9.7 | |||||||||||||||||
| Total | 3,334 | 3,299 | 35 | 35 | 3,106 | 7.3 | 2,973 | 12.1 | |||||||||||||||||
Totals may not equal sum of components because of independent rounding. | |||||||||||||||||||||||||
Working gas in storage was 3,334 Bcf as of Friday, August 23, 2024, according to EIA estimates. This represents a net increase of 35 Bcf from the previous week. Stocks were 228 Bcf higher than last year at this time and 361 Bcf above the five-year average of 2,973 Bcf. At 3,334 Bcf, total working gas is within the five-year historical range.
For information on sampling error in this report, see Estimated Measures of Sampling Variability table below.
Note: The shaded area indicates the range between the historical minimum and maximum values for the weekly series from 2019 through 2023. The dashed vertical lines indicate current and year-ago weekly periods.
The last 0z European model, purple/right was cooler again. -6 CDDs vs the previous 12z run.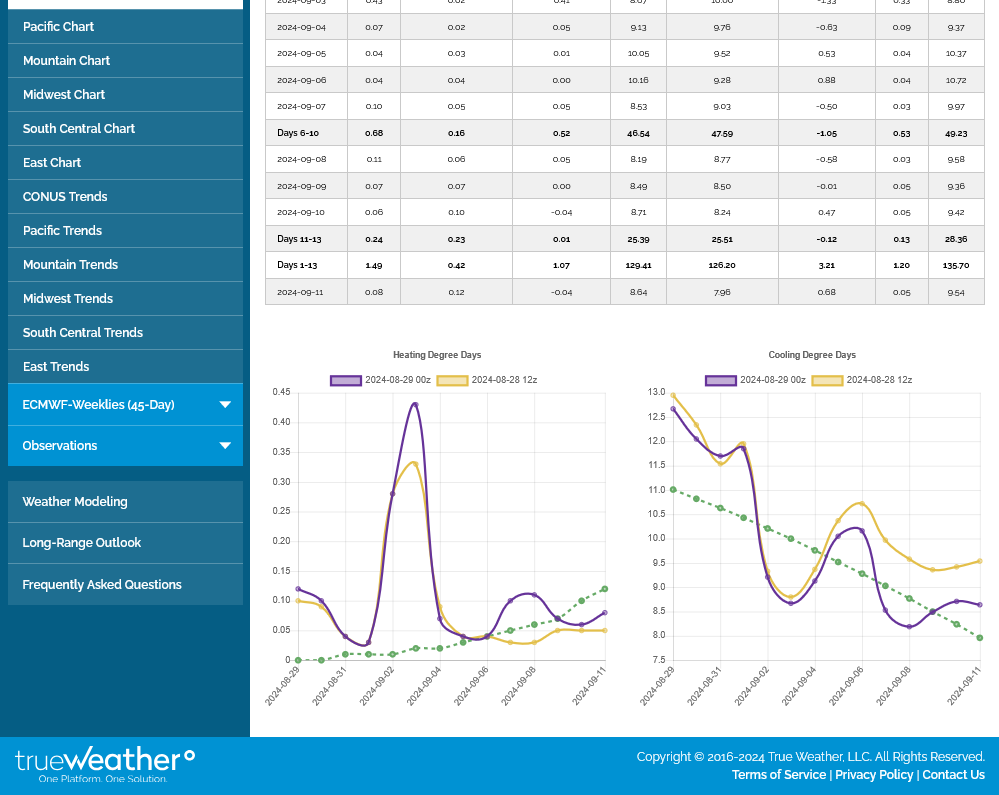
The next EIA report out on Thursday at 9:30 am will likely show a small-ish injection by late August standards because of the amount of widespread heat from TX to the center of the country to parts of the Northeast.
https://www.cpc.ncep.noaa.gov/products/tanal/temp_analyses.php
No buy signal as of yet.
We got the expected small-ish injection/build and ng, which was already trading modestly higher on expectations of a bullish report AND HEAT ON THE WAY IN WEEK 2, spiked higher immediately after the release of this bullish number and has held most of those gains.
NOTE: The heat in the SouthCentral region caused a DRAWDOWN of -14 Bcf!
The blue line on the graph below continues to slowly sink into the top of the 5 year average and very slowly erode the surplus(that was at record levels earlier this year).
https://ir.eia.gov/ngs/ngs.html
for week ending August 30, 2024 | Released: September 5, 2024 at 10:30 a.m. | Next Release: September 12, 2024
| age, Lower 48 states Summary text CSV JSN | |||||||||||||||||||||||||
|---|---|---|---|---|---|---|---|---|---|---|---|---|---|---|---|---|---|---|---|---|---|---|---|---|---|
| Historical Comparisons | |||||||||||||||||||||||||
| Stocks billion cubic feet (Bcf) | Year ago (08/30/23) | 5-year average (2019-23) | |||||||||||||||||||||||
| Region | 08/30/24 | 08/23/24 | net change | implied flow | Bcf | % change | Bcf | % change | |||||||||||||||||
| East | 761 | 754 | 7 | 7 | 762 | -0.1 | 717 | 6.1 | |||||||||||||||||
| Midwest | 922 | 909 | 13 | 13 | 870 | 6.0 | 844 | 9.2 | |||||||||||||||||
| Mountain | 270 | 266 | 4 | 4 | 217 | 24.4 | 191 | 41.4 | |||||||||||||||||
| Pacific | 289 | 287 | 2 | 2 | 251 | 15.1 | 263 | 9.9 | |||||||||||||||||
| South Central | 1,105 | 1,119 | -14 | -14 | 1,039 | 6.4 | 1,009 | 9.5 | |||||||||||||||||
| Salt | 267 | 272 | -5 | -5 | 243 | 9.9 | 233 | 14.6 | |||||||||||||||||
| Nonsalt | 838 | 847 | -9 | -9 | 797 | 5.1 | 776 | 8.0 | |||||||||||||||||
| Total | 3,347 | 3,334 | 13 | 13 | 3,139 | 6.6 | 3,024 | 10.7 | |||||||||||||||||
Totals may not equal sum of components because of independent rounding. | |||||||||||||||||||||||||
Working gas in storage was 3,347 Bcf as of Friday, August 30, 2024, according to EIA estimates. This represents a net increase of 13 Bcf from the previous week. Stocks were 208 Bcf higher than last year at this time and 323 Bcf above the five-year average of 3,024 Bcf. At 3,347 Bcf, total working gas is within the five-year historical range.
For information on sampling error in this report, see Estimated Measures of Sampling Variability table below.
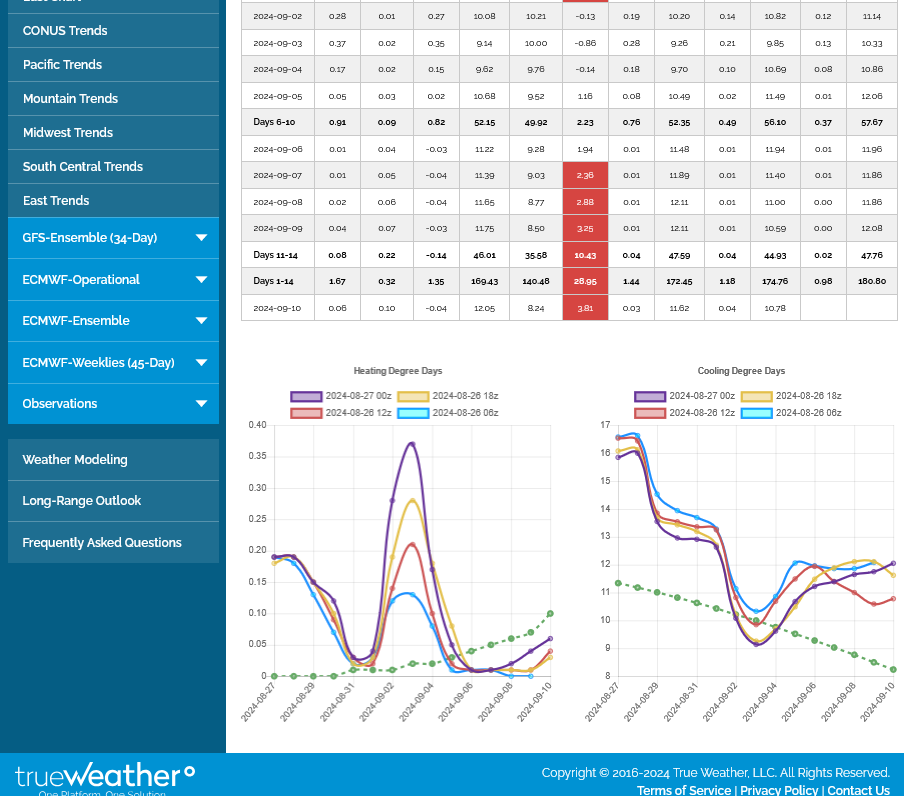
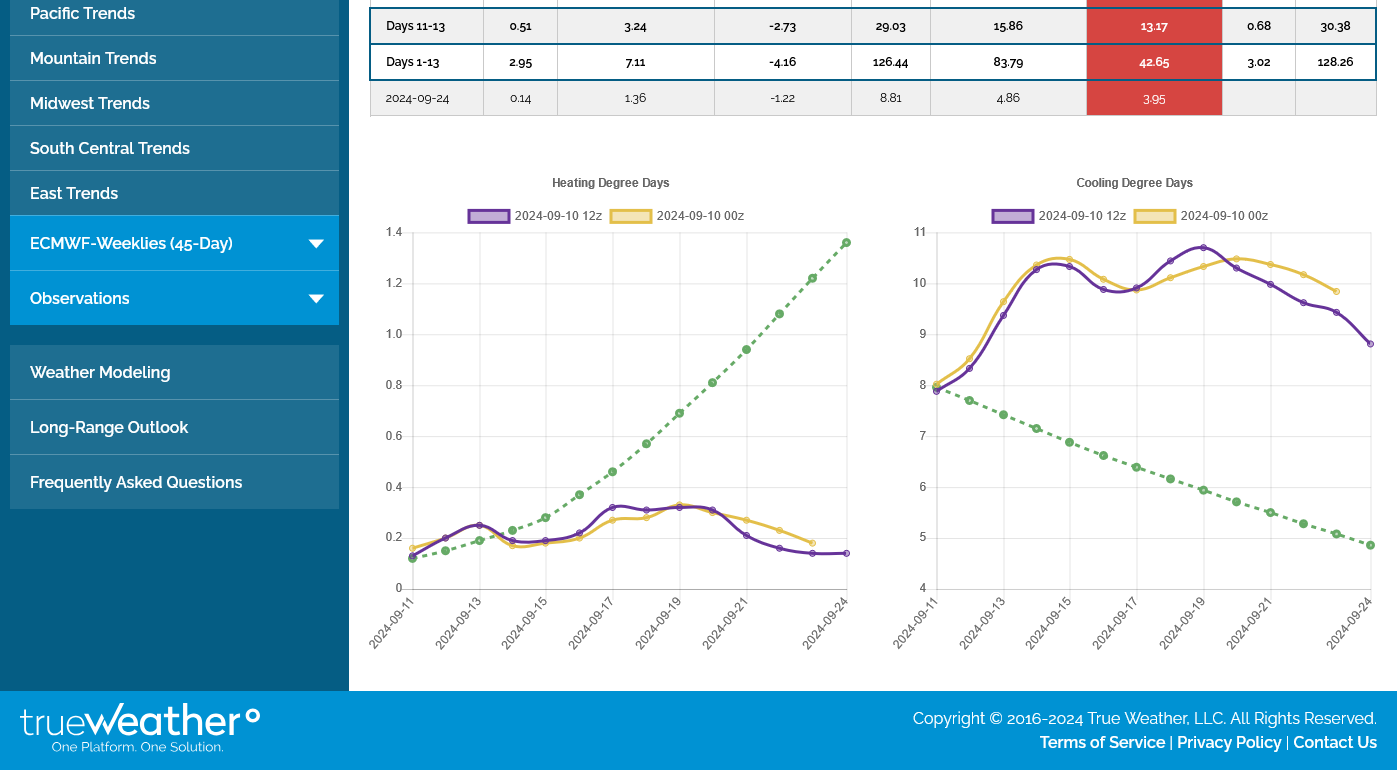
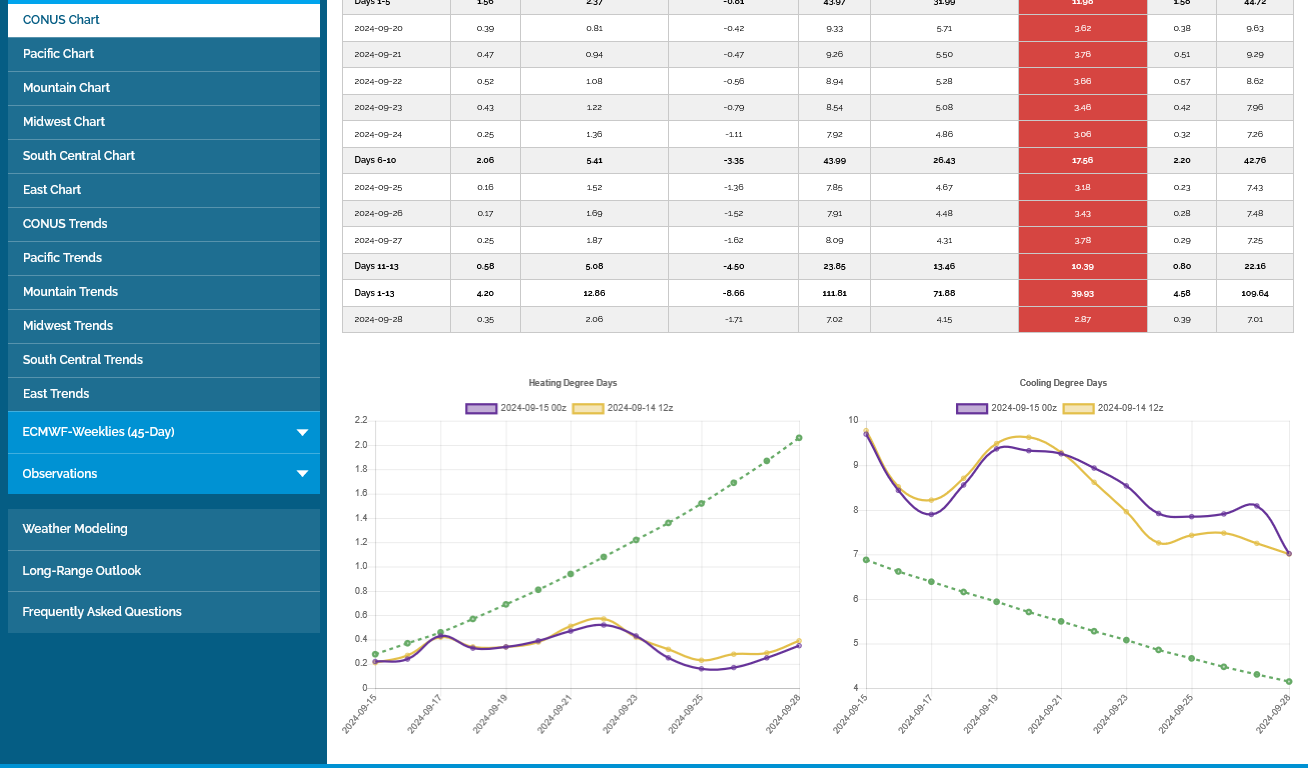
It's pretty late in the year for CDDs to impact natural gas demand(burned to generate electricity for AC use) but not too late!
CDDs are on the right. You can see how fast the average is plunging in green. However, the forecast for the next 2 weeks from the GEFS model is pretty robust! More like late August, instead of mid September. The purple line was the last 12z run.
It's late in the year for heat to be bullish natural gas but the CDDs on the right are elevated for mid/late September and bullish.
Only the right, was the last 12z European model in purple that vs -2 CDDs vs the 0z run, 12 hours earlier. Note the average CDD, green line crashing lower as temps rapidly cool off.
On the left, note the HDD green line jumping higher(on a different scale). The HDDs will pass up CDDs in around a month.
+++++++++++
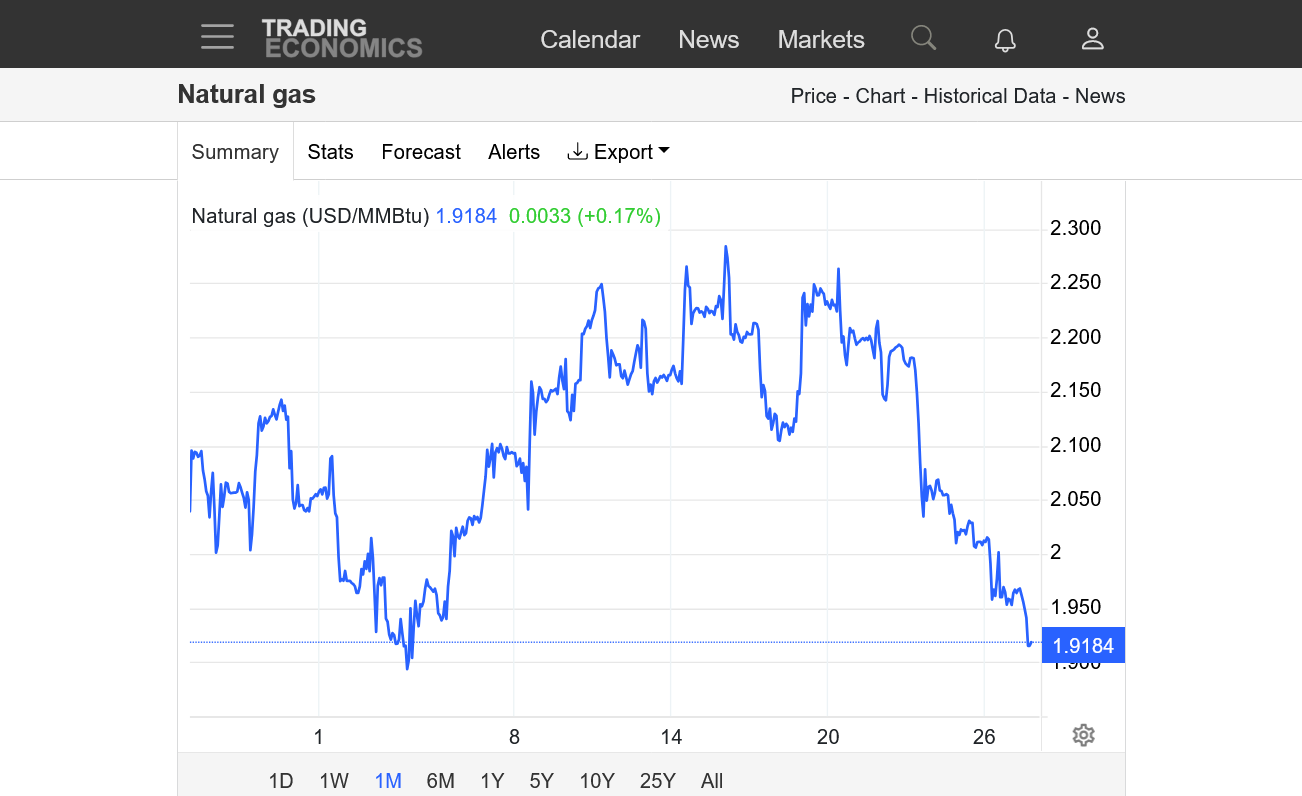
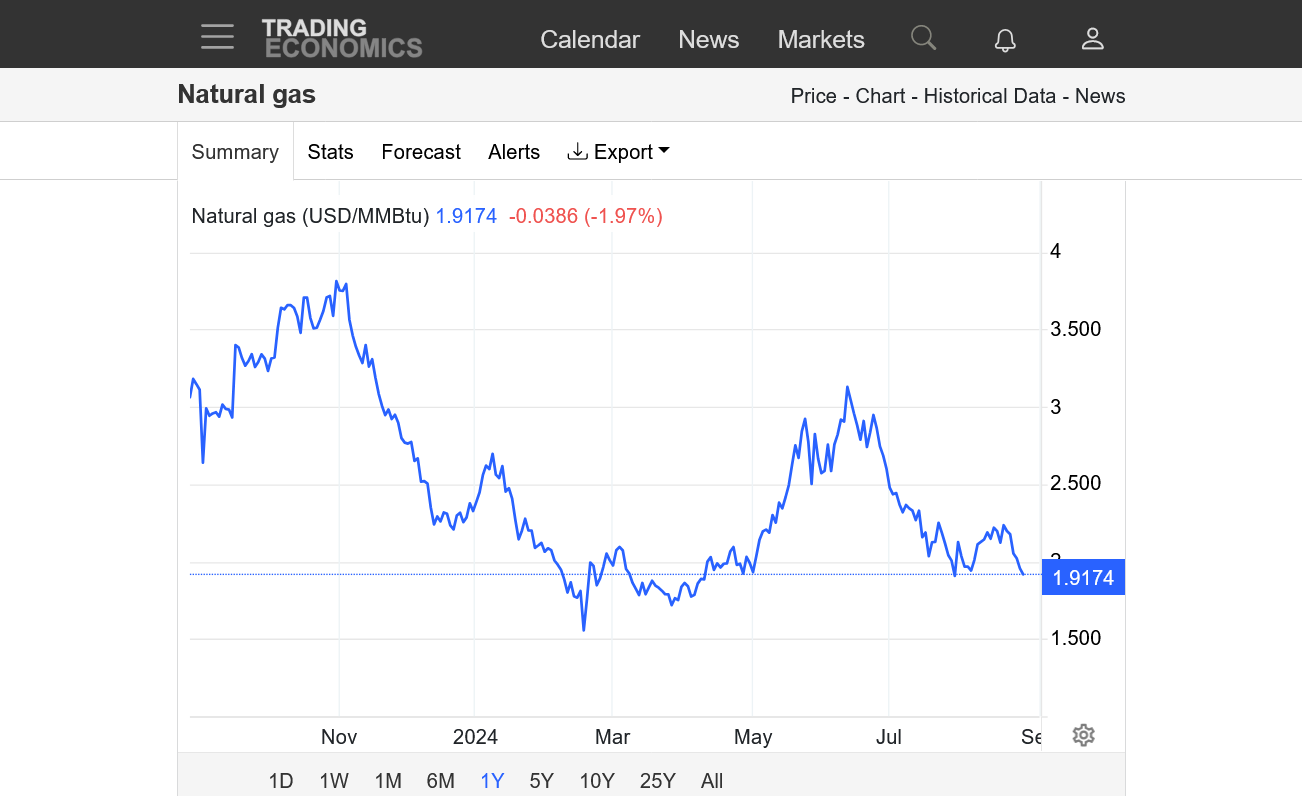
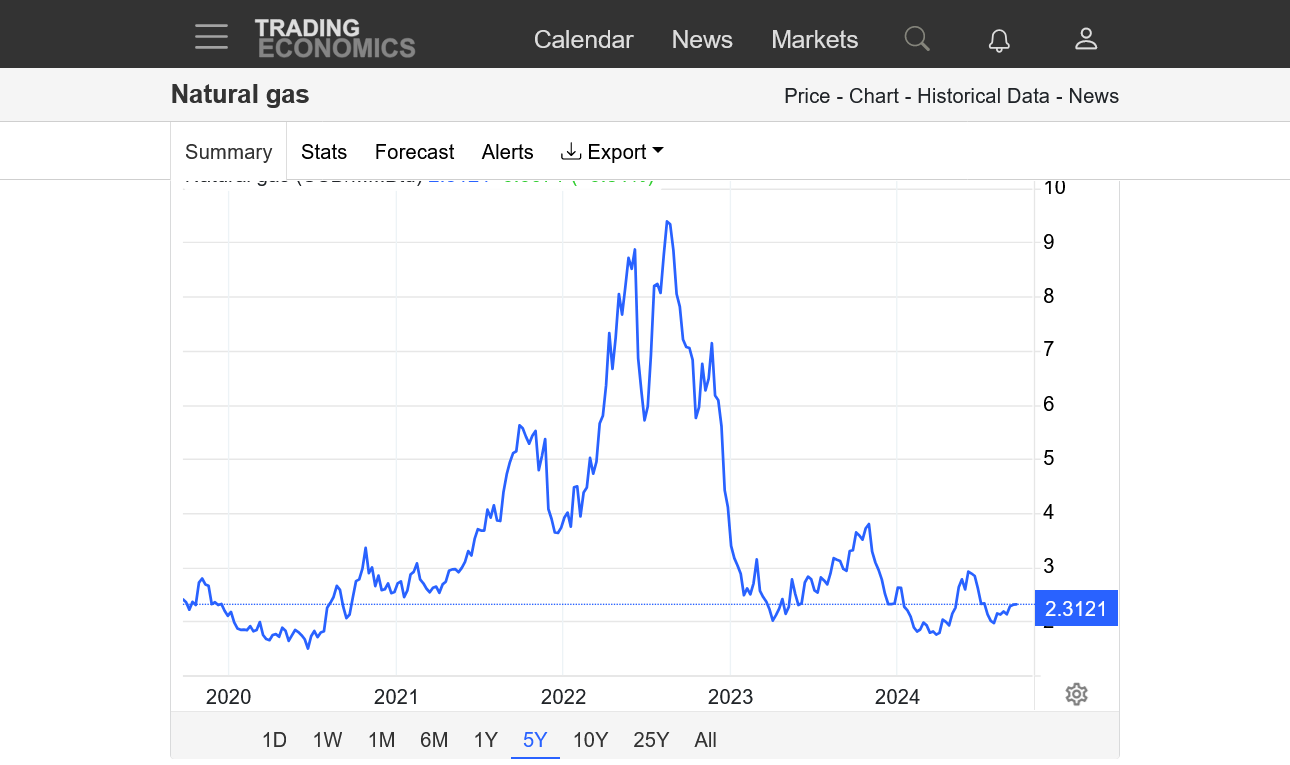
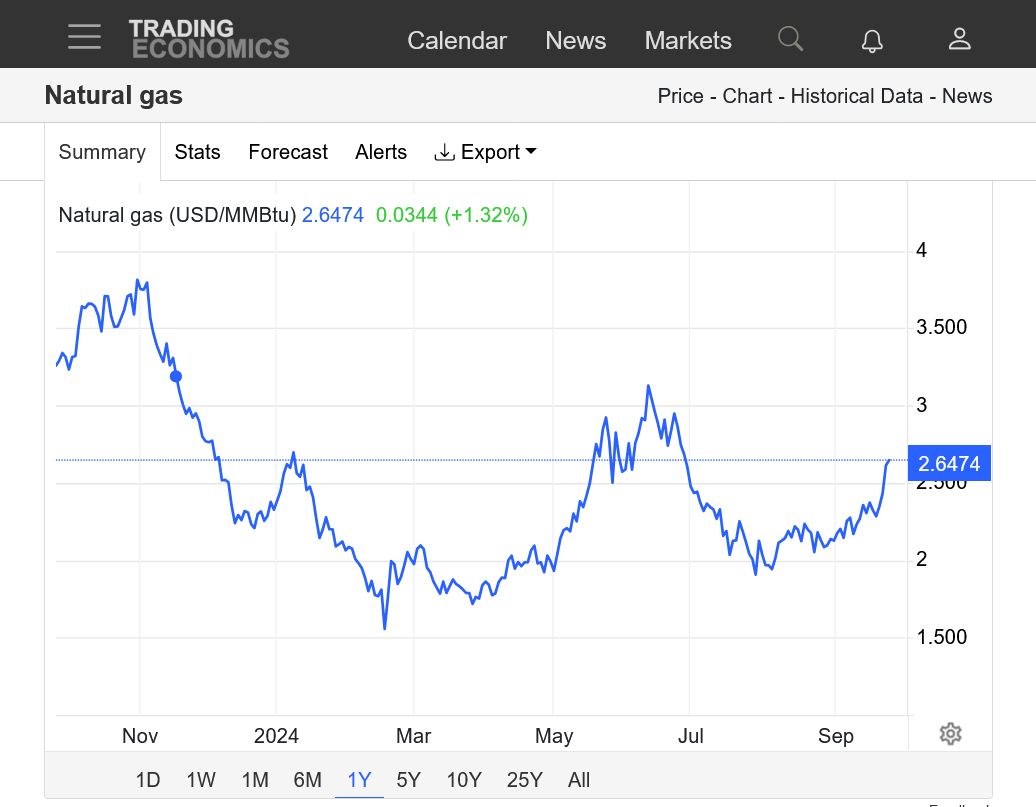
https://tradingeconomics.com/commodity/natural-gas
1. 35 years. Lowest September price in almost 3 decades (outside of COVID-Sept. 2020)
2. 5 year-Wedge formation. Lower highs and higher lows.
3. 1 year- very distinct wedge
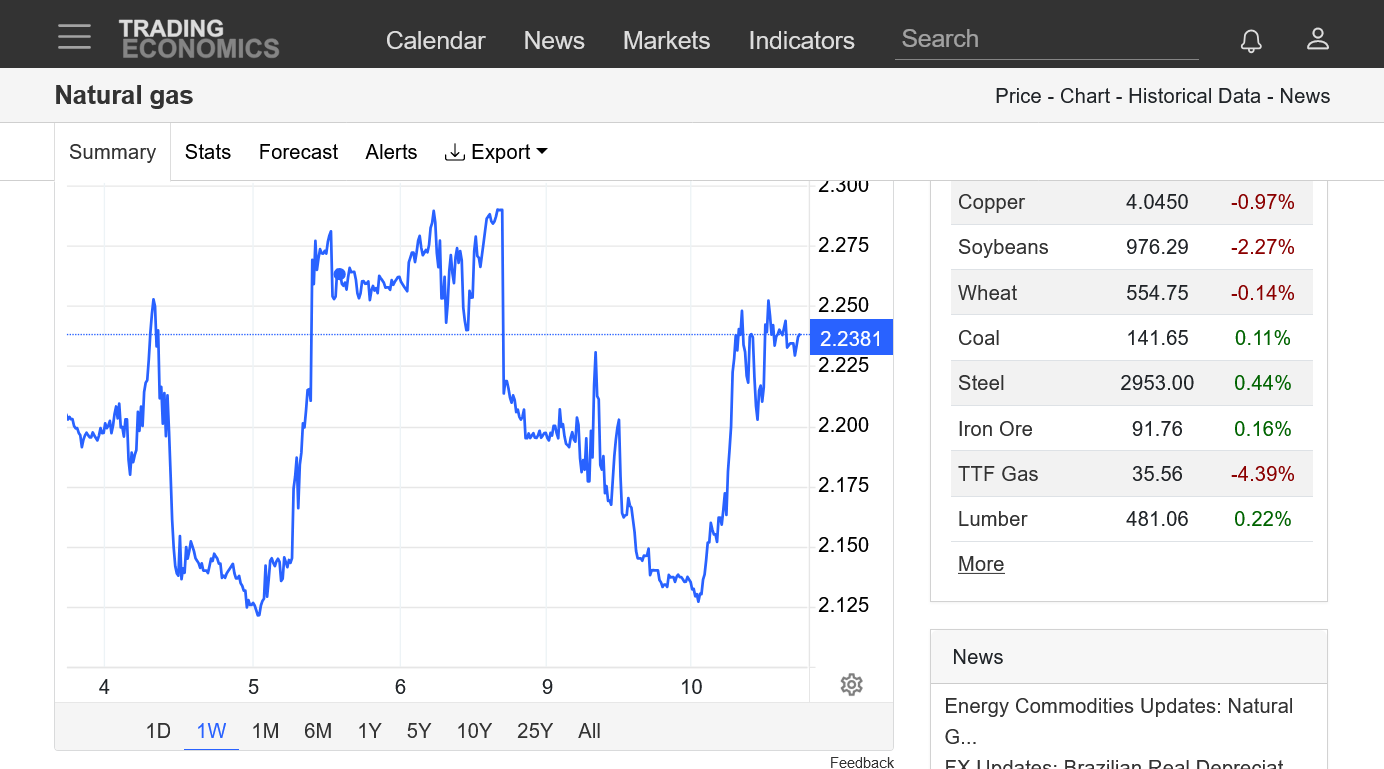
4. 1 week
7 day temps for the EIA report:
https://www.cpc.ncep.noaa.gov/products/tanal/temp_analyses.php ++++++++++++++++++
Note the blue line continuing to slowly erode the surplus that at one time was easily a record earlier this year and has been sinking into the top of the 5 year range, headed towards the 5 year average. Why prices are near 30 year lows for the month of September is baffling. Suggesting an economic slowdown from lost industrial demand? While residential demand for heating and cooling is fairly inelastic.
![]()
https://ir.eia.gov/ngs/ngs.html
for week ending September 6, 2024 | Released: September 12, 2024 at 10:30 a.m. | Next Release: September 19, 2024
| Working gas in underground storage, Lower 48 states Summary text CSV JSN | |||||||||||||||||||||||||
|---|---|---|---|---|---|---|---|---|---|---|---|---|---|---|---|---|---|---|---|---|---|---|---|---|---|
| Historical Comparisons | |||||||||||||||||||||||||
| Stocks billion cubic feet (Bcf) | Year ago (09/06/23) | 5-year average (2019-23) | |||||||||||||||||||||||
| Region | 09/06/24 | 08/30/24 | net change | implied flow | Bcf | % change | Bcf | % change | |||||||||||||||||
| East | 780 | 761 | 19 | 19 | 772 | 1.0 | 737 | 5.8 | |||||||||||||||||
| Midwest | 950 | 922 | 28 | 28 | 896 | 6.0 | 875 | 8.6 | |||||||||||||||||
| Mountain | 273 | 270 | 3 | 3 | 223 | 22.4 | 195 | 40.0 | |||||||||||||||||
| Pacific | 285 | 289 | -4 | -4 | 258 | 10.5 | 264 | 8.0 | |||||||||||||||||
| South Central | 1,098 | 1,105 | -7 | -7 | 1,039 | 5.7 | 1,020 | 7.6 | |||||||||||||||||
| Salt | 266 | 267 | -1 | -1 | 241 | 10.4 | 235 | 13.2 | |||||||||||||||||
| Nonsalt | 832 | 838 | -6 | -6 | 799 | 4.1 | 785 | 6.0 | |||||||||||||||||
| Total | 3,387 | 3,347 | 40 | 40 | 3,189 | 6.2 | 3,091 | 9.6 | |||||||||||||||||
Totals may not equal sum of components because of independent rounding. | |||||||||||||||||||||||||
Working gas in storage was 3,387 Bcf as of Friday, September 6, 2024, according to EIA estimates. This represents a net increase of 40 Bcf from the previous week. Stocks were 198 Bcf higher than last year at this time and 296 Bcf above the five-year average of 3,091 Bcf. At 3,387 Bcf, total working gas is within the five-year historical range.
For information on sampling error in this report, see Estimated Measures of Sampling Variability table below.
Note: The shaded area indicates the range between the historical minimum and maximum values for the weekly series from 2019 through 2023. The dashed vertical lines indicate current and year-ago weekly periods.
Temps last week for the 9:30 am Thursday EIA report. COOOOL Eastern half (where more people live and more ng demand for cooling exists). Very warm West.
I will guess that the injection will be higher than recent weeks.
https://www.cpc.ncep.noaa.gov/products/tanal/temp_analyses.php
We are entering a period when HDDs AND CDDS often add up to the lowest totals during the year.
CDDS are elevated in the forecast on the right of this European model (purple was the last 0z run, tan was the previous run 12 hours earlier) but I'm not sure how bullish that is in late September but its NOT bearish. CDDs will be passing them up, seasonally in a month.
Down a whopping -8 CDDs on the last 12z GEFS in purple on the right. This model is run every 6 others, with the previous 3 also graphed below. Green is the rapidly falling climate average for each date. On the left, is the HDDs graph. Note it rapidly rising on a different scale. Seasonal HDDs will pass up CDDs early in the 2nd week of October. This is a time of year when, typically neither of them add up to enough to make much of a dent in storage. Some of our most robust injections of the year often happen in the coming weeks because of this.

+++++++++
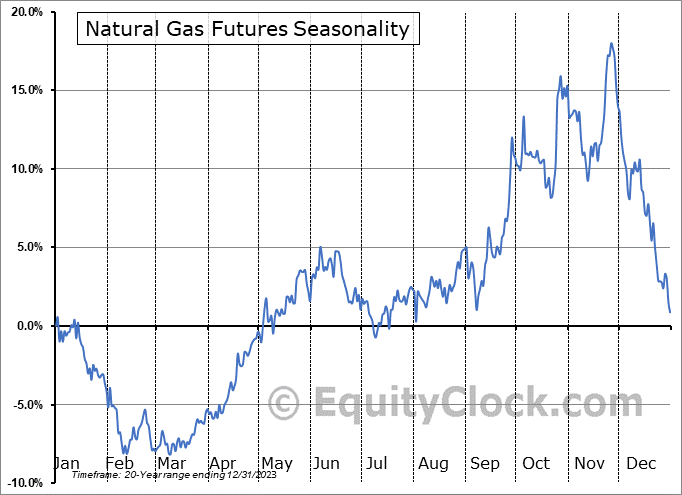
We are approaching a time frame with seasonal strength in prices based on past history(each year is different).
The peak usually, but not always happens in Oct/Nov. Extreme cold in early December can extend the peak a bit.
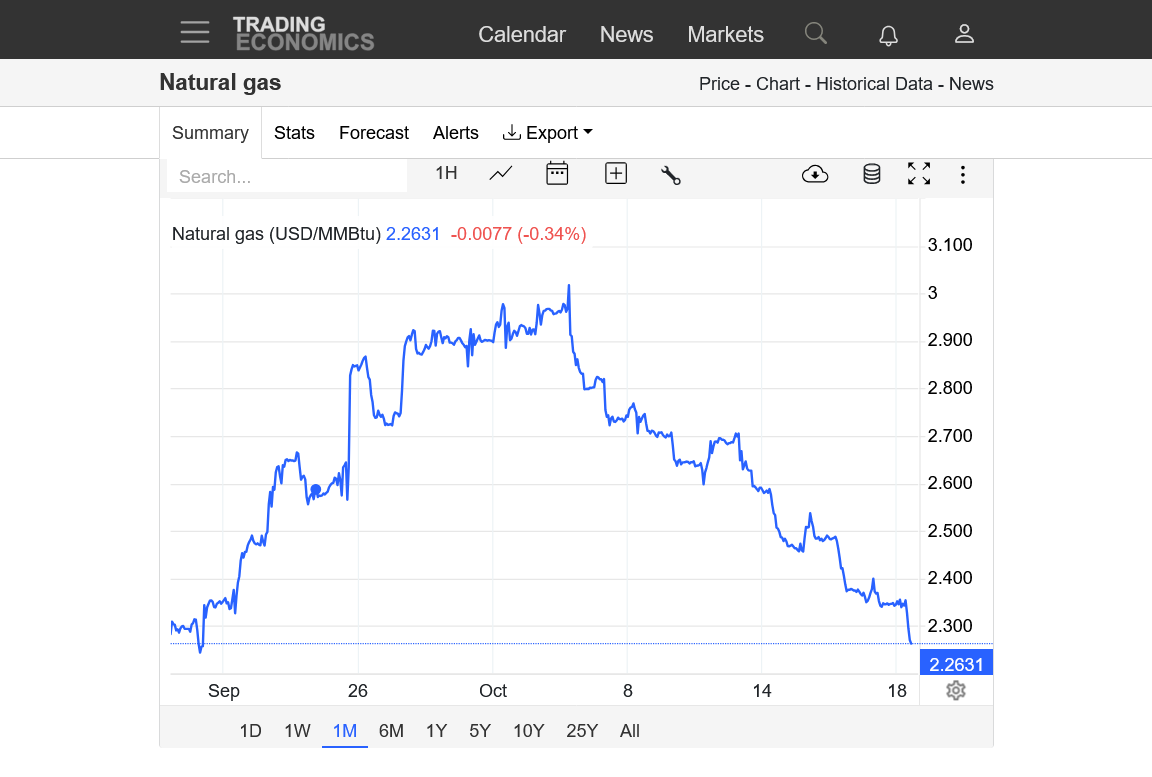
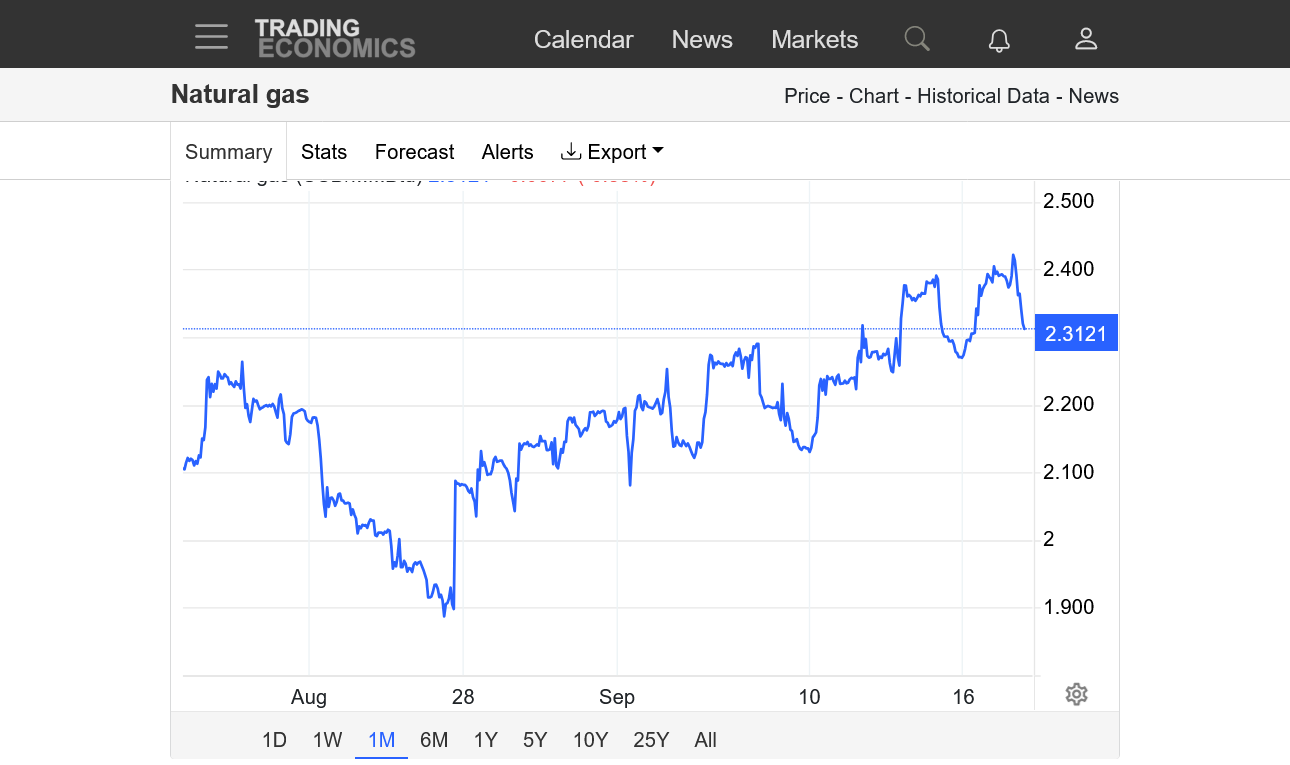
https://tradingeconomics.com/commodity/natural-gas
1. 35 years-lowest price in September in almost 3 decades
2. 5 years-similar price to September 2020-COVID suppressed price year
3. 1 year-wedge pattern with higher lows and lower highs
4. 1 month-strong short term uptrending channel.
5. 1 week-testing the bottom of the uptrend?
Note on the graph below. The slope of the gray shaded 5 year RANGE in storage is STEEPER than the slope of the plot of the current storage number in blue. As a result, the blue line continues to slowly erode the surplus, week after week.
Earlier this year the surplus was way above any other year to end the heating season(mildest Winter ever, with some help from El Nino and the climate optimum and robust supplies gushing in). Now the surplus is almost halfway between the top of the 5 year range and the average in the middle of the range.
Stocks are still 274 Bcf above the 5 year average. This compares to 655 Bcf above the 5 year average on April 25, 2024 when the record surplus peaked.
This means that we've eroded -379 Bcf of storage surplus in less than 6 months, all from smaller injections than average(and one shocking withdrawal(August 15th at -6 Bcf) the 2nd in history during the injection season). This is pretty bullish!
for week ending September 13, 2024 | Released: September 19, 2024 at 10:30 a.m. | Next Release: September 26, 2024
| Working gas in underground storage, Lower 48 states Summary text CSV JSN | |||||||||||||||||||||||||
|---|---|---|---|---|---|---|---|---|---|---|---|---|---|---|---|---|---|---|---|---|---|---|---|---|---|
| Historical Comparisons | |||||||||||||||||||||||||
| Stocks billion cubic feet (Bcf) | Year ago (09/13/23) | 5-year average (2019-23) | |||||||||||||||||||||||
| Region | 09/13/24 | 09/06/24 | net change | implied flow | Bcf | % change | Bcf | % change | |||||||||||||||||
| East | 802 | 780 | 22 | 22 | 788 | 1.8 | 760 | 5.5 | |||||||||||||||||
| Midwest | 973 | 950 | 23 | 23 | 923 | 5.4 | 906 | 7.4 | |||||||||||||||||
| Mountain | 275 | 273 | 2 | 2 | 227 | 21.1 | 199 | 38.2 | |||||||||||||||||
| Pacific | 283 | 285 | -2 | -2 | 262 | 8.0 | 266 | 6.4 | |||||||||||||||||
| South Central | 1,111 | 1,098 | 13 | 13 | 1,050 | 5.8 | 1,040 | 6.8 | |||||||||||||||||
| Salt | 271 | 266 | 5 | 5 | 242 | 12.0 | 241 | 12.4 | |||||||||||||||||
| Nonsalt | 840 | 832 | 8 | 8 | 808 | 4.0 | 799 | 5.1 | |||||||||||||||||
| Total | 3,445 | 3,387 | 58 | 58 | 3,251 | 6.0 | 3,171 | 8.6 | |||||||||||||||||
Totals may not equal sum of components because of independent rounding. | |||||||||||||||||||||||||
Working gas in storage was 3,445 Bcf as of Friday, September 13, 2024, according to EIA estimates. This represents a net increase of 58 Bcf from the previous week. Stocks were 194 Bcf higher than last year at this time and 274 Bcf above the five-year average of 3,171 Bcf. At 3,445 Bcf, total working gas is within the five-year historical range.
For information on sampling error in this report, see Estimated Measures of Sampling Variability table below.
Note: The shaded area indicates the range between the historical minimum and maximum values for the weekly series from 2019 through 2023. The dashed vertical lines indicate current and year-ago weekly periods.
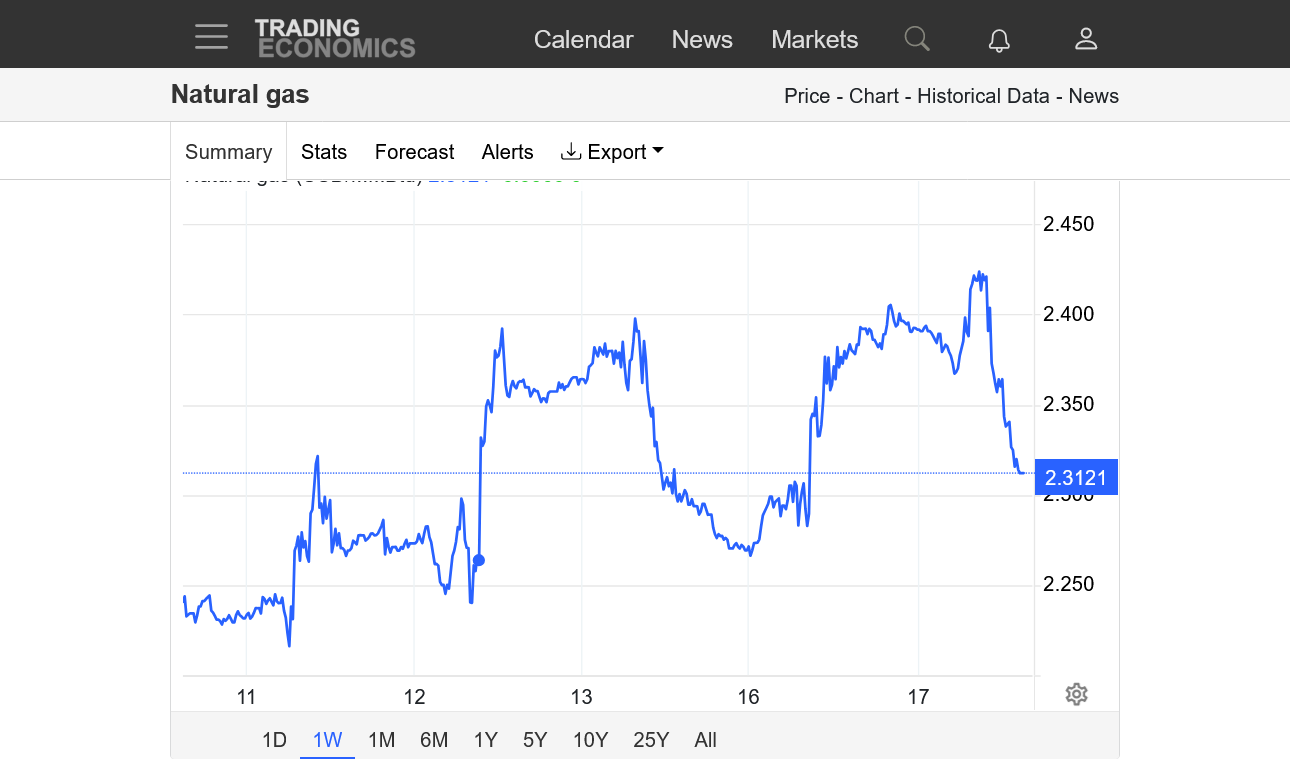
https://tradingeconomics.com/commodity/natural-gas
Eroding storage surplus, as we've posted for weeks IS BULLISH!
1. 1 month: Big move up since the last July low(which was close to the lowest price in 3 decades.
2. 1 year: Next target, $3? June highs?
3. 10 years-
3. 35 years-prices still low historically. Storage surplus has been eroding though.


Slightly bearish EIA vs expectations. However:
More eroding of the storage surplus continues. As a result this has had a bullish impact on prices recently.
Note the blue line for current storage, continues at a LESS steep(slope) than the 5 year metrics we compare storage too with the blue line now approaching the 5 year average after being waaaay above the highest ever storage in history early this year.
![]()
for week ending September 20, 2024 | Released: September 26, 2024 at 10:30 a.m. | Next Release: October 3, 2024
| Working gas in underground storage, Lower 48 states Summary text CSV JSN | |||||||||||||||||||||||||
|---|---|---|---|---|---|---|---|---|---|---|---|---|---|---|---|---|---|---|---|---|---|---|---|---|---|
| Historical Comparisons | |||||||||||||||||||||||||
| Stocks billion cubic feet (Bcf) | Year ago (09/20/23) | 5-year average (2019-23) | |||||||||||||||||||||||
| Region | 09/20/24 | 09/13/24 | net change | implied flow | Bcf | % change | Bcf | % change | |||||||||||||||||
| East | 818 | 802 | 16 | 16 | 813 | 0.6 | 787 | 3.9 | |||||||||||||||||
| Midwest | 993 | 973 | 20 | 20 | 953 | 4.2 | 937 | 6.0 | |||||||||||||||||
| Mountain | 279 | 275 | 4 | 4 | 232 | 20.3 | 205 | 36.1 | |||||||||||||||||
| Pacific | 289 | 283 | 6 | 6 | 269 | 7.4 | 270 | 7.0 | |||||||||||||||||
| South Central | 1,113 | C | 1,111 | 2 | 10 | C | 1,066 | 4.4 | 1,060 | 5.0 | |||||||||||||||
| Salt | 265 | C | 271 | -6 | 2 | C | 248 | 6.9 | 248 | 6.9 | |||||||||||||||
| Nonsalt | 848 | 840 | 8 | 8 | 818 | 3.7 | 812 | 4.4 | |||||||||||||||||
| Total | 3,492 | C | 3,445 | 47 | 55 | C | 3,333 | 4.8 | 3,259 | 7.1 | |||||||||||||||
Note: Reclassifications from working gas to base gas decreased working gas stocks 8 Bcf in the salt South Central region for the week ending September 20, 2024. The implied flow for the week is an increase of 55 Bcf to working gas stocks. (See Notes and Definitions for more information on "implied flow.") Totals may not equal sum of components because of independent rounding. C=Reclassification. | |||||||||||||||||||||||||
Working gas in storage was 3,492 Bcf as of Friday, September 20, 2024, according to EIA estimates. This represents a net increase of 47 Bcf from the previous week. Stocks were 159 Bcf higher than last year at this time and 233 Bcf above the five-year average of 3,259 Bcf. At 3,492 Bcf, total working gas is within the five-year historical range.
For information on sampling error in this report, see Estimated Measures of Sampling Variability table below.
Note: The shaded area indicates the range between the historical minimum and maximum values for the weekly series from 2019 through 2023. The dashed vertical lines indicate current and year-ago weekly periods.
+++++++++++
Nymex natural gas futures fell back on Thursday, under the weight of a slightly bearish government storage print and expected demand destruction from Hurricane Helene slamming into the Southeast.
Not complaining..........just explaining.
The front month, Oct NG expired today. The new front month, Nov trades higher(more demand in Nov) so when a continuation chart like the one below that I use from this awesome source goes from graphing the Oct to Nov it looks like a huge spike higher that never happened.
https://tradingeconomics.com/commodity/natural-gas
1. 1 year-makes it look like the price is higher than what it really is
2. 1 month-same thing
3. 1 day......this is the graph, with only NGX(November) that best reflects what happened


Regardless of the new contracts trading on Thursday, ng continues to erode the surplus and that is bullish.
The November Nymex natural gas contract rallied in its debut at the front of the curve Friday, as Lower 48 gas demand escaped the worst impacts of Hurricane Helene with LNG exports steady and Southeast cash prices only partially dinged.
+++++++++++++++
Again, the massive record surplus from early this year has been slowly gobbled up and we are getting close to the 5 year average now. No way prices would stay near 30 year lows when the storage fundamentals continue to be bullish.......unless the economy was headed into a major recession that would cut Industrial demand. As long as the surplus keeps shrinking, the fundamentals for ng are positive.
When we hit the heating season, then the main fundamental will be heating degree days based on residential demand.
We've about a month away from that typically starting to be important.
7 day temps for tomorrows weekly EIA storage report:
Very warm across the country! (BEFORE Hurricane Helene cut demand in the Southeast)
https://www.cpc.ncep.noaa.gov/products/tanal/temp_analyses.php

As tens of thousands of union members strike at ports across the Eastern Seaboard and Gulf Coast, oil and natural gas exports are largely expected to continue uninterrupted – at least in the short term.
+++++++++++++++++++++++++++++++++
+++++++++++
This is a reporter that has the job of telling people why the market is down or up........sometimes they are right, sometimes they don't know and have to guess.............LIKE RIGHT NOW.
The NG storage surplus has been shrinking almost every week the past 6 months. THIS IS BULLISH AHEAD OF WINTER WHEN SEASONALS ARE VERY POSITIVE AS THE MARKET BUYS EXTRA NG TO FILL STORAGE AHEAD OF WINTER.
By metmike - Sept. 17, 2024, 3:44 p.m.
More shrinking of the storage surplus which continues to be BULLISH. Down to just +190 Bcf vs the 5 year average.
Stocks were 274 Bcf above the 5 year average on September 19, 2024, 2 weeks ago. This compares to 655 Bcf above the 5 year average on April 25, 2024 when the record surplus peaked.
Look again at the blue line on the graph below. The slope of the increase in current storage is less steep than the 5 year average so the 2 lines are converging and will intersect later this Fall if it continues. This is bullish.
https://ir.eia.gov/ngs/ngs.html
![]()
for week ending September 27, 2024 | Released: October 3, 2024 at 10:30 a.m. | Next Release: October 10, 2024
Working gas in underground storage, Lower 48 states Summary text
CSV
JSN Historical ComparisonsStocks
billion cubic feet (Bcf) Year ago
(09/27/23)5-year average
(2019-23) Region09/27/2409/20/24net changeimplied flow
Bcf% change Bcf% changeEast846 818 28 28 840 0.7 815 3.8 Midwest1,013 993 20 20 983 3.1 969 4.5 Mountain283 279 4 4 238 18.9 211 34.1 Pacific293 289 4 4 276 6.2 275 6.5 South Central1,113 1,113 0 0 1,085 2.6 1,087 2.4 Salt261 265 -4 -4 256 2.0 260 0.4 Nonsalt852 848 4 4 827 3.0 827 3.0 Total3,547 3,492 55 55 3,420 3.7 3,357 5.7
Totals may not equal sum of components because of independent rounding.
Working gas in storage was 3,547 Bcf as of Friday, September 27, 2024, according to EIA estimates. This represents a net increase of 55 Bcf from the previous week. Stocks were 127 Bcf higher than last year at this time and 190 Bcf above the five-year average of 3,357 Bcf. At 3,547 Bcf, total working gas is within the five-year historical range.
For information on sampling error in this report, see Estimated Measures of Sampling Variability table below.
Note: The shaded area indicates the range between the historical minimum and maximum values for the weekly series from 2019 through 2023. The dashed vertical lines indicate current and year-ago weekly periods.
Above normal temperature will become increasingly bearish until we hit January and temperatures bottom out.
These were the 7 days temps last week used for this Thursday's EIA storage report. Warm across much of the country. In some of those places, the HDDs have passed up CDDs and this is bearish.
The South(that still sees some CDDs) was not as warm compared to average as other places. Much of this was from the remnants of Helene.
So a robust number coming up on Thursday.
https://www.cpc.ncep.noaa.gov/products/tanal/temp_analyses.php
 ++++++++++++
Today's reason for sharply lower natural gas prices was lower cooling demand in FL because of Milton. Seems more like an excuse. The warm forecast for much of the country in late October will make 10 times more bearish difference than the hurricane. Warm weather forecasts are BEARISH in most places now because they reduce HDDs.
Lows days 3-7 below:
https://www.wpc.ncep.noaa.gov/medr/medr_min.shtml

Climatologically averaged heating degree days on the left passed up CDDs on the right last week, depicted by the dashed green lines.
So CDDS on the right are well above average BUT SO WHAT! Says the market which is tracking HDDS on the left that are MUCH lower than average for most of the period!
However, in October HDDs usually don't add up to that much compared to the numbers in a couple of months. Extreme cold waves that matter to storage levels are the rare exceptions.
There were the last 4 model runs of the GEFS, that come out every 6 hours. The last run is always in purple. 12z run in this case.
The last 0z European model had -6 HDDs(warmer). NG is down sharply again here on Wednesday. with cold now being bullish and warm being bearish.
However, this is a pretty decent chilly shot coming up next week in the Eastern part of the country, with the biggest population centers but it only lasts several days in between the warmth.
As expected, a robust injection. +82 Bcf!! The storage surplus vs the 5 year average is down to +176 Bcf compared to +655 Bcf on April 25, less than 6 months ago(when they peaked)!
As stressed for months, look at the blue line for current storage on the graph below and compare it with the 5 year range and 5 year average to see that the storage surplus has been whittled away fairly quickly. This is bullish!
BUT NOW, we are into the VERY START OF THE heating season. WEATHER WILL BE KING PRETTY SOON BECAUSE WEATHER (HDDs) WILL DETERMINE RESIDENTIAL HEATING DEMAND WHICH IS THE MAIN CONTRIBUTING FACTOR TO THE SIZE OF DRAWDOWNS (AND STORAGE LEVELS) IN THE WINTER.
for week ending October 4, 2024 | Released: October 10, 2024 at 10:30 a.m. | Next Release: October 17, 2024
| Working gas in underground storage, Lower 48 states Summary text CSV JSN | |||||||||||||||||||||||||
|---|---|---|---|---|---|---|---|---|---|---|---|---|---|---|---|---|---|---|---|---|---|---|---|---|---|
| Historical Comparisons | |||||||||||||||||||||||||
| Stocks billion cubic feet (Bcf) | Year ago (10/04/23) | 5-year average (2019-23) | |||||||||||||||||||||||
| Region | 10/04/24 | 09/27/24 | net change | implied flow | Bcf | % change | Bcf | % change | |||||||||||||||||
| East | 873 | 846 | 27 | 27 | 866 | 0.8 | 842 | 3.7 | |||||||||||||||||
| Midwest | 1,041 | 1,013 | 28 | 28 | 1,012 | 2.9 | 1,002 | 3.9 | |||||||||||||||||
| Mountain | 286 | 283 | 3 | 3 | 243 | 17.7 | 216 | 32.4 | |||||||||||||||||
| Pacific | 293 | 293 | 0 | 0 | 278 | 5.4 | 278 | 5.4 | |||||||||||||||||
| South Central | 1,137 | 1,113 | 24 | 24 | 1,106 | 2.8 | 1,116 | 1.9 | |||||||||||||||||
| Salt | 275 | 261 | 14 | 14 | 265 | 3.8 | 273 | 0.7 | |||||||||||||||||
| Nonsalt | 861 | 852 | 9 | 9 | 841 | 2.4 | 843 | 2.1 | |||||||||||||||||
| Total | 3,629 | 3,547 | 82 | 82 | 3,505 | 3.5 | 3,453 | 5.1 | |||||||||||||||||
Totals may not equal sum of components because of independent rounding. | |||||||||||||||||||||||||
Working gas in storage was 3,629 Bcf as of Friday, October 4, 2024, according to EIA estimates. This represents a net increase of 82 Bcf from the previous week. Stocks were 124 Bcf higher than last year at this time and 176 Bcf above the five-year average of 3,453 Bcf. At 3,629 Bcf, total working gas is within the five-year historical range.
For information on sampling error in this report, see Estimated Measures of Sampling Variability table below.
Note: The shaded area indicates the range between the historical minimum and maximum values for the weekly series from 2019 through 2023. The dashed vertical lines indicate current and year-ago weekly periods.
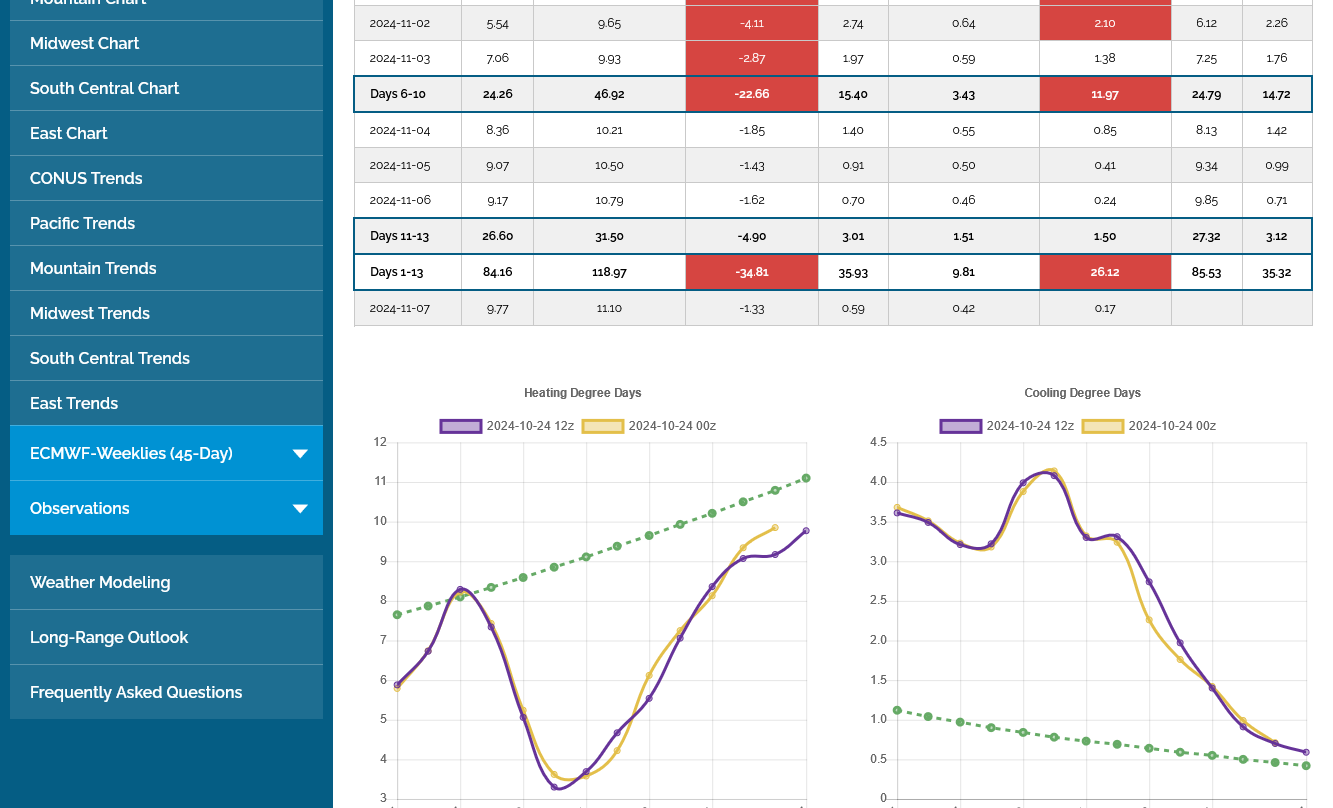
+5 HDDs on the last 0Z European model. All in week 2. Purple line on the left. Not a pattern change, just individual days cooler. October is too early for this to inspire the bulls, although we saw price strength after it came out and highs around 6:30 am before funds came in and pushed us a bit lower for the day.
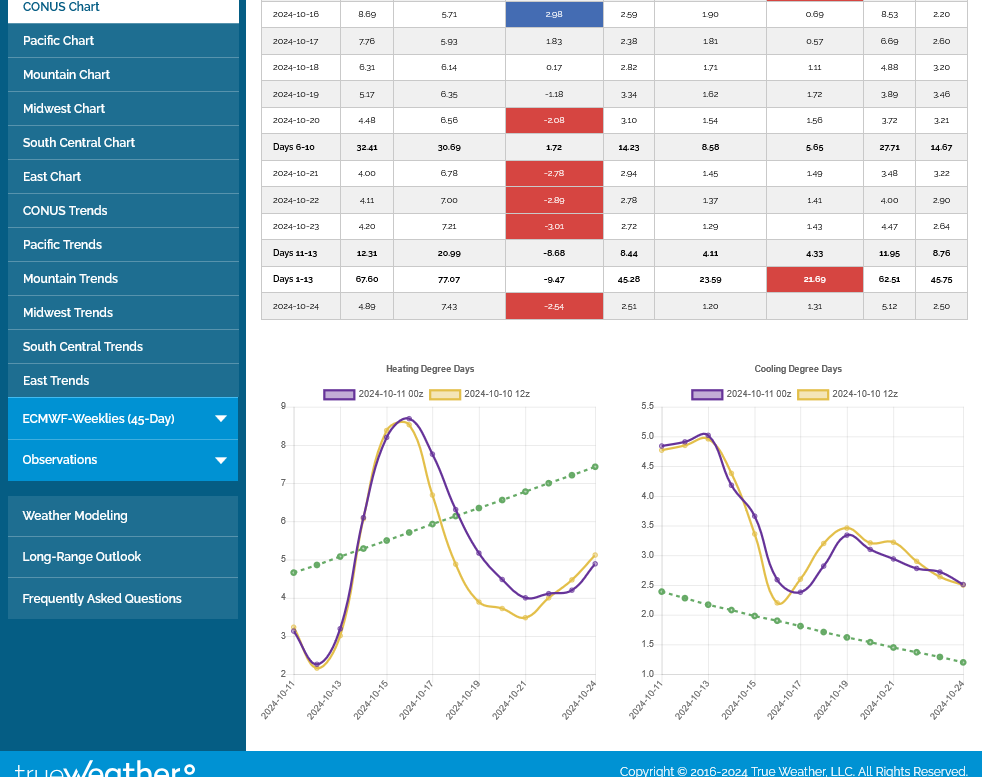
In week 2, the no longer important CDDs on the right, actually spike above the now more important HDDs on the left but the both combined in late October are too low to be significant. This was the last 0z European model solution out 15 days.
Note the green lines below which are the historical averages. On the left, the rapidly increasing HDDs(heating demand). On the right, the rapidly falling CDDs(cooling demand). HDDs start swamping CDDs by the end of October!
temps for the EIA storage report: Mild most places, chilly along the East Coast/Northeast:
https://www.cpc.ncep.noaa.gov/products/tanal/temp_analyses.php
![]()
metmike: +163 Bcf vs the 5 year average. Down another 13 Bcf in the last week as the storage surplus continues to shrink. Note the current storage in blue on the graph.
https://ir.eia.gov/ngs/ngs.html
for week ending October 11, 2024 | Released: October 17, 2024 at 10:30 a.m. | Next Release: October 24, 2024
| Working gas in underground storage, Lower 48 states Summary text CSV JSN | |||||||||||||||||||||||||
|---|---|---|---|---|---|---|---|---|---|---|---|---|---|---|---|---|---|---|---|---|---|---|---|---|---|
| Historical Comparisons | |||||||||||||||||||||||||
| Stocks billion cubic feet (Bcf) | Year ago (10/11/23) | 5-year average (2019-23) | |||||||||||||||||||||||
| Region | 10/11/24 | 10/04/24 | net change | implied flow | Bcf | % change | Bcf | % change | |||||||||||||||||
| East | 893 | 873 | 20 | 20 | 890 | 0.3 | 865 | 3.2 | |||||||||||||||||
| Midwest | 1,067 | 1,041 | 26 | 26 | 1,042 | 2.4 | 1,031 | 3.5 | |||||||||||||||||
| Mountain | 287 | 286 | 1 | 1 | 247 | 16.2 | 219 | 31.1 | |||||||||||||||||
| Pacific | 293 | 293 | 0 | 0 | 279 | 5.0 | 279 | 5.0 | |||||||||||||||||
| South Central | 1,166 | 1,137 | 29 | 29 | 1,141 | 2.2 | 1,147 | 1.7 | |||||||||||||||||
| Salt | 293 | 275 | 18 | 18 | 280 | 4.6 | 286 | 2.4 | |||||||||||||||||
| Nonsalt | 872 | 861 | 11 | 11 | 861 | 1.3 | 861 | 1.3 | |||||||||||||||||
| Total | 3,705 | 3,629 | 76 | 76 | 3,598 | 3.0 | 3,542 | 4.6 | |||||||||||||||||
Totals may not equal sum of components because of independent rounding. | |||||||||||||||||||||||||
Working gas in storage was 3,705 Bcf as of Friday, October 11, 2024, according to EIA estimates. This represents a net increase of 76 Bcf from the previous week. Stocks were 107 Bcf higher than last year at this time and 163 Bcf above the five-year average of 3,542 Bcf. At 3,705 Bcf, total working gas is within the five-year historical range.
For information on sampling error in this report, see Estimated Measures of Sampling Variability table below.
Note: The shaded area indicates the range between the historical minimum and maximum values for the weekly series from 2019 through 2023. The dashed vertical lines indicate current and year-ago weekly periods.
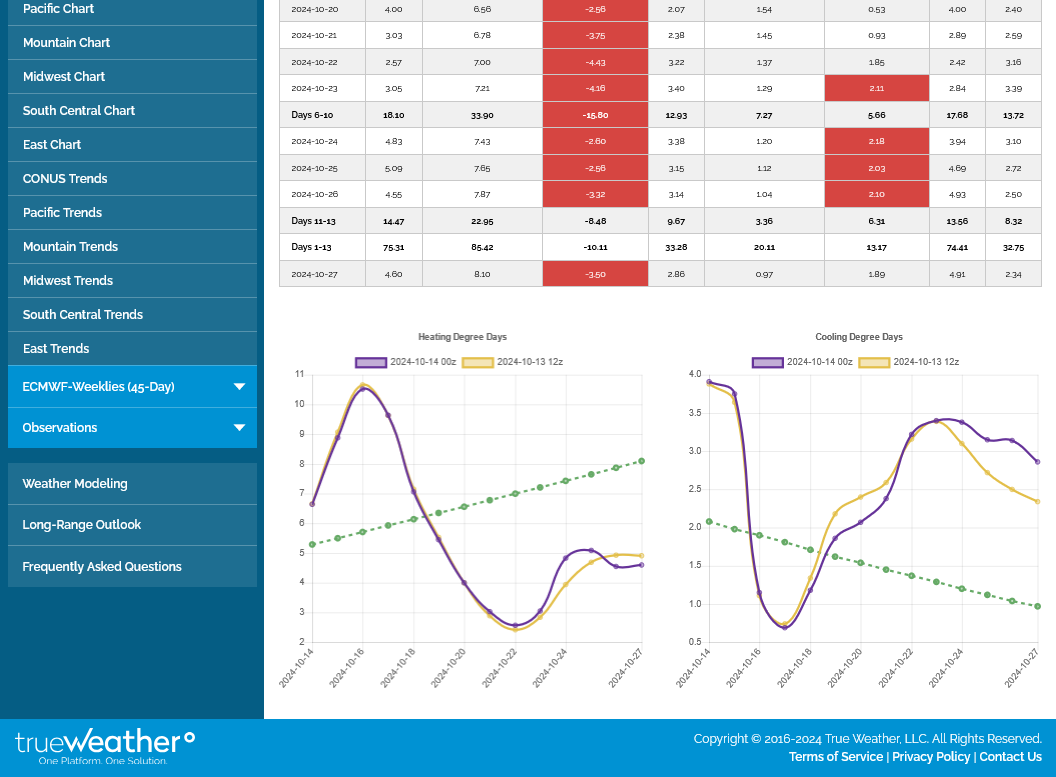
During the heating season, temperature and HDD forecasts rule!
The last 0z European model was -4 HDDs vs the previous 12z run on the left. Green lines are the historical average. We can see them soaring higher for HDDs on the left and plunging for CDDS on the right. We should note how LOW that CDDs are on the left vs the green average. They are seasonally high for CDDs on the right but we are too late in the year for that to amount to anything.
The magnitude of the scale between the left graph and the right graft is much different which gives the false illusion of greater importance for the CDDs on the right. THEY DON'T MATTER TO THE PRICE FOR TRADERS ANYMORE THIS YEAR!
For instance, at the end of October, the average CDDs=1
At the end of October, on this graph, the average HDDs =9
Same very bearish/mild forecast. -1 HDDs on this last 0z European model(vs the previous 12z run) in purple on the left.

How much lower can natural gas go in such a short time frame???
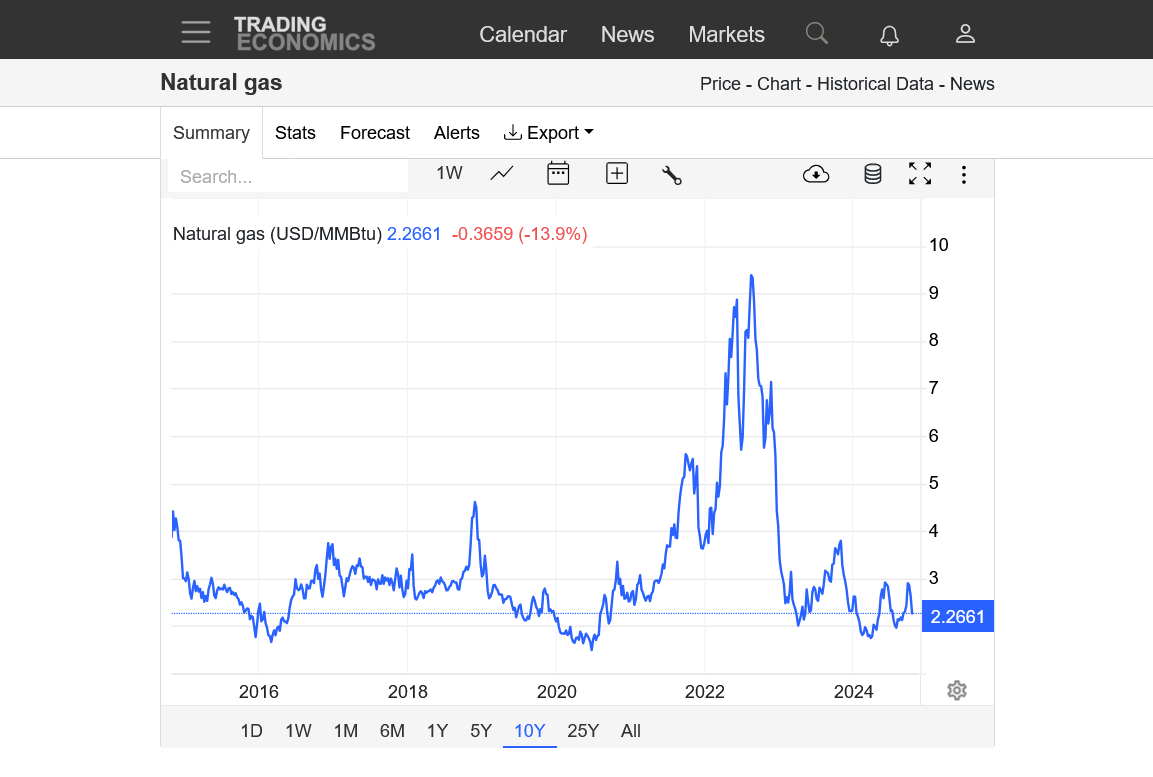
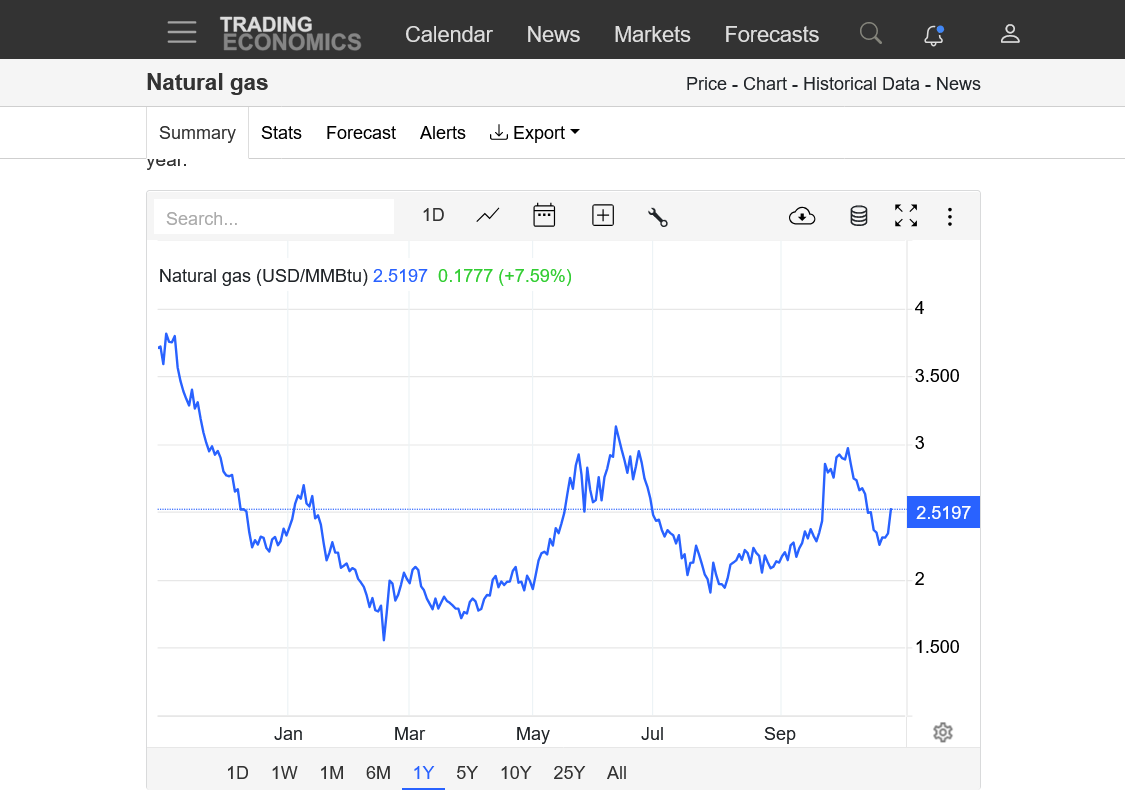
https://tradingeconomics.com/commodity/natural-gas
1. 1 month -7,000+/contract in just 2 weeks!!
2. 1 year-1 year ago, the price was $15,000/contract higher than this. Then we had the mildest Winter ever and crashed to half the price and end of WInter lows with a record smashing surplus in storage. Double top with June then October highs.
3. 10 years-August 2022 highs stand out. Which provided financial incentive for the biggest increase in supplies in history, starting in Sept. 2022.

Just out 12z European model in purple. Near record LOW/BEARISH HDDs on the left.
CDDs on the right don't matter anymore and are shown on a scale that is 40% LESS than the HDD scale, which makes them look more impressive!

Thanks, Mike!
So, the rest of October through Nov 2nd is forecasted by the 12Z Euro ensemble mean to have HDDs <1/2 the normal. That means for CDDs probably near record high levels for the same period with ~3 times the normal. To put it into a different perspective, normally HDDs are 8 times as high as CDDs for this period, but they’re forecasted by this run to be only 1.25 times as high!
Pretty amazing, Larry!
we gapped lower on the open on the daily and weekly chart on the extremely bearish weather forecast.
will this end up being an exhaustion gap?
we have fallen so far and are so low that it’s hard to think of this as a downside breakaway gap which would be the normal interpretation with the weather so bearish……if we were higher and if we hadn’t already been trading very bearish weather the entire month.
We did in fact fill the gap quickly so the Formation is a gap and crap selling exhaustion!
The gap and crap selling signature on the price charts from Sunday evening is being verified with price strength overnight.
Probably the biggest factor inspiring the buying was a whopping +15 HDDs on the last 0z European model overnight!!! This is the purple line on the graph on our left. The previous, much milder 12z run is in tan.

This source below does NOT show gaps but the open last night was BELOW last weeks lows. We filled that gap and are modestly higher right now +$660/contract.
https://tradingeconomics.com/commodity/natural-gas
1. 1 day
2. 1 month
3. 1 year


https://www.tradingsim.com/day-trading/exhaustion-gap
This puts in an extremely bearish, gap and crap technical formation............in a condensed, extremely volatile short term time frame that is different that most gap and craps that occur from a buying exhaustion at the top of a long uptrend.(which marks the end of the bullish mentality).
GapandCrap buying(selling) exhaustion formation
1 response |
Started by metmike - Aug. 30, 2019, 6:12 p.m.
https://www.marketforum.com/forum/topic/38044/
Island Reversal – Reversal Candlestick Pattern
Hey Mike,
Do you have the chart/graph showing the 12Z Euro ens and its comparison to the 0Z? Did NG move on its release? TIA
Hi Larry,
I never made it back to my office/computer but did look at the last 12z Euro Ensemble and it was almost exactly like the previous 0z run.
The cumulative change was -1 HDDs.
On the graph.
It basically traced out the previous run closely with the same zigs and zags.
Same thing with this just out 0z run.
its just under -1 vs the previous 12z run from Monday.
+++++++++++++
9am:
Here's the copied image. Sorry that I couldn't do this earlier for you. Purple was the last 0z run. Tan was the previous one, yesterday's 12z run. After the huge +15 HDD solution on the 0z Monday run(compared to 12z Sunday) the last 2 have both been ~-1 HDDs.
+++++++++
Since this does not look like a pattern change to much colder(just changes in individual days of the same pattern) I'm not sure how much upside there is to it. Could just be a knee jerk, dead cat bounce from the 1 time +15 HDD adjustment.
Not much change again on HDDs. The 2 week totals are slowly going up because each added day at the end of the forecast is replacing a milder one early in the forecast. This is the 0z EE in purple on the left for HDDs and the previous one was from 12z Tuesday.

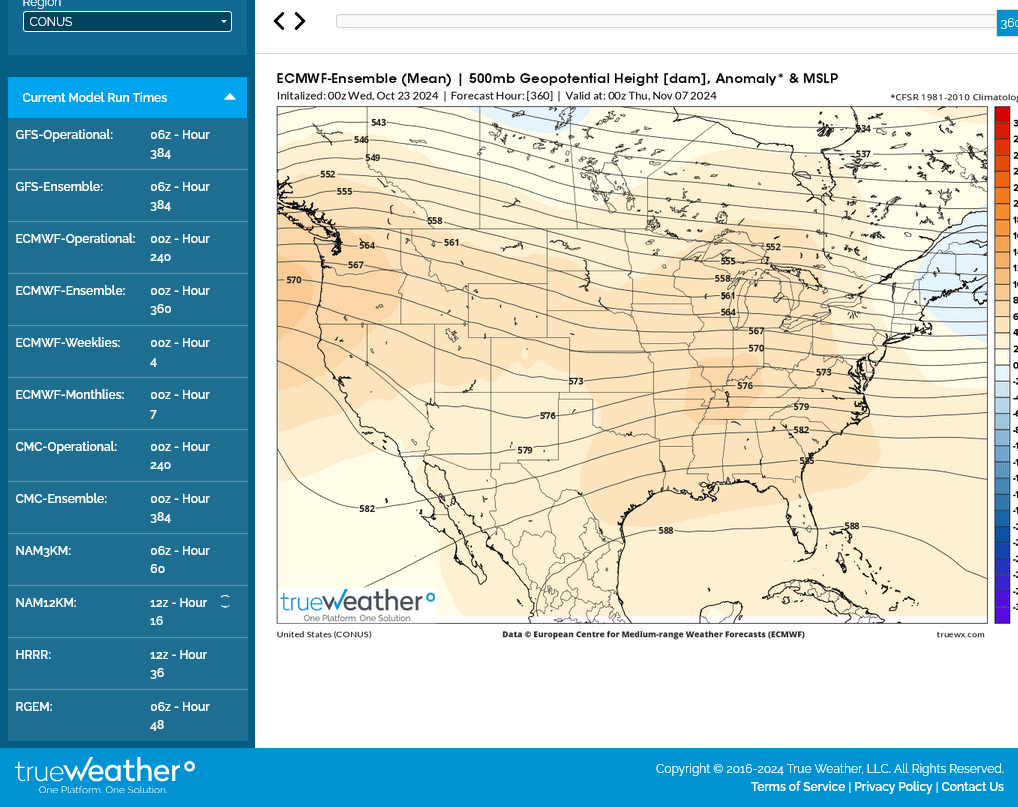
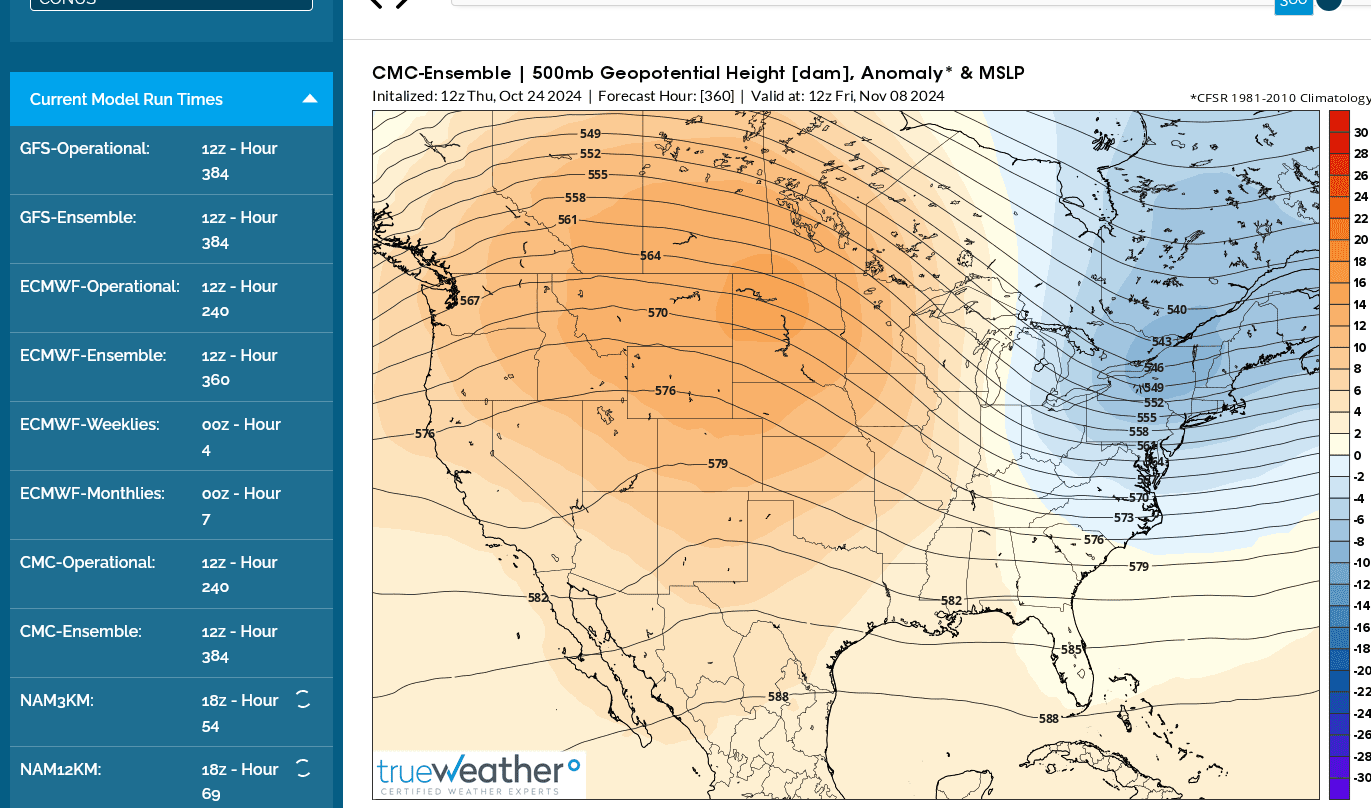
This is the 500 mb/upper level map at the end of 2 weeks, foreboding more mild weather as we head into mid November(that can change quickly). Mild, zonal flow with no connection to cold air masses that are brewing in the high latitudes from the angle of the sun dropping and days rapidly getting shorter in the northern hemisphere.
Interesting change in the 12z guidance!
The EE is +4 HDDs and it does, in fact show a pattern change to cooler at the end of the period with a ridge/west-trough/east configuration/couplet emerging.
NG spiked up more than 1,000/contract between 1:30p and 2pm, I assume from this.

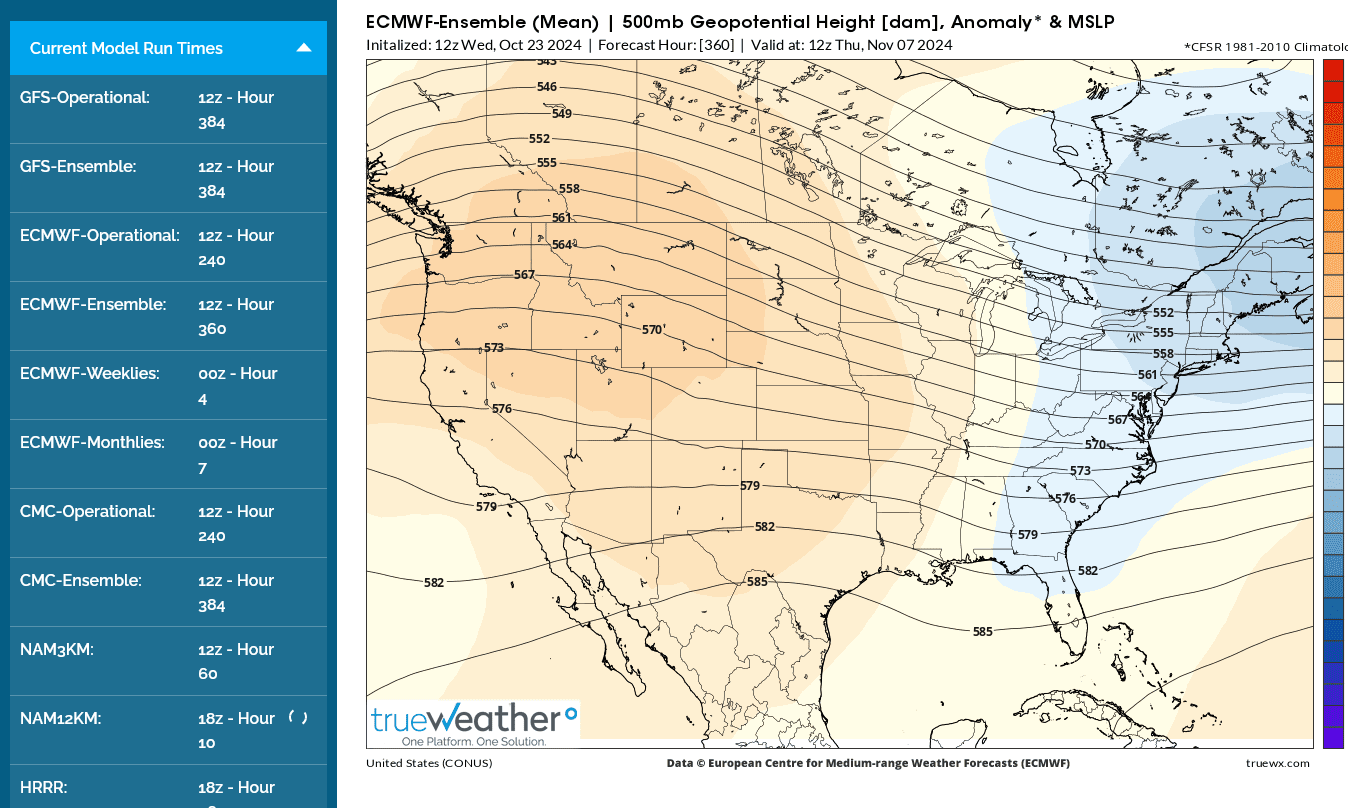
But the GEFS and Canadian models are completely OPPOSITE of the EE at the end of 2 weeks:


Last 0z Euro (purple line on the left) was +2 HDDs vs the previous 12z Wednesday run. It alone featured the ridge- West, trough-East couplet at the end of 2 weeks which is much cooler than the other models and less bearish.
In trading, less bearish can have the same impact on prices as BULLISH!!! The other models don't have this.
++++++++
Temps for the EIA this morning: Warm West, Chilly East.
https://www.cpc.ncep.noaa.gov/products/tanal/temp_analyses.php

Bearish EIA at +80 Bcf!!
+167 Bcf vs the 5 year average(blue line below) which is +4 Bcf compared to last week and a slight INCREASE in the surplus which has eroded by a total of 664 Bcf from the record smashing surplus at the end of last Winter.
https://ir.eia.gov/ngs/ngs.html
![]()
for week ending October 18, 2024 | Released: October 24, 2024 at 10:30 a.m. | Next Release: October 31, 2024
| Working gas in underground storage, Lower 48 states Summary text CSV JSN | |||||||||||||||||||||||||
|---|---|---|---|---|---|---|---|---|---|---|---|---|---|---|---|---|---|---|---|---|---|---|---|---|---|
| Historical Comparisons | |||||||||||||||||||||||||
| Stocks billion cubic feet (Bcf) | Year ago (10/18/23) | 5-year average (2019-23) | |||||||||||||||||||||||
| Region | 10/18/24 | 10/11/24 | net change | implied flow | Bcf | % change | Bcf | % change | |||||||||||||||||
| East | 901 | 893 | 8 | 8 | 905 | -0.4 | 884 | 1.9 | |||||||||||||||||
| Midwest | 1,088 | 1,067 | 21 | 21 | 1,068 | 1.9 | 1,056 | 3.0 | |||||||||||||||||
| Mountain | 291 | 287 | 4 | 4 | 251 | 15.9 | 223 | 30.5 | |||||||||||||||||
| Pacific | 300 | 293 | 7 | 7 | 282 | 6.4 | 281 | 6.8 | |||||||||||||||||
| South Central | 1,205 | 1,166 | 39 | 39 | 1,173 | 2.7 | 1,174 | 2.6 | |||||||||||||||||
| Salt | 314 | 293 | 21 | 21 | 295 | 6.4 | 298 | 5.4 | |||||||||||||||||
| Nonsalt | 891 | 872 | 19 | 19 | 879 | 1.4 | 876 | 1.7 | |||||||||||||||||
| Total | 3,785 | 3,705 | 80 | 80 | 3,679 | 2.9 | 3,618 | 4.6 | |||||||||||||||||
Totals may not equal sum of components because of independent rounding. | |||||||||||||||||||||||||
Working gas in storage was 3,785 Bcf as of Friday, October 18, 2024, according to EIA estimates. This represents a net increase of 80 Bcf from the previous week. Stocks were 106 Bcf higher than last year at this time and 167 Bcf above the five-year average of 3,618 Bcf. At 3,785 Bcf, total working gas is within the five-year historical range.
For information on sampling error in this report, see Estimated Measures of Sampling Variability table below.
Note: The shaded area indicates the range between the historical minimum and maximum values for the weekly series from 2019 through 2023. The dashed vertical lines indicate current and year-ago weekly periods.
The EE was actually -1.4 HDDs(bearish). But this is based on changes of individual days. The pattern change to cooler on the left/below is unmistakable from the steep upward slope in week 2!!
Also, the ridge-West, trough-East much cooler solution that it alone featured early in the week IS NOW THE SOLUTION FOR EVERY 12Z MODEL. THE CANADIAN MODEL, BELOW IS NOW THE MOST BULLISH!
Also, November natural gas expires SOON! Approach of expiration in the front month, historically has caused some big spikes up and down. NGX is up $2,000/contract today!
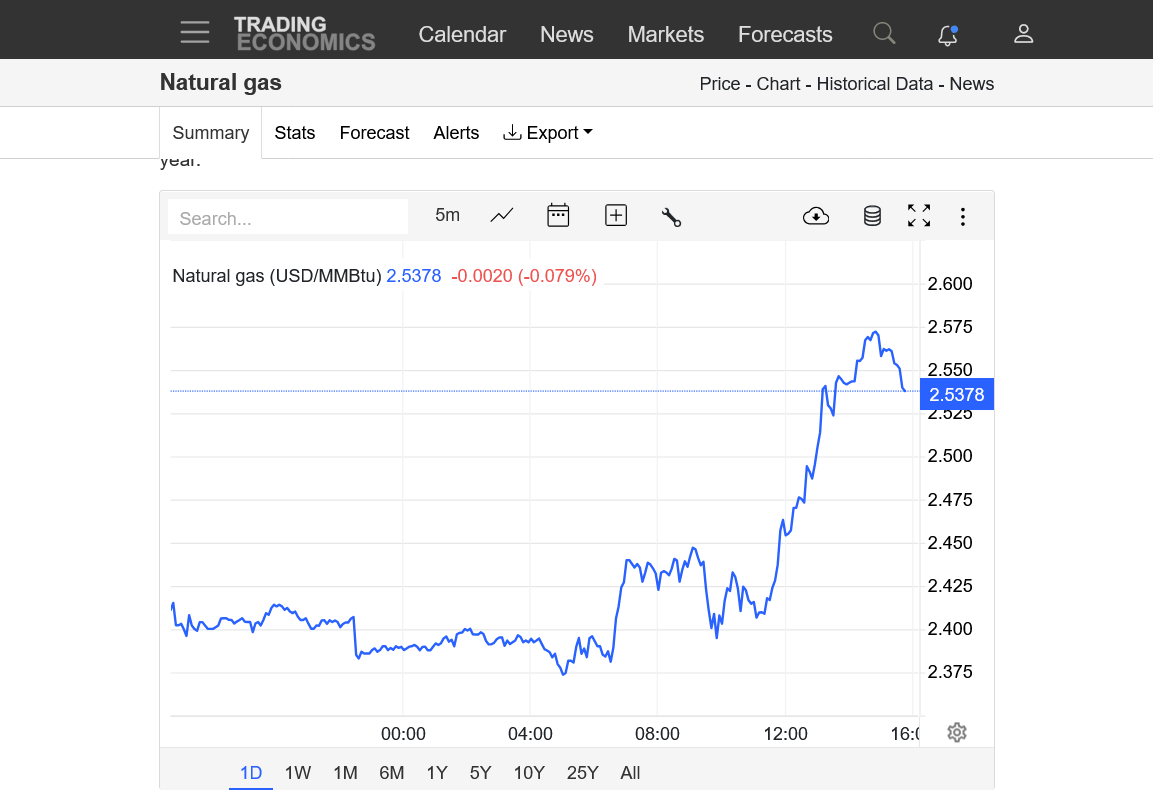
https://tradingeconomics.com/commodity/natural-gas
1. 1 day
2. 1 week
3. 1 month-the gap and crap selling exhaustion we told you about on Sunday Night has been solidly confirmed!
4. 1 year-symmetrical wedge formation: lower highs and higher lows!
5. 35 years


NG opened modestly lower, with an additional drop since then. Mild weather forecasts for November.
The front month, November has not expired yet.
8pm: We're trading around mid range now. December is -$750/contract.
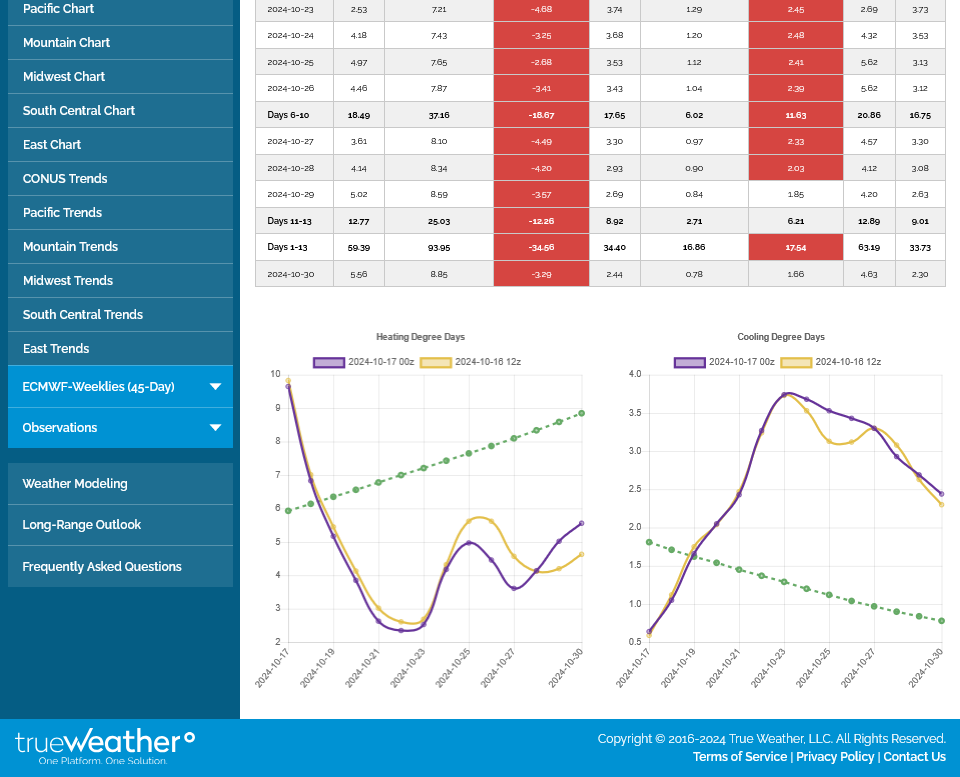
The last 0z European Ensemble was -5.5 HDDs (purple on the left) adding to the already bearish/mild weather forecast. The dashed green line is the rapidly increasing historical average. CDDs on the right are becoming negligible, thought they are currently unseasonably high.
The magnitude of the left scale/HDDs is almost 3 times higher than the right scale/CDDs......to reflect the seasonal difference.
The EIA report this Thursday should feature a VERY robust number with near record warmth greatly reducing the residential heating demand in many high population centers.
https://www.cpc.ncep.noaa.gov/products/tanal/temp_analyses.php

-2 HDDs on this just out EE model: Purple/left

+2.4 HDDs on the last EE below in purple on the left because of slight increases in individual days NOT a pattern change to colder. No sign for any serious cold, even well beyond 2 weeks.........so mild thru November right now.
WEATHER FORECASTS RULE NG TRADING in the heating season.
Very bearish EIA storage report coming up in 90 minutes.

EIA was BEARISH as expected. The amount in storage COMPARED TO THE 5 YEAR AVERAGE increased by 11 Bcf from 167 Bcf to 178 Bcf!! See the blue line on the graph below. With very mild weather coming up in much of November this is likely to increase even more.
NG is -$1,440/contract here near the end of the main trading session.
![]()
for week ending October 25, 2024 | Released: October 31, 2024 at 10:30 a.m. | Next Release: November 7, 2024
| Working gas in underground storage, Lower 48 states Summary text CSV JSN | |||||||||||||||||||||||||
|---|---|---|---|---|---|---|---|---|---|---|---|---|---|---|---|---|---|---|---|---|---|---|---|---|---|
| Historical Comparisons | |||||||||||||||||||||||||
| Stocks billion cubic feet (Bcf) | Year ago (10/25/23) | 5-year average (2019-23) | |||||||||||||||||||||||
| Region | 10/25/24 | 10/18/24 | net change | implied flow | Bcf | % change | Bcf | % change | |||||||||||||||||
| East | 919 | 901 | 18 | 18 | 920 | -0.1 | 901 | 2.0 | |||||||||||||||||
| Midwest | 1,109 | 1,088 | 21 | 21 | 1,093 | 1.5 | 1,079 | 2.8 | |||||||||||||||||
| Mountain | 291 | 291 | 0 | 0 | 254 | 14.6 | 225 | 29.3 | |||||||||||||||||
| Pacific | 305 | 300 | 5 | 5 | 284 | 7.4 | 281 | 8.5 | |||||||||||||||||
| South Central | 1,240 | 1,205 | 35 | 35 | 1,205 | 2.9 | 1,200 | 3.3 | |||||||||||||||||
| Salt | 331 | 314 | 17 | 17 | 309 | 7.1 | 312 | 6.1 | |||||||||||||||||
| Nonsalt | 909 | 891 | 18 | 18 | 896 | 1.5 | 888 | 2.4 | |||||||||||||||||
| Total | 3,863 | 3,785 | 78 | 78 | 3,756 | 2.8 | 3,685 | 4.8 | |||||||||||||||||
Note: EIA will begin publishing estimates of working natural gas stocks and the net change in working natural gas stocks based on a new sample selection in the Weekly Natural Gas Storage Report (WNGSR) on November 21, 2024, with the report for the week ending November 15, 2024. On Monday, November 18, 2024, EIA will revise eight weeks of previously released estimates to gradually introduce estimates from the new sample. Totals may not equal sum of components because of independent rounding. | |||||||||||||||||||||||||
Working gas in storage was 3,863 Bcf as of Friday, October 25, 2024, according to EIA estimates. This represents a net increase of 78 Bcf from the previous week. Stocks were 107 Bcf higher than last year at this time and 178 Bcf above the five-year average of 3,685 Bcf. At 3,863 Bcf, total working gas is within the five-year historical range.
For information on sampling error in this report, see Estimated Measures of Sampling Variability table below.
Note: The shaded area indicates the range between the historical minimum and maximum values for the weekly series from 2019 through 2023. The dashed vertical lines indicate current and year-ago weekly period
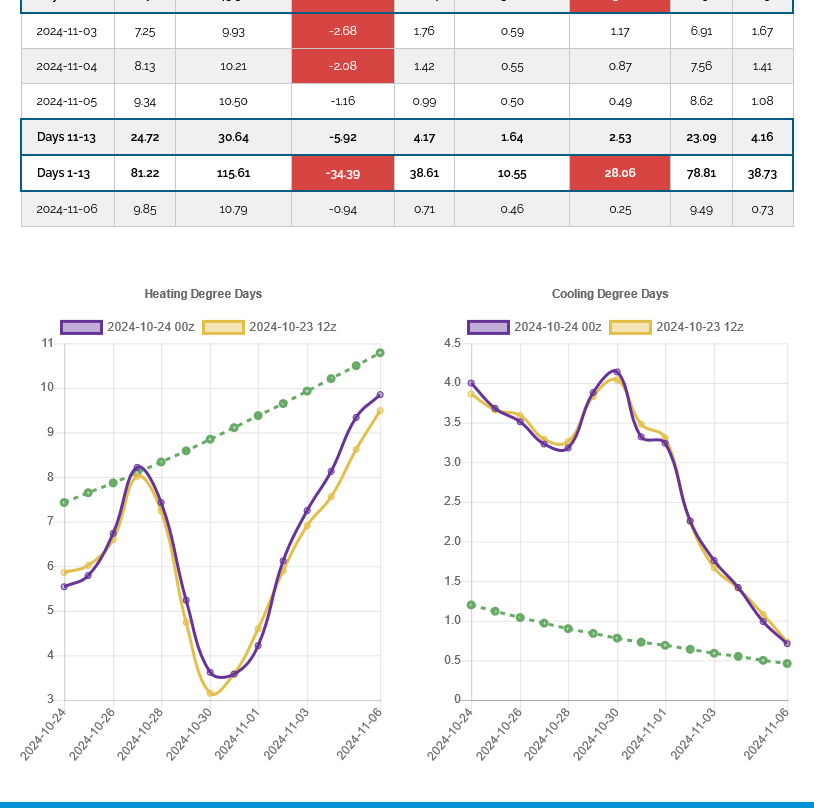
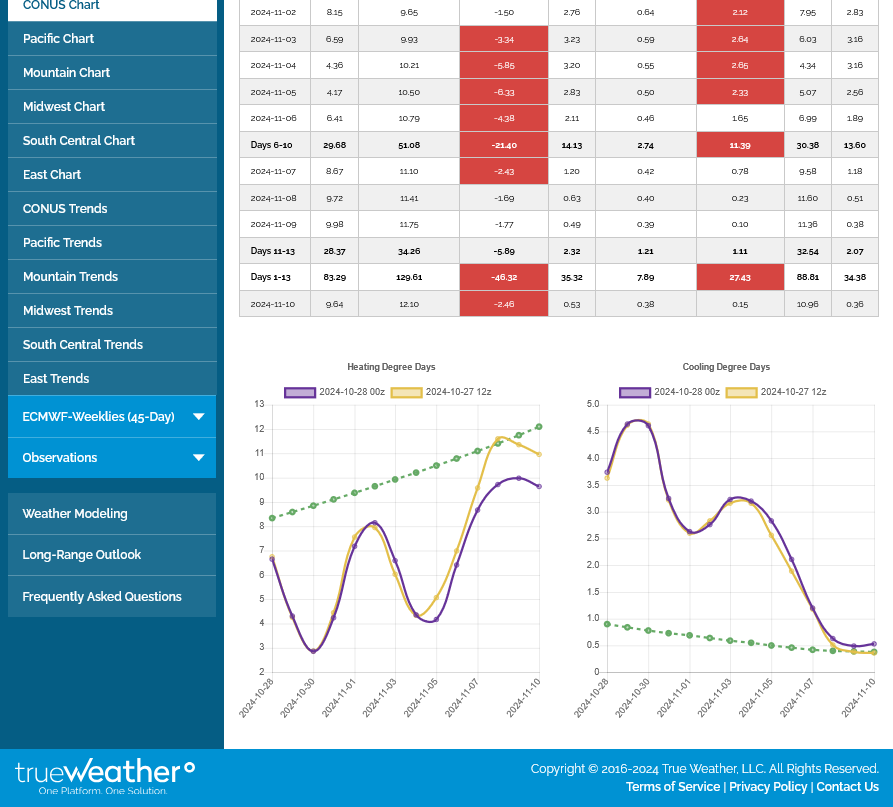
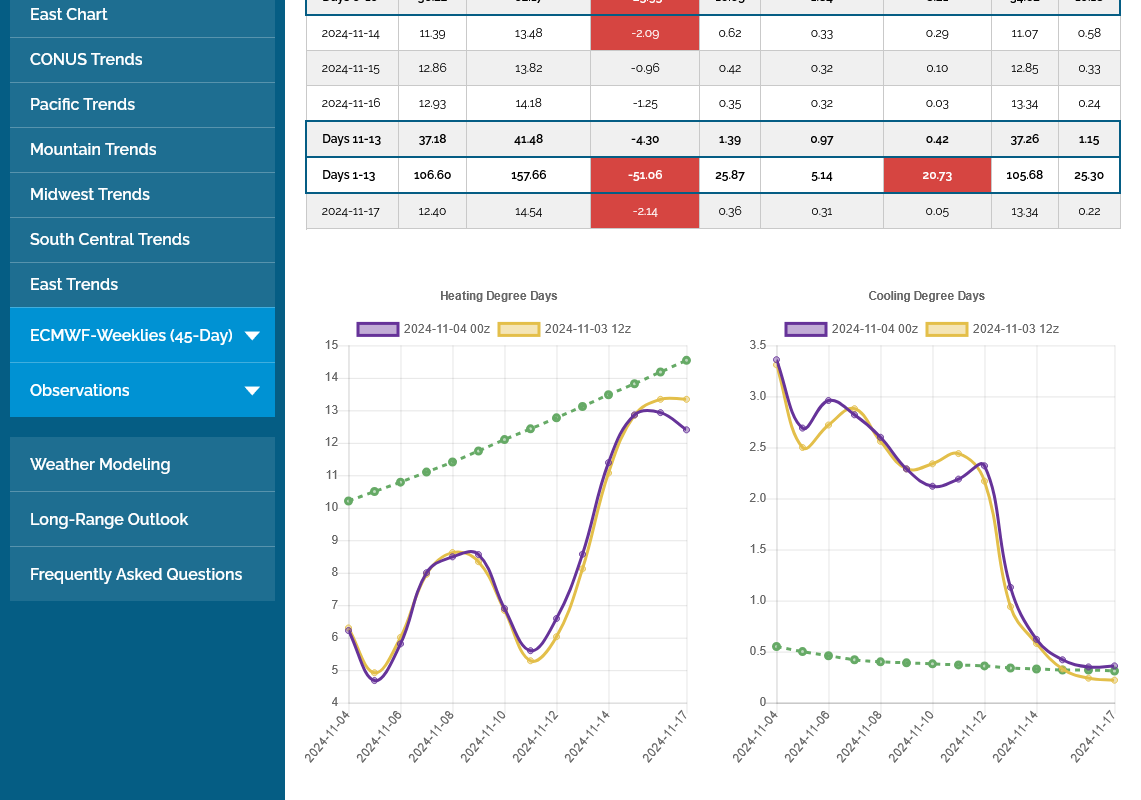
This was the European Ensemble models latest 45 day outlook(purple-HDDs on the left).......into early December.
-9 HDDs vs the previous run on Monday(10-28-24)
Continued mild and bearish! Well below the historical average in green, which is ramping up at this time of year.
NGZ is down over $3,000/contract this week because of the weather forecast.

Last 0z EE is -6.7 HDDs(left/purple). Pretty bearish but NGZ is unchanged.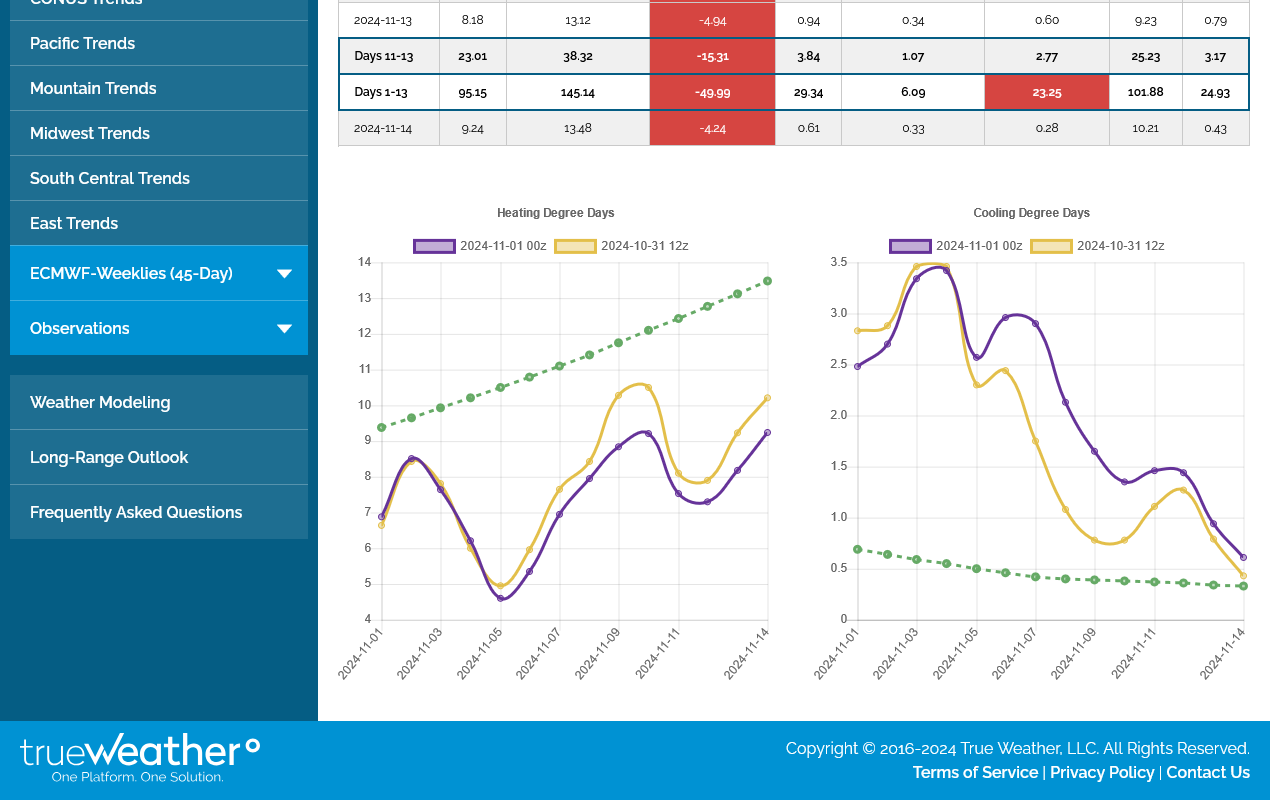
Low skill weeks 3 and 4 maps were updated today as they always are on Friday PM.
No sign of any cold yet, thru the month of November. NG prices tanked this week as a result.
https://www.cpc.ncep.noaa.gov/
We had a sizeable gap lower on the open and that was the low so far.. we tried to fill the gap but failed so far because the forecasts for november are too mild and bearish. Filling the gap is a gap and crap bearish selling exhaustion.
The latest Euro Ensemble below in purple. Previous on in tan. HDDs are on the left. They are well below the average, plotted in green.
9am: we filled the gap, which means a gap and crap selling exhaustion last night. I am NOT seeing weather cold enough to inspire aggressive buying, so it's NOT weather. Could just be tied to cuts in production that have whittled down our surplus thru much of the year........or something else I don't know about.
Natural gas intelligence doesn't know either:
Natural gas futures floundered early Monday, extending a prolonged slump amid bearish fundamentals.