Karen Braun@kannbwx·
Thanks for getting us started early on the Pro Farmer Crop Tour, cutworm!
It should be interesting to read/hear their comments next week.
Let us know how much wonderful, welcome rain you get from this current system:
https://www.eldoradoweather.com/radar/national-doppler-radar-full-resolution.html
Received 3/4 inches of rain today.
Crops look excellent here. After having little rain in June, we have had rain once a week here since the hurricane the first part of July gave us 5 inches.
Starting to see Tar Spot on corn leaves. but corn here is end of dough to denting. If it had come sooner, I would have had to spray fungicide a second time. At $40 / acre and $3.30 corn, not wanting to do that.
Beans look good so far. A very important time just ahead. Seeing some Suden Death Syndrome in some local fields but so far not mine.
Price is going to put a lot of red ink on those who did not hedge earlier.
JMHO
Thanks, cutworm!
Congrats on the rain, although the corn might just prefer cool weather to maximize filling.
Do you have any beans this year?
We got 0 in the southwest part of our state. Now over 2 weeks since the last drop. How about you, mcfarm?
I still have hope(50% chance) of a rain with the upper level trough over us into Sunday.
There's a ton of instability and vorticity aloft on this map from the European model for Saturday. What often happens is that the models inability to forecast specific locations for convection will cause them to be blind to seeing rain, especially in pattern like this.
What I am talking about is the likelihood of an impossible to see or time perturbation(or 2) in the strong, counterclockwise flow rotating around the western side to the base of the trough below that's capable of generating an organized line of t-showers ahead of it.
The yellows, especially darker colors are the absolute vorticity, which will be very positive/increasing (for Summer) on Saturday. This creates the lift needed for t-showers.
We'll see if it happens.
Do you have any beans this year?
Yes
Beans look good so far. A very important time just ahead. Seeing some Suden Death Syndrome in some local fields but so far not mine.
mcfarm got 1.3 at the home place.....very thankful....but further south our crops are later and needed it more but were left short. And then even further south {around Seymour} some 3 inches was reported
Glad that you guys got some rain.
Not a drop here. We had just over an inch at the very start of August, otherwise, we might have set a record for the driest August in history….in fact the driest month ever with 0.00.
At least temps have been mild much of the time. Maybe we’ll get lucky on Saturday.
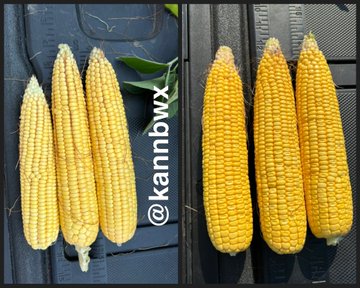
The crop tour scouts were tweeting/texting the results as they tested each field as they have been each year.
Including this young lady (crop scout) that I admire greatly for the quality of the information that she provides to her readers.
I've copied THOUSANDS of her posts and wonderful graphs..........some of the best on the internet.
She's a crop scout on the Western Leg of the tour again this year.
Here's some of her stuff from today. Honestly, its impossible for me to keep up with every message from every scout on this tour. She's a great source though and every evening, Pro Farmer will broadcast what they measured that day. here:
Karen Braun
@kannbwx
Global Agriculture Columnist at Thomson Reuters. Meteorologist by training, gymnast for life. Views expressed are my own.
·
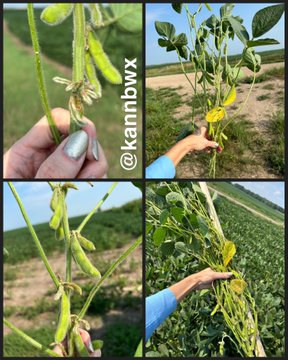
Average pod counts for #soybeans in a 3x3 foot plot in northeast Nebraska (Knox, Cedar, Pierce Counties) on #pftour24. Same route through four stops: 2024: 1003 2023: 1295 (1 irrigated) 2022: 1200 (1 irrigated) 2021: 1057

·
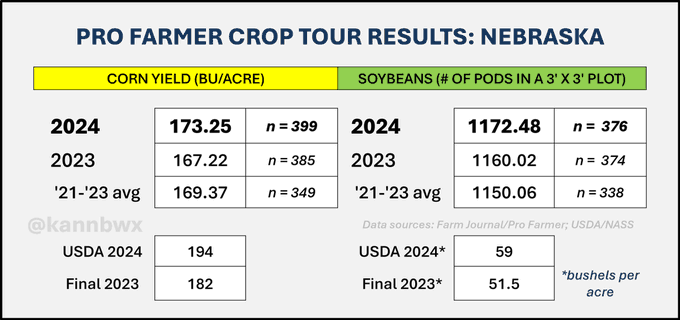
But this data doesn't blend as well as corn with the state historical data. Record soy yield in Neb in 2021 at 63 bu/acre followed by 2022- 49, 2023- 51.5, 2024- 59 (projected). The actual PF tour data from the full state does reflect this trend, though.
Karen Braun@kannbwx·But this data doesn't blend as well as corn with the state historical data. Record soy yield in Neb in 2021 at 63 bu/acre followed by 2022- 49, 2023- 51.5, 2024- 59 (projected). The actual PF tour data from the full state does reflect this trend, though.
 @cattlemen@cattlemen1979·
So below expectations
Done in South Dakota 10 stops, same exact route as last year (but 8 stops last year). Average #corn yield 152.4 bpa (range 103-193) vs 180.7 last year. Culprit = Inconsistent ear counts. Avg pods for #soybeans = 1249 in a 3x3 foot plot vs 1240 last year. #pftour24
 Ted Seifried@TheTedSpread·
2nd stop in Dixon Co, NE. Much drier here and corn is further along. 175.5 #pftour24
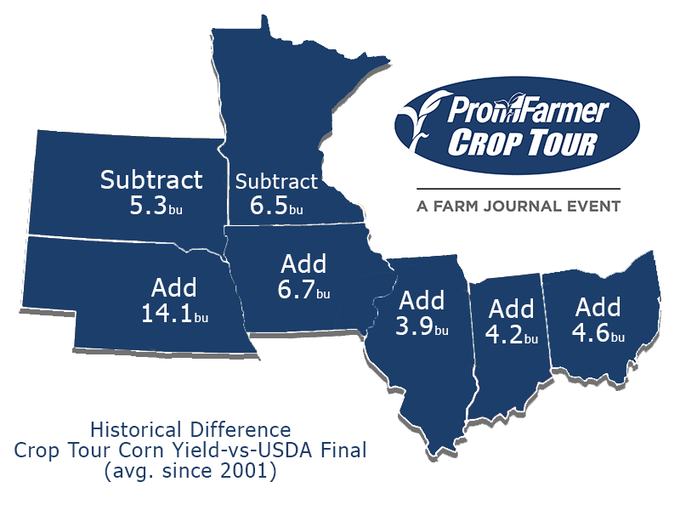
 Pro Farmer
·
We know the corn yield calculated during Crop Tour will be different than USDA’s final yield for each state. Fortunately, we know by how much on average. There are reasons for the differences & understanding them makes Tour yields valuable. https://zurl.co/iDl1#pftour24
++++++++++++
This doesn't seem to speak very well for the accuracy of this tour compared to reality but the key thing is to compare the tour in 2024 with the tours from previous years.
M,
China had some major flooding this summer. Have you seen any estimates of crop losses over there? They maybe will import more ~
Thanks, beckah,
I know nothing about this.
seems this tour is a repeat of past years. This guys volunteer to go out usually on hot, humid nasty days and wonder thru corn and bean fields and collect samples. Then go thru the task of counting and re-counting to double check numbers. After all that work they turn in yields just like this year. 6 Bu under in South Dakota and 5 under in Ohio so far. Then on Friday nite they have this big meet where the administrators come in and massage the numbers to magically just flat out guess and number that the market automatically trades as fact. Many the year all the number come in lower than expected until Friday nite. This year looks to be the nearly the same
I hear you, mcfarm.
That's why we should compare 2024 with THEIR PREVIOUS YEARS(as you noted) and not other 2024 metrics, like the USDA.
Pro Farmer even tells us to do that.
here is an example. In 2023 pro farmer had Indiana at 180. If that helps compare pro farmer to pro farmer. Like different people on the tour every year
Indiana #corn yields on #pftour24 averaged 187.54 bu/acre, the highest since 2021 and up 3.7% from last year. USDA sees corn yield up 2% YOY. Massive pod counts for #soybeans, the tour's highest since 2002 and +7.6% YOY. USDA's record Indiana soy yield forecast looking good.
Nebraska #corn yield samples on #pftour24 averaged 173.25 bu/acre, up from last year but below 2021's 182.35. USDA has 2024 corn yield = 2021's record. Pod counts for #soybeans were a 3yr high though below the 1200+ years of 2018-2021.
++++++++++++++
From Monday:
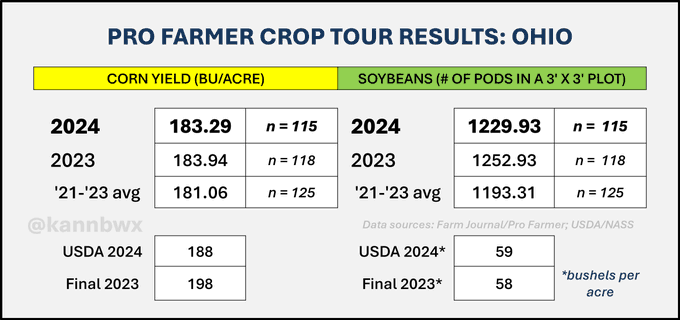
#Pftour24 pegs Ohio #corn yield at 183.29 bu/acre, down fractionally from last year's tour. USDA has corn yield down 5% YOY. Pod counts for #soybeans are off nearly 2% from 2023, but USDA is looking for a record yield in 2024.
#Pftour24 finds South Dakota's #corn yield down fractionally from last year at 156.51 bu/acre, though USDA sees yield up 7% from 2023. Pod counts for #soybeans rose 1.3% from last year's tour. USDA projects South Dakota soy yield up 7% YOY.
Thanks much, cutworm!
Yields WILL be dropping in the ECB and vicinity the next 2 weeks. This was total rain for the next 2 weeks from the just out 12 GEFS. Crop condition reports in early September will deteriorate a couple %, maybe a bit more.
NOT good for the last few weeks of pod filling for beans. 
I can't help but contrast another year of record yields with what the IPCC and left politicians/MSN have been warning us for 3+ decades would happen.
Photosynthesis has not been outlawed by these anti science cruds.
The Midwest has continued with the best weather/climate (last 3 decades) since humans have recorded weather in the United States.
+++++++++++++++++++++++++++
Re: Re: National Climate Emergency??????????!!!!!!!!!!!
The last 30 years or weather/climate/CO2 have been the best for life on this planet since BEFORE the Medieval Warm Period 1,000 years ago that was this warm.
In the Midwest SUMMERS, climate change has REDUCED EXTREME HEAT for instance.......though thats an exception, thanks to photosynthesis and evapotranspiration/higher dew points/moisture.
Extreme, long lasting and widespread droughts almost never happen anymore.
Summer Climate Change in the Midwest and Great Plains due to Agricultural Development during the Twentieth Century

+++++++++++++
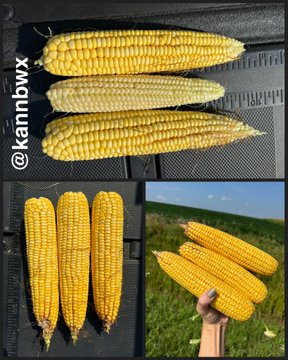
MASSIVE YIELDS IN IL AND PART OF IA!
This was from Wednesday. Apologies for not posting it late yesterday when it came in.
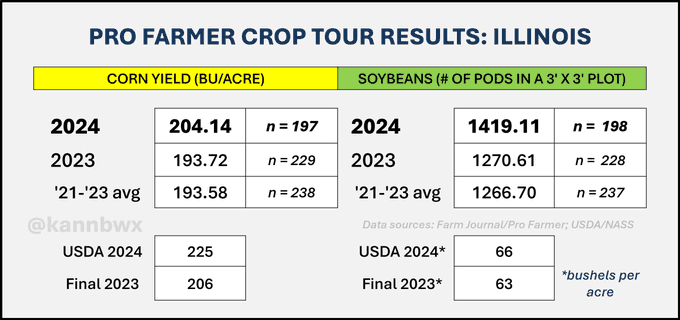
Illinois #corn yield samples on #pftour24 averaged a record 204.14 bu/acre, up 5.4% YOY, topping the old tour high of 196.96 from 2014. USDA has IL corn yield +9% YOY. Pod counts for #soybeans were the tour's highest since 2000 and up nearly 12% YOY. USDA has soy yield +5% YOY.
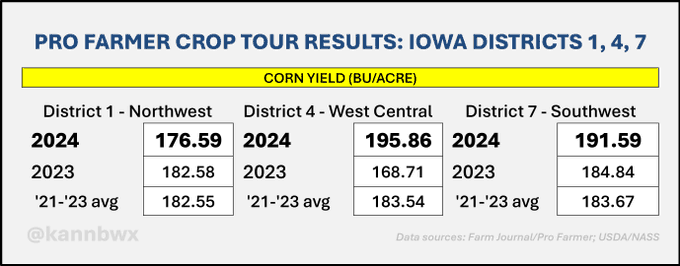
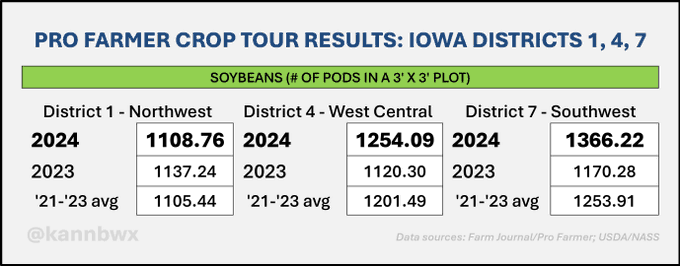
#Pftour24 finds mostly strong #corn potential in western Iowa. Average yields in the west central & SW districts were above average but shy of the 2021 levels, when Iowa posted a record corn yield. But NW yields were the tour's lowest since at least 2016. Too much early rain.
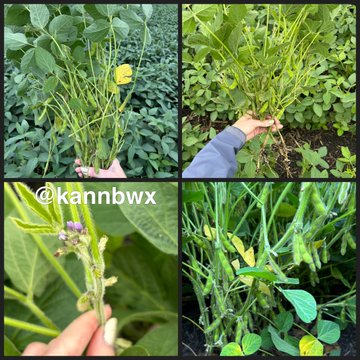
solid potential for #soybeans in western Iowa. Excessive spring rains in the northwest limited pod counts to average levels, but pod counts in the west central and southwest districts were notably above the recent tour averages.
metmike: The Southwest MN CORN crop showed big problems today. Excessive rains earlier this year!!
https://www.marketforum.com/forum/topic/83844/
"One of the biggest problems has been TOO MUCH rain in the Upper Midwest.
DRY/FLASH DROUGHT Eastern Cornbelt.
This is the rain from the last week as of June 21, 2024"

·
10 stops along my route in southwest Minnesota. Not a single #corn field looked good from the road, and that largely held true inside. Corn was yellow and uneven everywhere. Average yield 164 bu/acre. This same route was 177 last year, 210 in 2022 and 201 in 2021. #pftour24
·
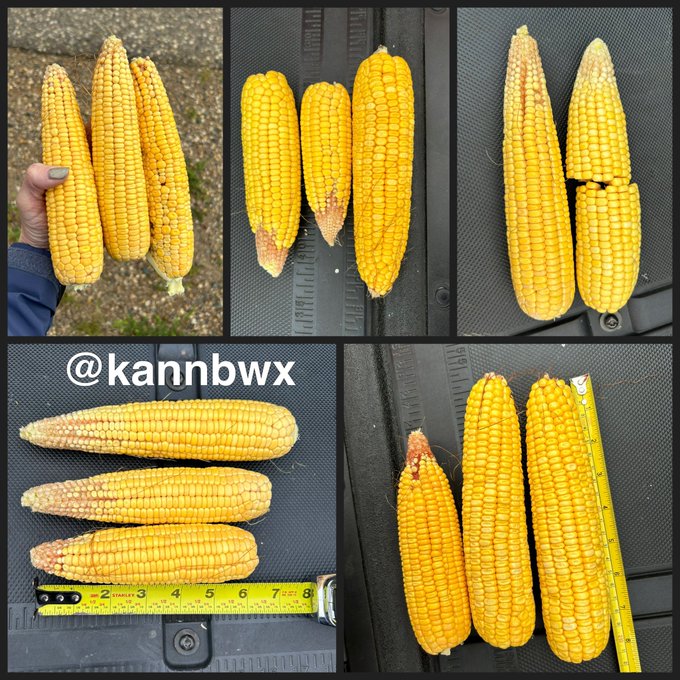
Five #corn stops in SW Minnesota (Nobles, Murray, Cottonwood Counties). Average yield 154.6 bu/acre. Safely the lowest for this stretch in at least 3 years (2023- 178.1, 2022- 225.4, 2021- 211.4). Ear counts have mostly been okay but grain/ear length has been a problem. #pftour24
#Soybeans along my SW Minnesota route on #pftour24 have been better than last year but not as good as in 2021 or 2022. Through 5 stops (average # of pods in a 3x3' plot): 2024- 1194 2023- 1014 2022- 1222 2021- 1252
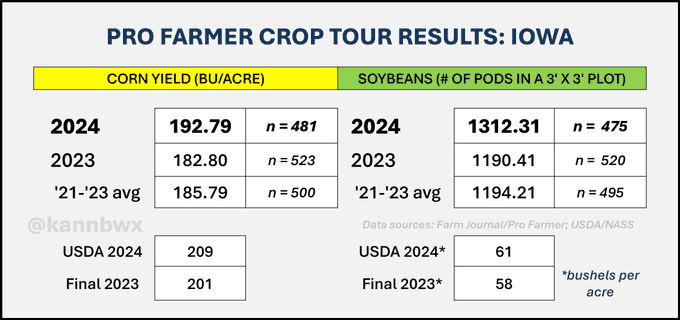
#Pftour24 measures Iowa #corn yield at 192.79 bu/acre, a tour record and up 5.5% on the year. USDA has Iowa corn yield at a record 209, up 4% YOY. Pod counts for #soybeans were up 10% YOY and close to the tour's 2010 record of 1347 pods. USDA pegs IA soy yield up 5% YOY.
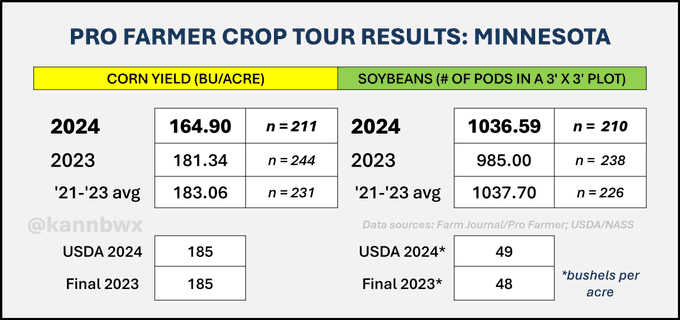
#Pftour24 measures Minnesota #corn yield at 164.9 bu/acre, the tour's lowest since 2012 and down 9% from 2023. USDA has MN corn yield unch YOY. Pod counts for #soybeans were near the 3yr avg, and USDA sees MN soy yield slightly above the 3yr avg.
+++++++++++++++++
Given that both USDA and PF are looking for a national corn yield well above the current record (which 2021 was just shy of), corn in non-tour portions of these states (particularly Illinois & Minnesota) needs to be very strong to offset some of the weaker areas.
Pro Farmer U.S. yield estimates (use data from #pftour24 plus other factors like weather):#Corn 181.1 bu/acre (-1.1% from USDA’s 183.1)#Soybeans 54.9 bu/acre (+3.2% from USDA’s 53.2) PF did not make changes to area, so production estimates are the same +/- % from USDA as yield.
The 7-state production-weighted average #corn yield on #pftour24 was not as good as what the tour found in 2021. But pod counts for #soybeans were easily better than in the previous four years. See follow-up post for what I think this means.
I can't help but remind everybody again, that climate change and the increase in CO2 has been a massive benefit to most life on this planet. It is best seen/proven at times like this IN THE REAL WORLD, when the Midwest(that has seen its best growing season weather/climate in recorded history, by a very wide margin the past 3 decades-because of climate change) set more record smashing yields.
Increasing CO2 not only increases yields from photosynthesis but it makes plants more water efficient(stomato don't need to open as wide to get CO2, which reduces water loss from the roots via transpiration).
It also increases crop tolerance to heat.
That is the AUTHENTIC science:
https://www.marketforum.com/forum/topic/103492/
https://www.marketforum.com/forum/topic/103492/#103554
https://www.marketforum.com/forum/topic/103492/#103555
https://www.marketforum.com/forum/topic/103492/#103556
+++++++++++++
This does not stop natural variation in weather/climate. Even though we've only had 1 extreme, widespread drought since 1988, with the 1 in 2012, which is easily a record for LEAST DROUGHT in Midwest history...........when that inevitable drought does happen, we WILL hear that it was caused by climate change.
This will be a blatant, anti science, anti meteorology, anti climate, anti agronomy lie!
This will be despite the complete opposite from the man made micro climate benefits that have been created in the Midwest that cause a positive BENEFICIAL feedback loop during the growing season which dominates in most years.........but can't stop natural variability!
https://www.marketforum.com/forum/topic/103492/#105104