
Thanks much, Mike!
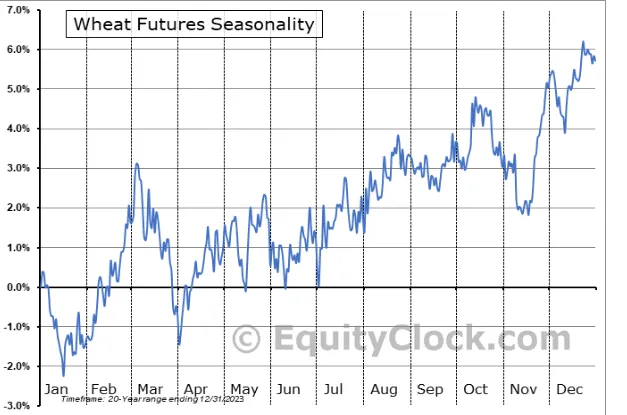
This has actually been a CONTRA seasonal move lower by wheat the past 2+ months!
In tandem with plunging C and S prices during that same time frame as they developed into record supply crops and helped pull wheat down.
Most recent 20 year seasonals:
https://planetarytrader.substack.com/p/wheat-seasonality
Previous seasonals prior to 2007.
https://www.seasonalcharts.com/future_farmprodukte_wheat.html

++++++++++++

During the planting months, spring for corn and soybeans and fall for winter wheat, the source of grain that is available for sale or purchase by end users is from the crops that were harvested during the previous harvest season—the old crop.
On the other hand, during the harvest months, typically July for winter wheat and November and December for corn and soybeans, the newly harvested crop comes to market and supply is higher—hence, the new crop.
Each grain commodity has one new crop futures delivery month and all others are old crop months.
When a new crop is harvested, there is once again a higher level of supply. This is why many of the grain markets tend to reflect their lowest seasonal prices during the new crop trading month.
Wheat markets have a tendency to decline between spring and the July harvest, then begin to rise from these harvest lows into fall and winter.
Wheat, even more than soybeans and corn(that have 2 main suppliers-The US and South America) is grown in many other countries with both Winter wheat AND Spring Wheat.
Winter Wheat is harvested at the end of Spring each year. The Spring Wheat harvest is just over halfway and this years Spring Wheat crop featured robust yields, though the market has know this all Summer.
Crop progress
+++++++++++++++++++++++
USDA August 12, 2024
7 responses |
Started by metmike - Aug. 12, 2024, 1:41 p.m.
https://www.marketforum.com/forum/topic/106589/
++++++++++++++++++++++
+++++++++++++
I have a great POTENTIAL wheat trade for you, identified WELL BEFORE it happens, when there is an opportunity for people here to make money instead of finding out 2 months AFTER the entry point.
See the evaluation next:
The Winter Wheat crop planting season is coming up. Starting from around mid September to as late as early November.
Waiting until after that doesn't give the wheat plants enough time before the cold hits to EMERGE and establish deep enough roots to survive the Winter well after going dormant.
The tillering of the wheat plants which defines the wheat stands, ideally should reach the Fekes 2.0 stage in the Fall BEFORE going dormant to maximize survival over the Winter months.
WHEAT GROWTH STAGES
https://stepupsoy.osu.edu/wheat-production/wheat-growth-stages-and-associated-management
The number of leaves present on the first shoot (main stem) can be designated with a decimal. For example, 1.3 is a single shoot with three leaves unfolded. The most significant event in achieving high yields is stand establishment, i.e, the number of plants or tillers per square foot. Late-planted wheat has less time to tiller and should be planted at a higher seeding rate to compensate for fewer tillers.
A tiller is a shoot that originates at the coleoptilar node. Tillers share the same root mass with the main stem (Figure 1). During tillering, the major management consideration is whether stands are adequate to achieve yield goals. Management inputs will not compensate for skimpy or erratic stands caused by insects, seedling diseases, poor seed quality, herbicide injury, etc. A producer may want to apply 20 to 30 pounds per acre starter N to promote tillering, especially if planting without tillage. Excess N applied at this time leads to a lush, vegetative growth which makes the crop more susceptible to winterkill and foliar fungal diseases. Adequate phosphorus (P) and soil pH above 6.0 are needed for good root and tiller development.
Winter wheat can continue to tiller for several weeks. Depending upon the planting date and weather conditions, tillering can either be interrupted by or completed prior to the onset of winter dormancy. Most of the tillers that contribute to grain yield are completed during this stage.
+++++++++++++
Armed with this knowledge BEFORE the crop is planted the next 2+ months, gives us the ability to predict how weather will likely impact the planting season,
Spring is usually our wettest season, so excessive rains/cold in the Spring can often impact corn and soybean planting.
Fall is our DRIEST season and this is usually the risk for planting the HRW crop(in the Plains) and SRW crop(Midwest/South).
There needs to be enough moisture in the soil to germinate the newly planted wheat seeds.
Even if you plant in timely fashion, bone dry soils can result in uneven germination and lack of development.
Bone dry soils in Winter also INCREASE Winter Kill because the cold WILL penetrate deeper and do more damage to plants, especially if they were not well established in the Fall, when there is no snow cover insulating the ground below it.
The potential trade setting up features the flash drought/drought in a large area of the SRW and HRW belt right now, ahead of the Winter Wheat planting season.
Keep in mind that the planting has not even started yet...........which also means the market has not even started trading this yet........which is why its the type of trade that you can actually make money on by seeing it BEFORE it happens.
++++++++++++++

The current soil moisture maps identify some problem areas for the Winter wheat crops from dryness.
Again, keep in mind that we have almost 2 months for some nice rains to enter the picture and recharge soil moisture enough to turn the weather from bullish to bearish.
The market is NOT concerned right now, knowing this.
If it continues to stay dry, its not whether the market will react bullishly or not but WHEN WILL IT DO THAT and how strong the upside will be.
I would contend that this already started early last week, see price charts on the next page.
I can't always predict the day to day movements .......but have crystal clearly identified the set up here and we always give you the updated weather forecasts.
This is exactly the type of trade that tjc loves the most. Picking tops and bottoms.......which this is basically trying to do with wheat.
Soilmoisture anomaly:
These maps sometimes take a day to catch up to incorporate the latest data(the bottom map is only updated once a week).
https://www.cpc.ncep.noaa.gov/products/Soilmst_Monitoring/US/Soilmst/Soilmst.shtml#


++++++++++++++++++++++++++++
Updated daily below:
https://mrcc.purdue.edu/cliwatch/watch.htm#curMonths
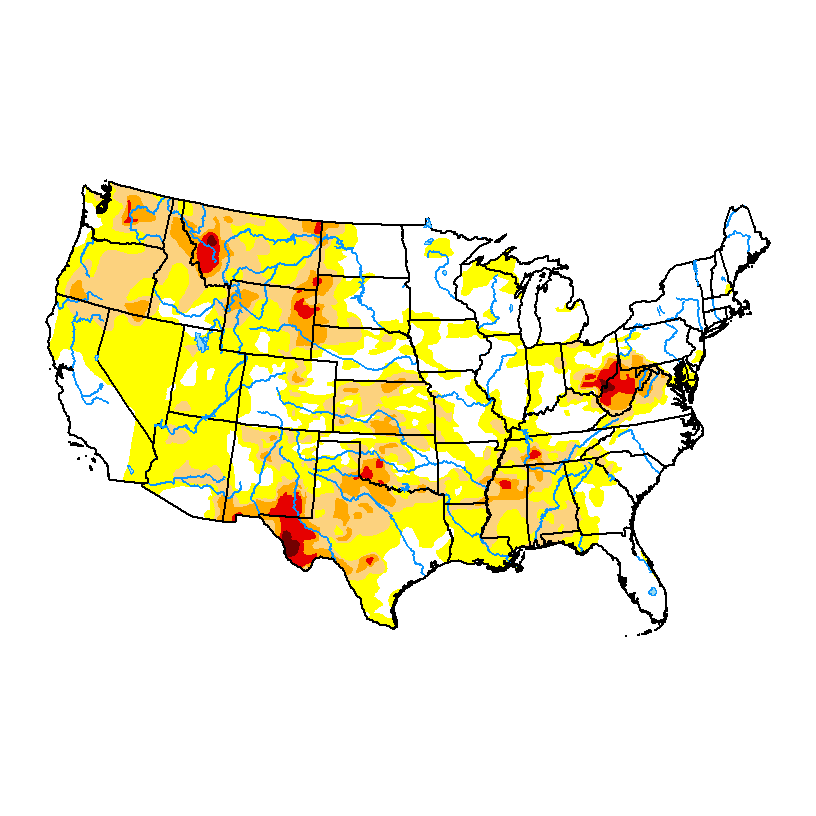
DROUGHT MONITOR
https://droughtmonitor.unl.edu/
August 27, 2024: Drought returning in the ECB
https://www.marketforum.com/forum/topic/83844/#83852
Extended weather.
https://www.cpc.ncep.noaa.gov/products/predictions/610day/ | ||||||||
| 6 to 10 day outlooks | ||||||||
| Click below for information about how to read 6-10 day outlook maps Temperature Precipitation | ||||||||
| Click below for archives of past outlooks (data & graphics), historical analogs to todays forecast, and other formats of the 6-10 day outlooks ArchivesAnalogsLines-Only FormatGIS Data | ||||||||
Temperature Probability | ||||||||
Precipitation Probability | ||||||||
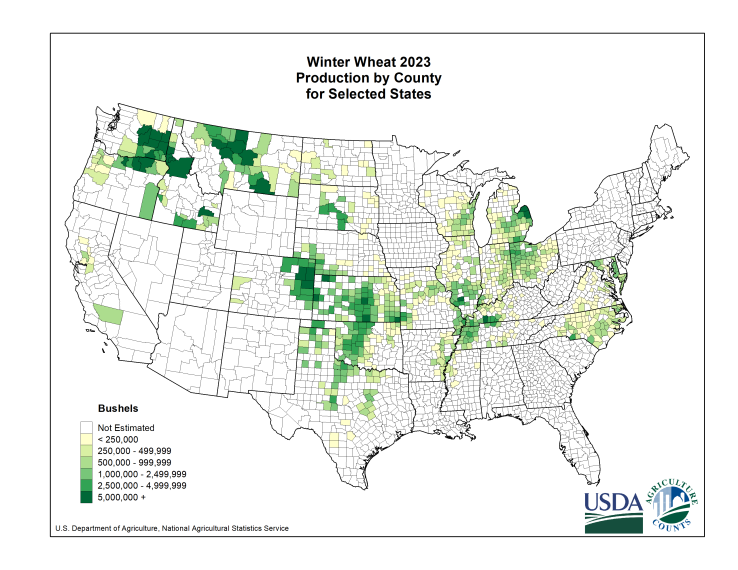
Compare that to the areas that grow Winter Wheat. HRW in the Plains, SRW east of that.
https://www.nass.usda.gov/Charts_and_Maps/Crops_County/ww-pr.php
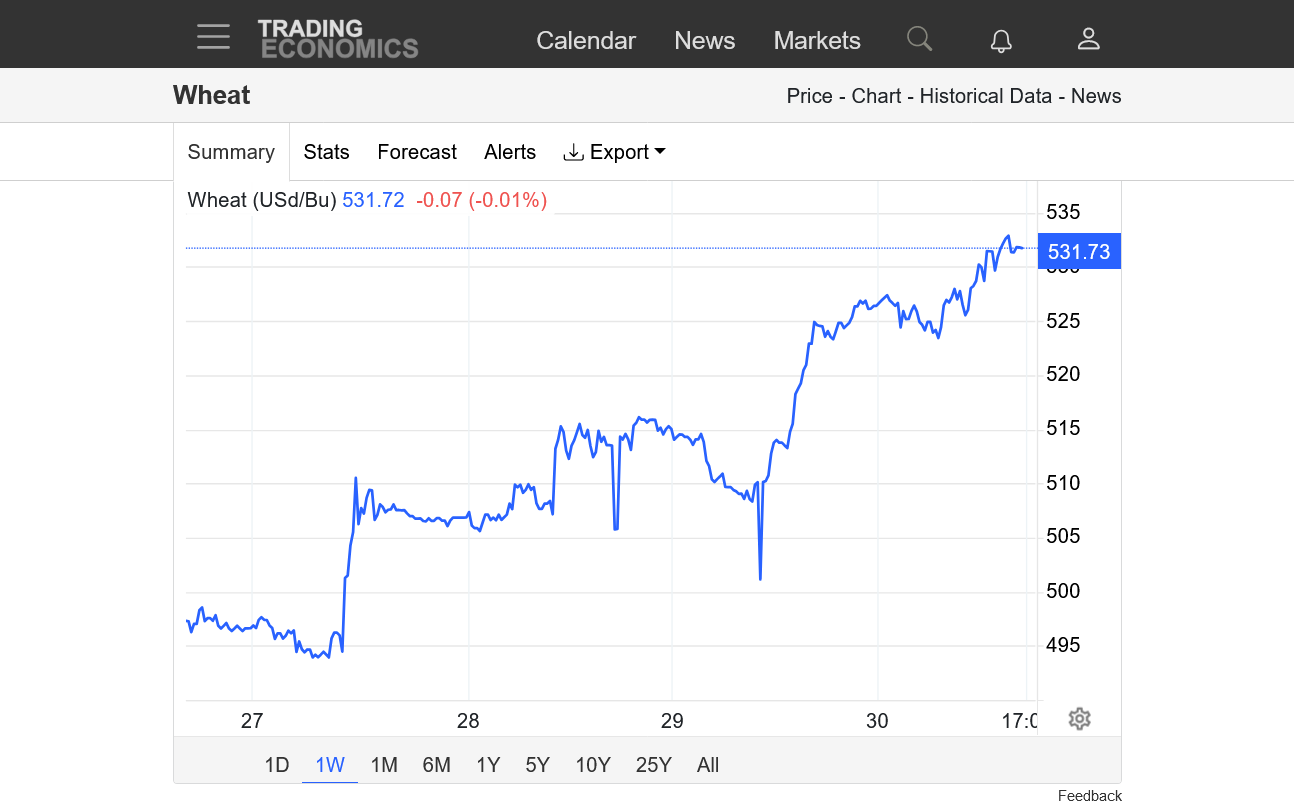
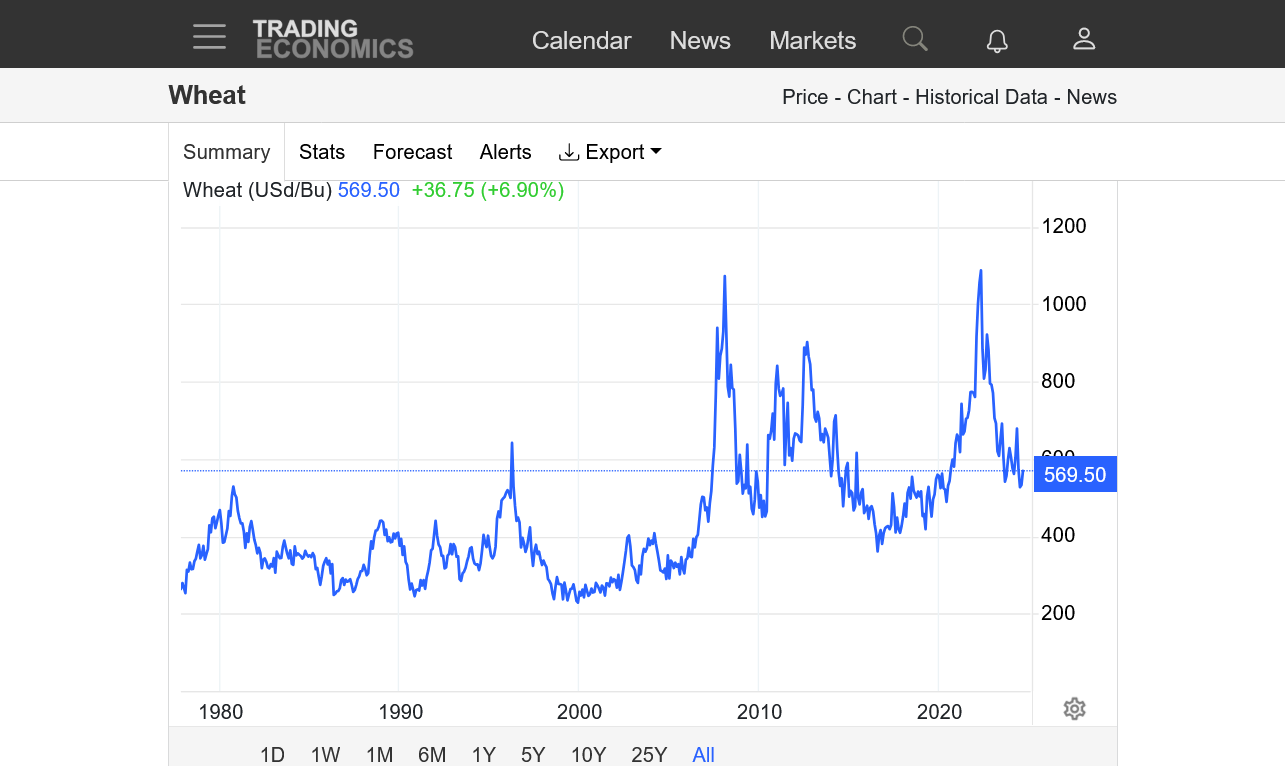
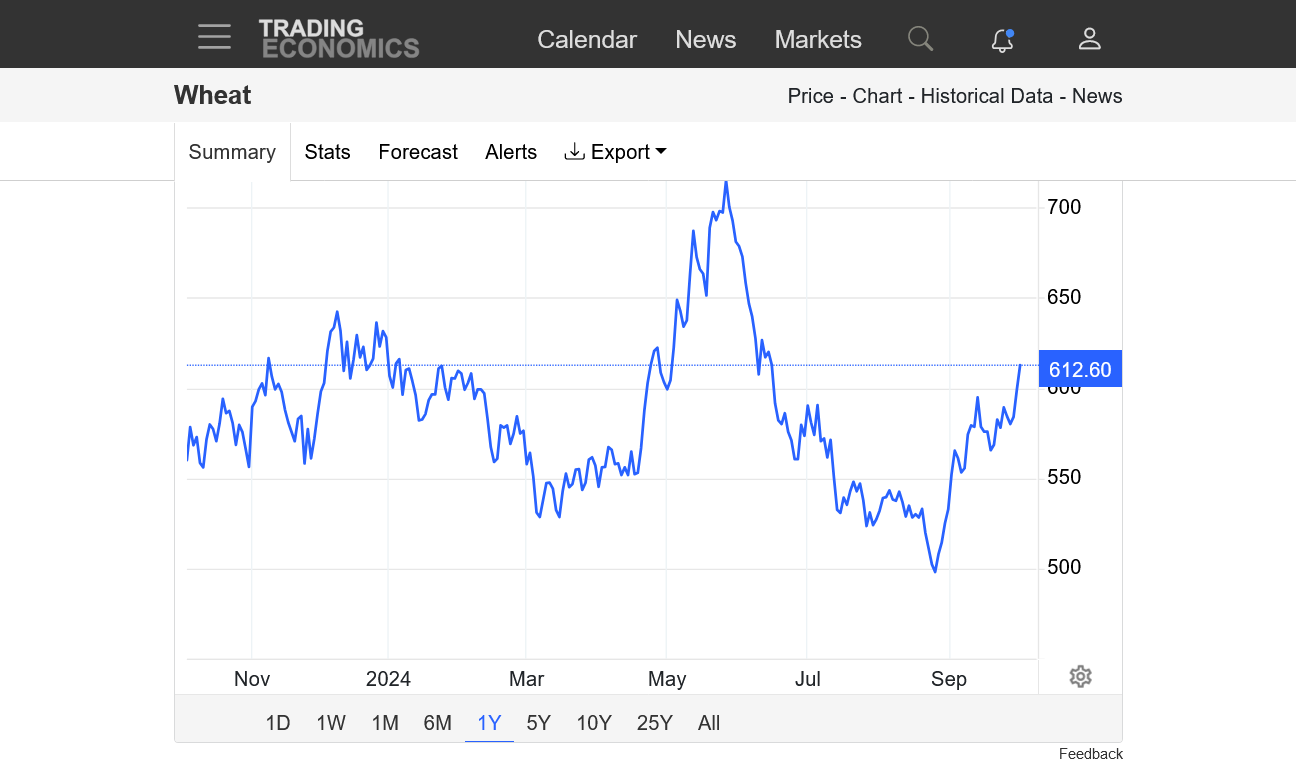
Sure looks like we put in a significant low, last Tuesday, August 27th in the 495 area. This is the front month, September. The contract with the most volume, December is trading around 15c higher.
https://tradingeconomics.com/commodity/wheat
1. 50 years
2. 5 years
3. 1 year-There's that spike low, reversal higher last week
4. 1 month
5. 1 week-We've already bounced almost 40c from that significant low. This is your downside risk right now. The best, lower risk entry point was the day after the reversal up. However, note the spike lower, retest of $5 on the Thursday morning open. The funds sold hard on the open, below the previous days low/resistance and hit alot of stops, testing $5.........then immediately reversed back up with a sharply higher close. So Thursday was the day that most strongly confirmed that the lows are LIKELY in for wheat. Keep in mind that a huge widespread rain could change the weather's impact BUT NOT THE NEXT FEW DAYS!


++++++++++++++++++
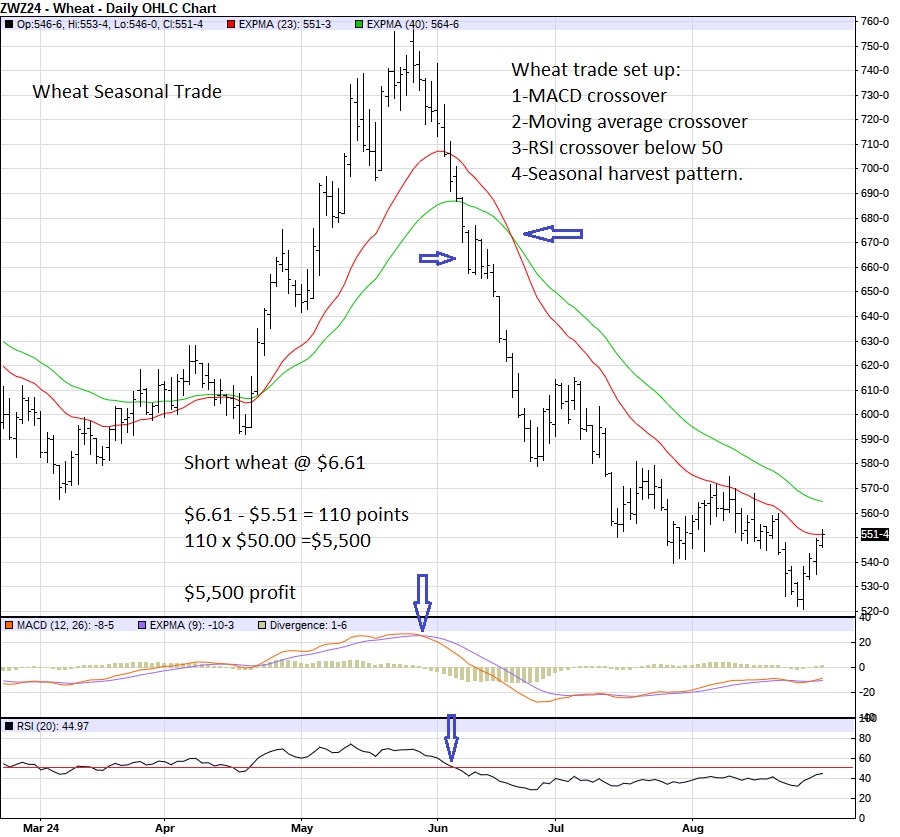
Also, on Mikes wheat chart above, we should note the DIVERGENCE in wheat indicators at the bottom with the price above, especially the MACD that has been increasing, despite wheat prices continuing to DECREASE until last week's reversal up.
The RSI shows a double bottom with the late June, harvest low.
Total rains the next 2 weeks from the last 12z GEFS.

7 Day Total precipitation below:
http://www.wpc.ncep.noaa.govcdx /qpf/p168i.gif?1530796126

https://www.tradingster.com/cot/legacy-futures/001602
%20-%20Tradingster.png)
metmike: Big specs have been covering their net short this year but are still net short by around -33,000 contracts.
+++++++++++++++++++++++++++++
This is the HRW data:
https://www.tradingster.com/cot/legacy-futures/001612
%20-%20Tradingster.png)
Unlike corn, they control a higher % of the open interest, mainly because C has a much higher open interest from commercials.
%20-%20Tradingster.png)
Same report for corn and beans:
https://www.tradingster.com/cot/legacy-futures/002602
%20-%20Tradingster.png)
https://www.tradingster.com/cot/legacy-futures/002602
%20-%20Tradingster.png)
++++++++++++++
We've been pointing out the bullishness of the soybean market set up the past week,especially with the very dry ending shaving off a couple of bushels from the national yield:
Beans
48 responses |
Started by baker - Aug. 8, 2024, 7:36 p.m.
As we pointed out yesterday, the weather has turned BULLISH for wheat ……..along with comprehensive details on wheat trading dynamics that drive the market and price changes BEFORE IT HAPPENED and wheat is +13c today.
Weather remains BULLISH for wheat for the previous reasoning.
same with beans that are +24c at the moment and also have bullish weather.
+++++++++++++
This is another bullish weather item that the wheat market has been trading:
#Argentina is facing more weather woes as dryness and winter frosts have plagued the #wheat crop. Rain could be coming within a few days, but the amounts may not be sufficient.
++++++++++++++++++++++++++++++
https://ipad.fas.usda.gov/countrysummary/Default.aspx?id=AR&crop=Wheat

 +++++++++++++++++
https://www.cpc.ncep.noaa.gov/products/Precip_Monitoring/Figures/global/n.90day.figb.gif

+++++++++++++++
2 week rains from the last 12z GEFS. Not much for wheat country in Argentina!

December wheat finished +15c, near the highs, here on Tuesday September 3, 2024.
Less than half of #France's #wheat crop meets the typical protein levels used by key importers and only 1/4 meets average test weight levels (usually 3/4 of the crop meets this standard). France's harvest will be the smallest since the 1980s after excessive rains this season.
++++++++++++++++++++++++====================
@kannbwx
Aug 28
North Africa is a major destination for French wheat, but China has also been a consistent customer in the last couple years, especially earlier this year: (chart from LSEG Eikon)
By metmike - Sept. 3, 2024, 12:20 p.m.
As we pointed out yesterday, the weather has turned BULLISH for wheat ……..along with comprehensive details on wheat trading dynamics that drive the market and price changes BEFORE IT HAPPENED and wheat is +13c today.
Weather remains BULLISH for wheat for the previous reasoning.
++++++++++++++
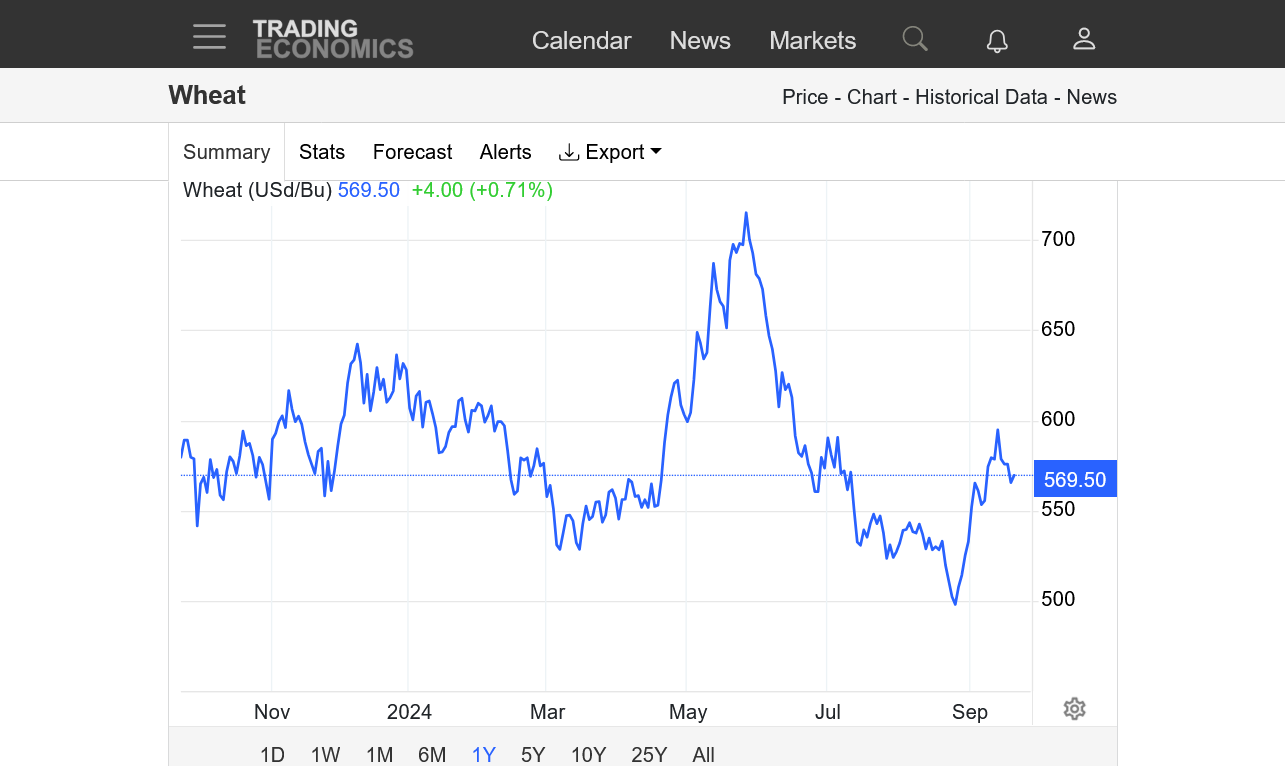
1. 1 month-August 27th MAJOR BOTTOM at $4.94! Peaked 9-13 just below $6. A 30c correction down since then on needed rains with this current system + pattern change to wetter! Still up ~70c from the lows less than a month ago!
2. 1 year-May 27 high $7.16-ish. WOW! What a drop in 3 months!
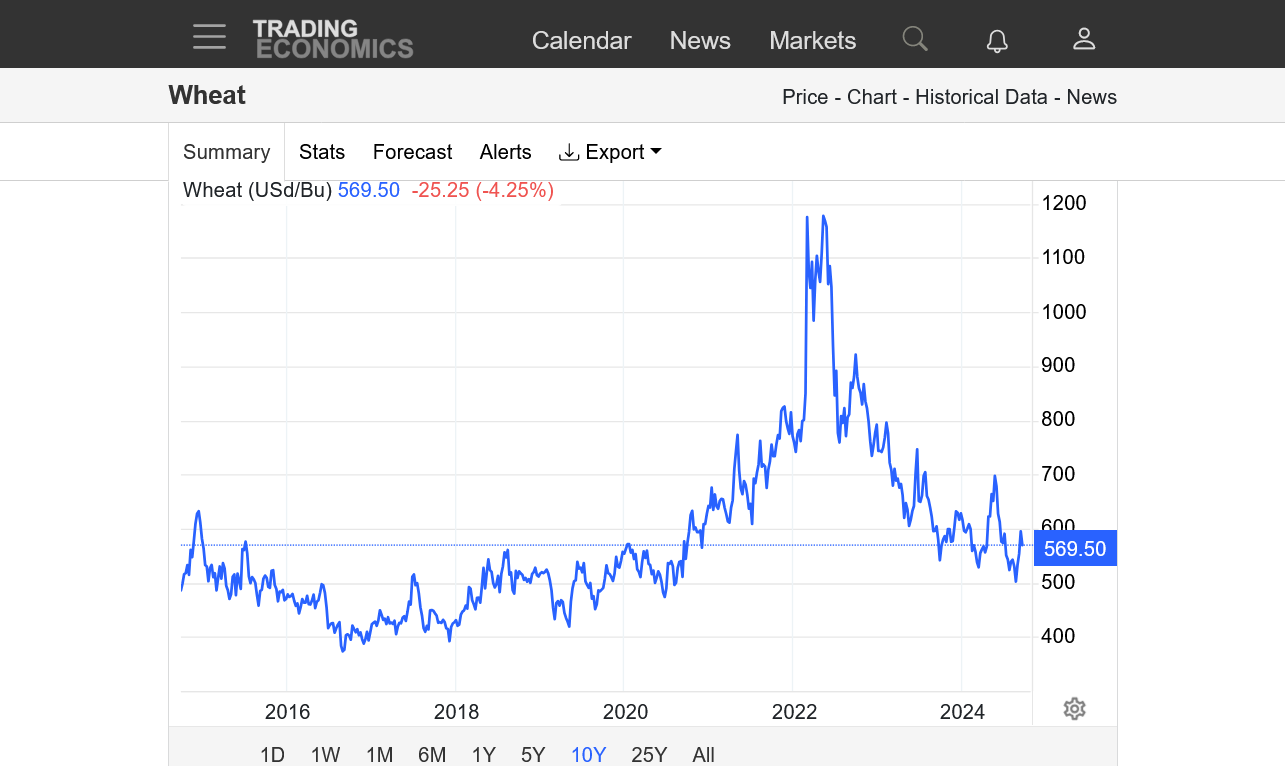
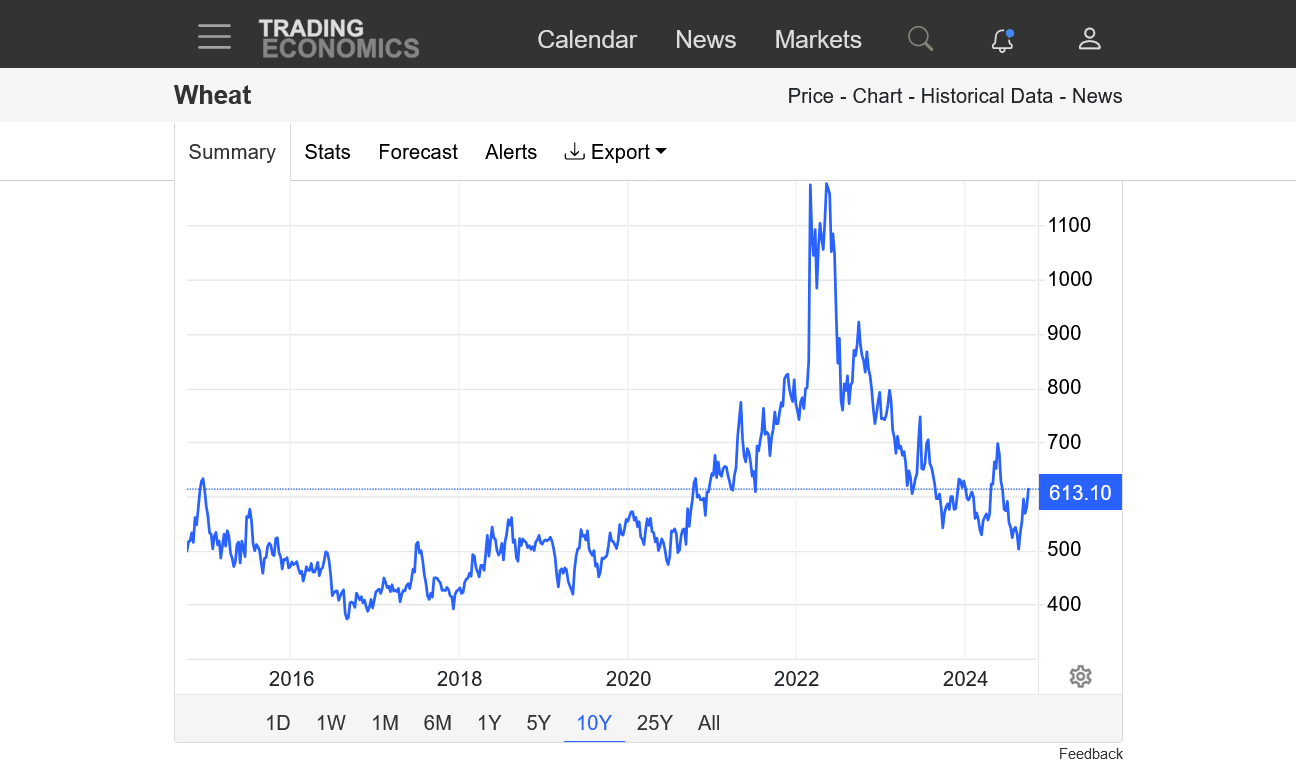
3. 10 years- $11.80 all time high Feb and May 2022!
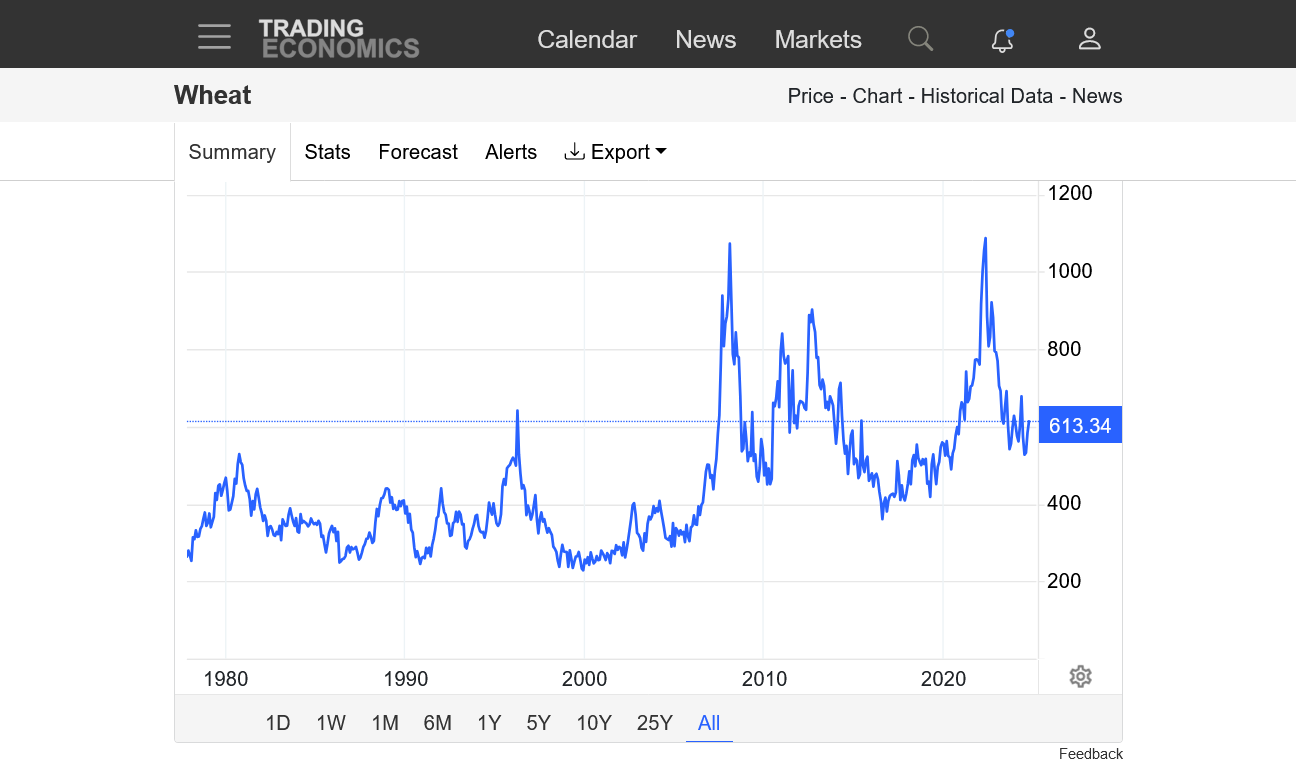
4. 50 years-$10.75 high in 2008! $3.60 low in 2016!
https://tradingeconomics.com/commodity/wheat
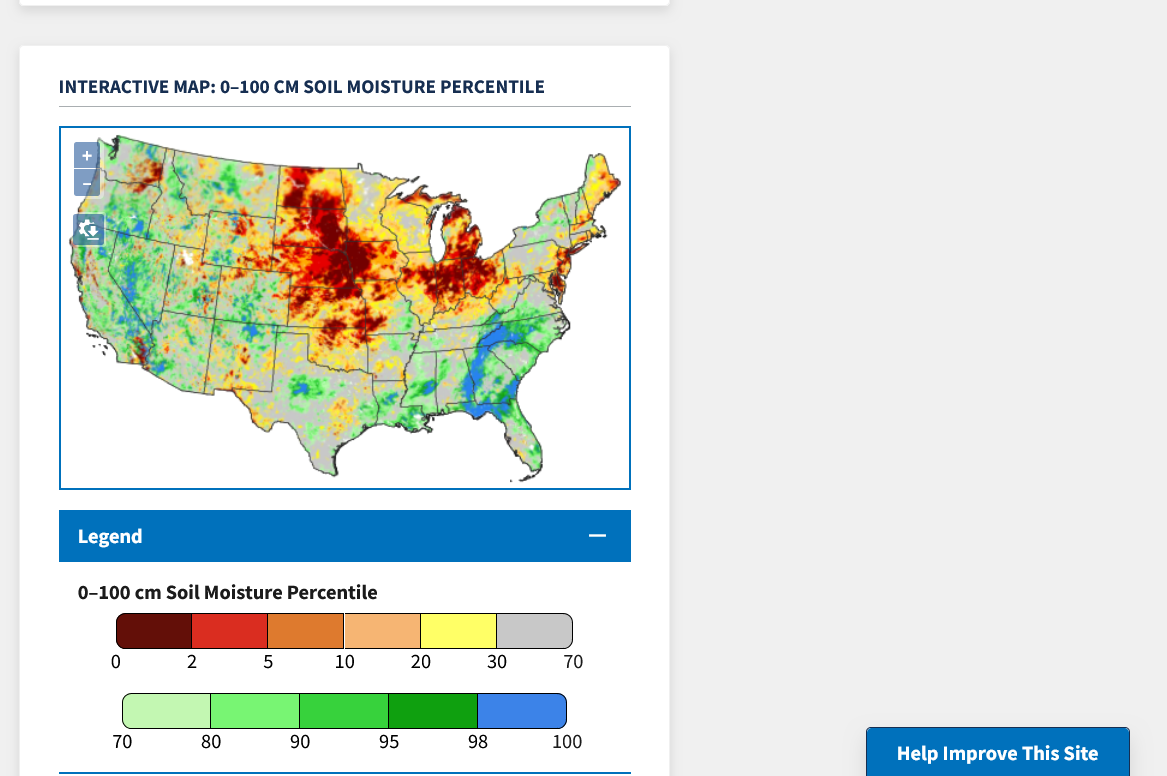
New product that shows how depleted our soil moisture is.
100 cm = 39 inches =just over 3 feet down. Evansville is in the darkest shade of red.
Basically, close to the lowest soil moisture ever in the top 3 feet. We can see how Francine greatly helped areas just barely south of us a week ago.
https://www.drought.gov/data-maps-tools/nasa-sport-lis-soil-moisture-products
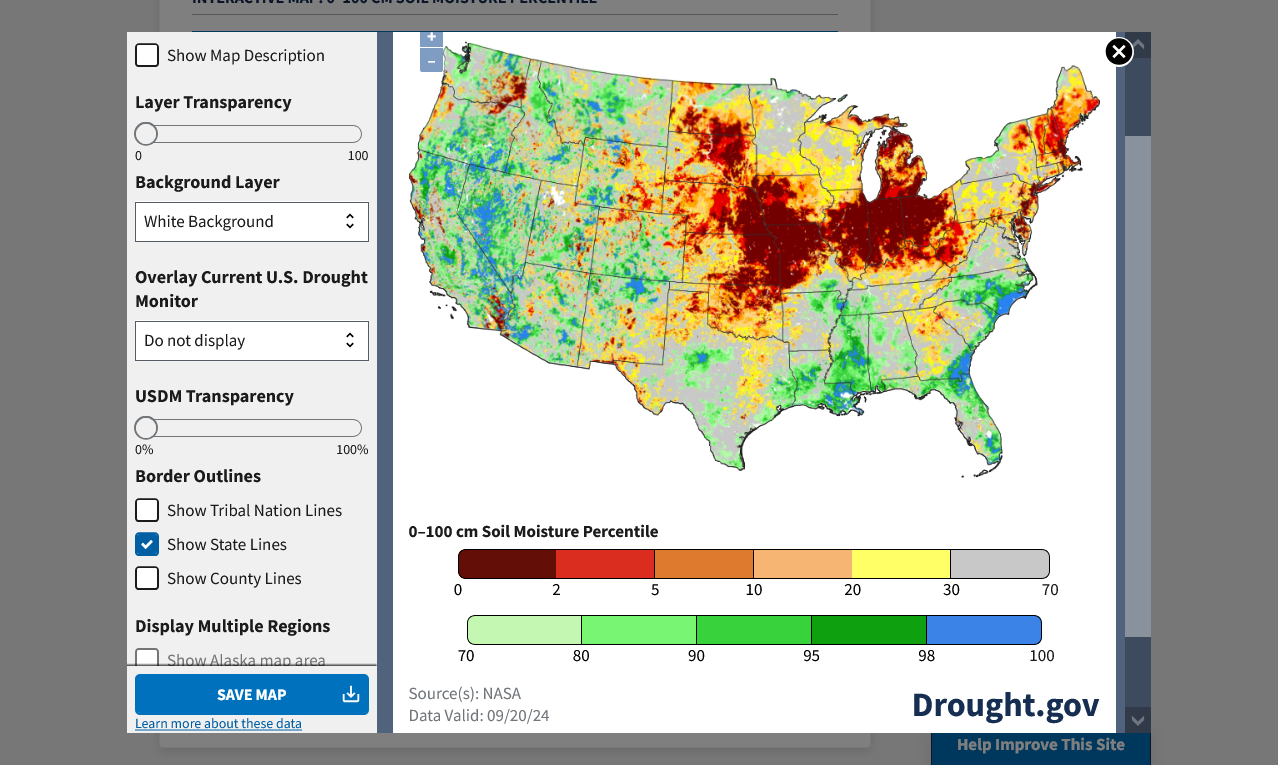
Compare that to the areas that grow Winter Wheat. HRW in the Plains, SRW east of that. Almost the same exact areas which is why we alerted you to most of the $1+ rally BEFORE it happened based on the weather forecast.
https://www.nass.usda.gov/Charts_and_Maps/Crops_County/ww-pr.php

+++++++++++++
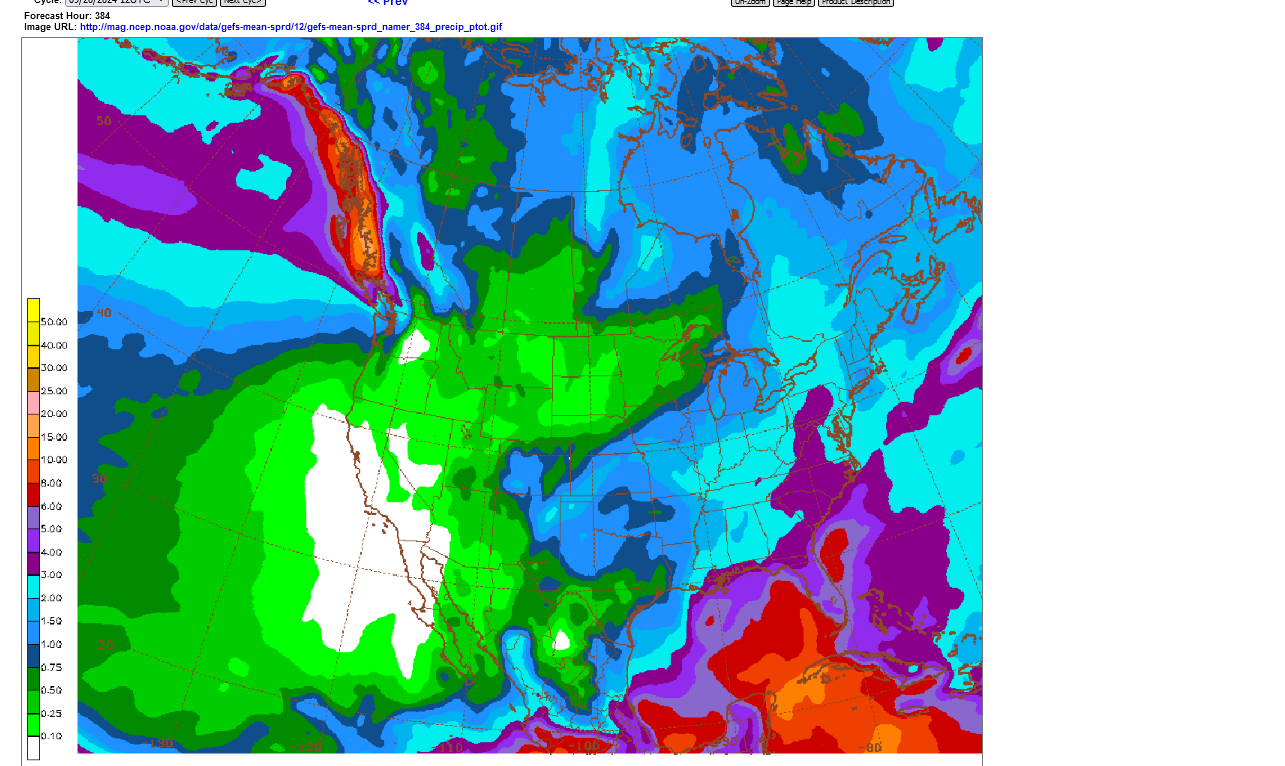
Pattern change to wetter weather coming up in some spots that need it the most. This was the last 12z GEFS 2 week rains:
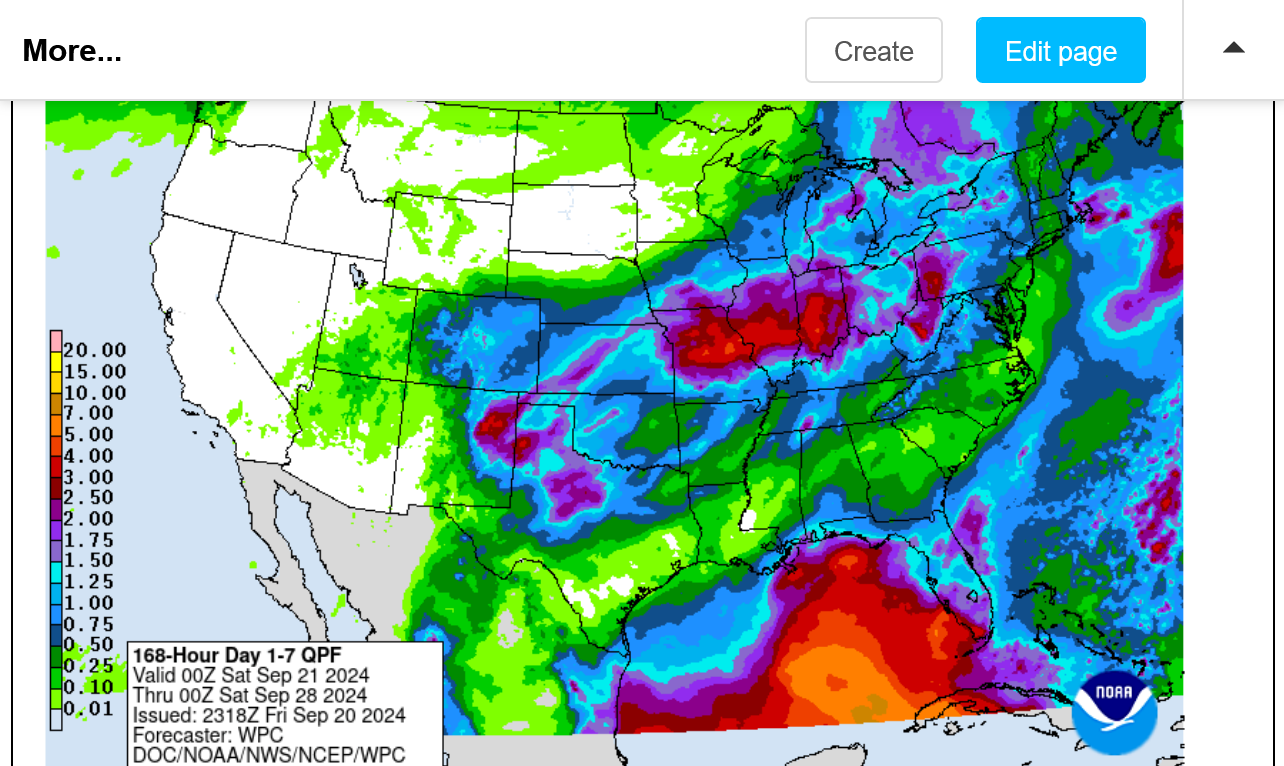
Latest NWS 1 week rains. Much of this will be falling in the next 5 days.....where needed the most!
Image below is a frozen frame from Friday pm. Go to the link for the latest update.
7 Day Total precipitation below:
http://www.wpc.ncep.noaa.govcdx /qpf/p168i.gif?1530796126
After some needed rains fell late last week/over the weekend, mainly in some of the Soft Red Winter Wheat growing areas that pressured wheat prices ahead of that, the forecasts have been bone dry this week and VERY bullish wheat prices. Wheat has broken out to the upside(other factors have become bullish too):
SOIL MOISTURE:
https://www.drought.gov/data-maps-tools/nasa-sport-lis-soil-moisture-products
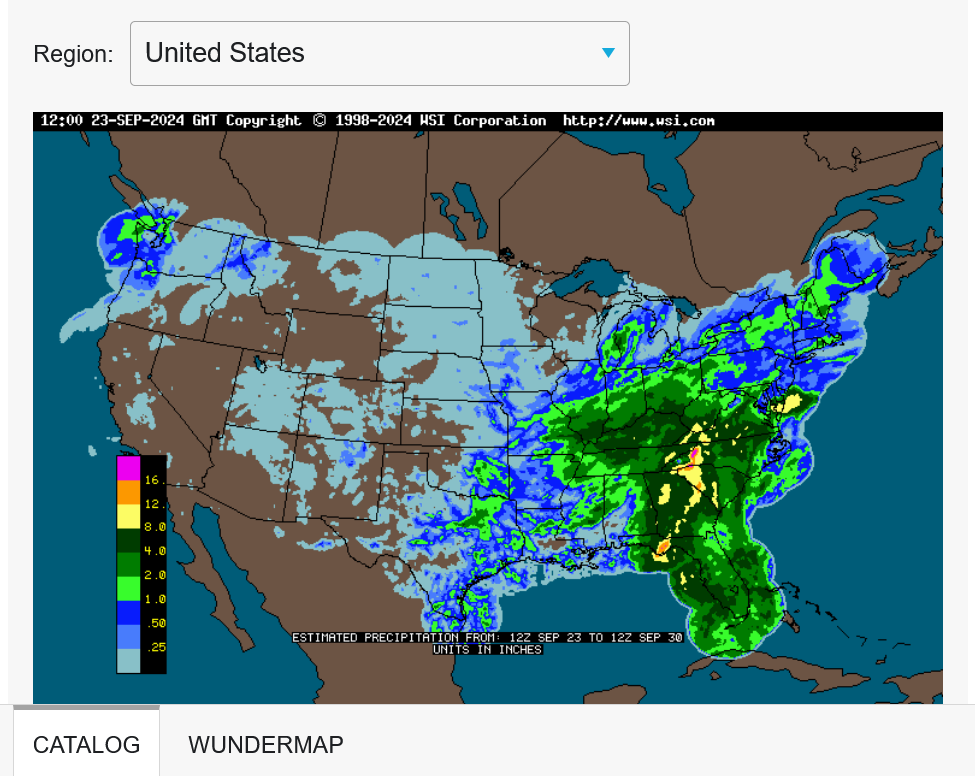
https://www.wunderground.com/maps/precipitation/weekly
9-30-24 Rains the past 7 days. Remnants of Helene dominate!
2 week rains from the last 6z GEFS run: NO RAIN ANYWHERE IN THE WHEAT BELT!
Previous technical analysis from the past month still valid today:
https://www.marketforum.com/forum/topic/107127/#107134
https://www.marketforum.com/forum/topic/107127/#107553
+++++++++++++++++++
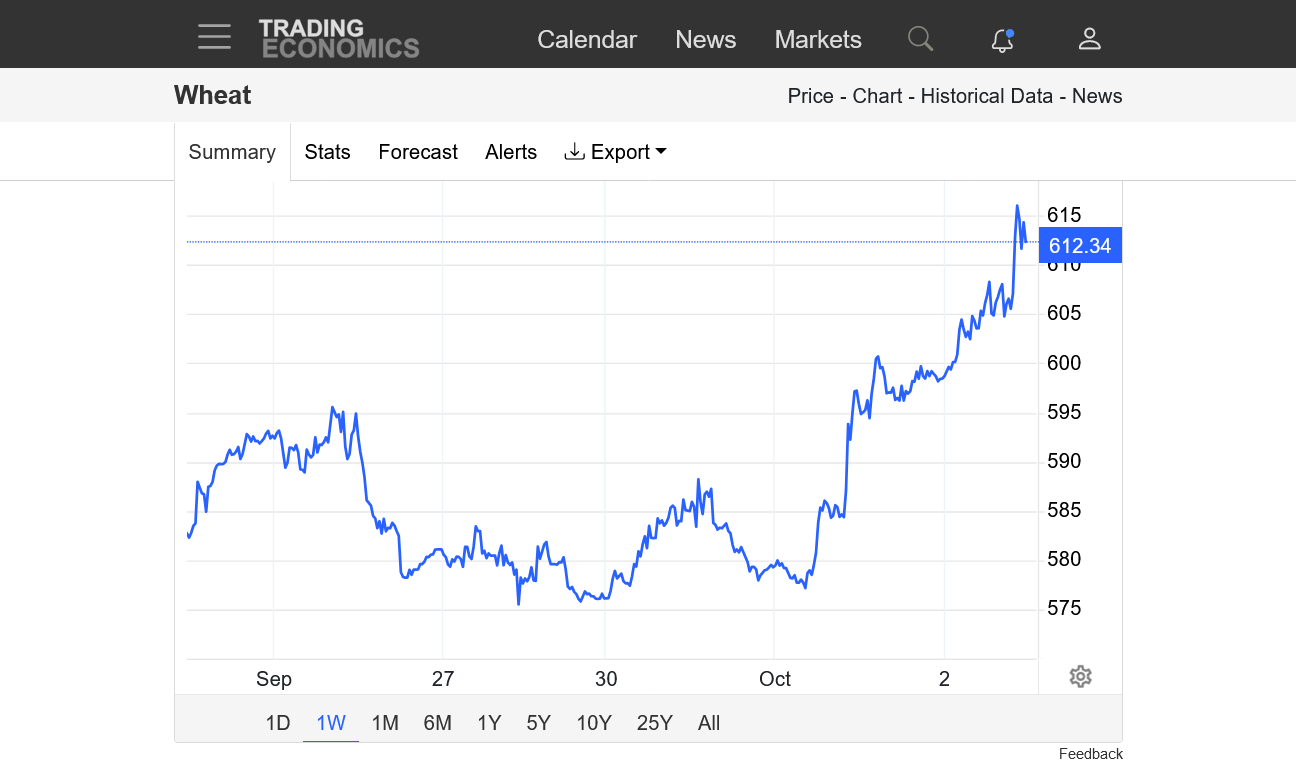
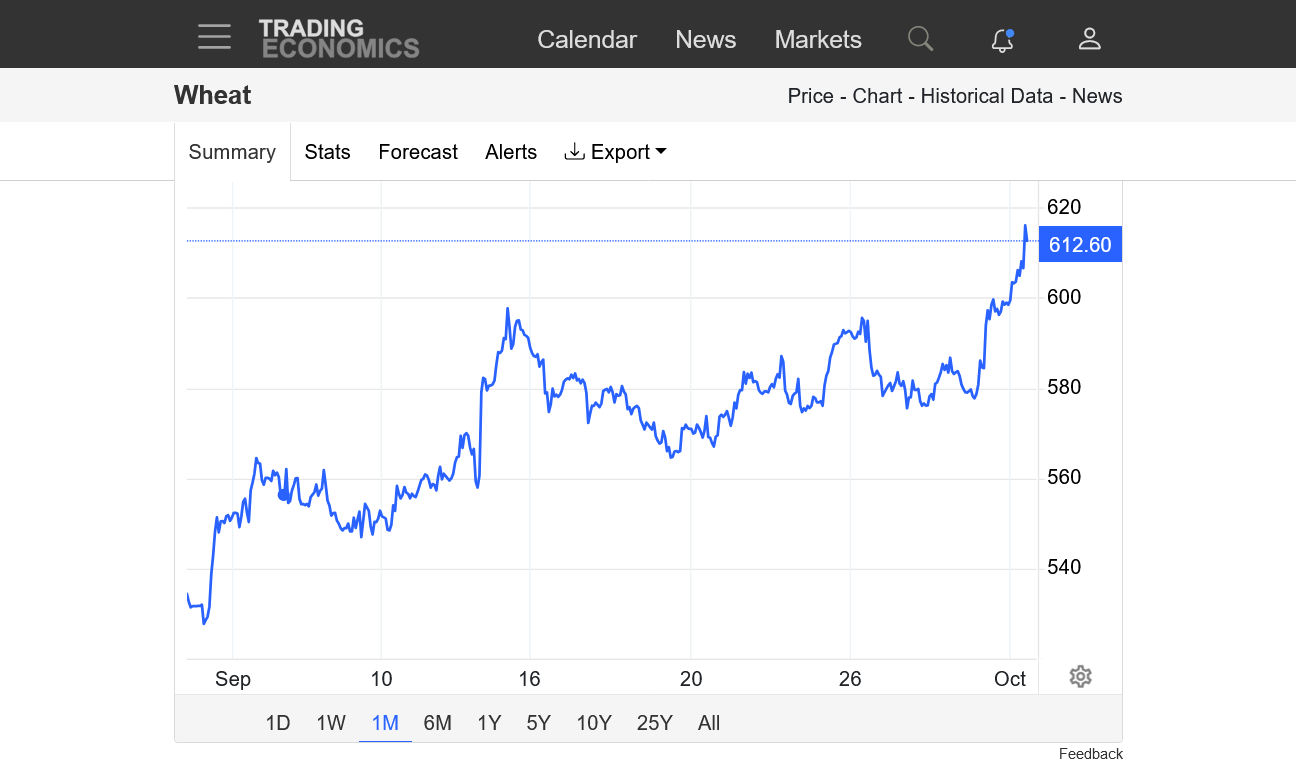
https://tradingeconomics.com/commodity/wheat
1. 1 week
2. 1 month
3. 1 year
4. 10 years
5. 50 years
metmike: The flash drought caused producers to get beans out of the field quickly because drying out too much will cause yields losses for beans(pod shattering). These were the earlier planted beans that will have the highest yields. The later planted beans had more pod filling during the flash drought. Yields WILL drop in the 2nd half of the bean harvest.
Complete report:
+++++++++++++
Recent rains were likely enough to plant and germinate wheat in most places. We will see poor wheat stands(establishment) if it stays dry thru October which looks likely right now.
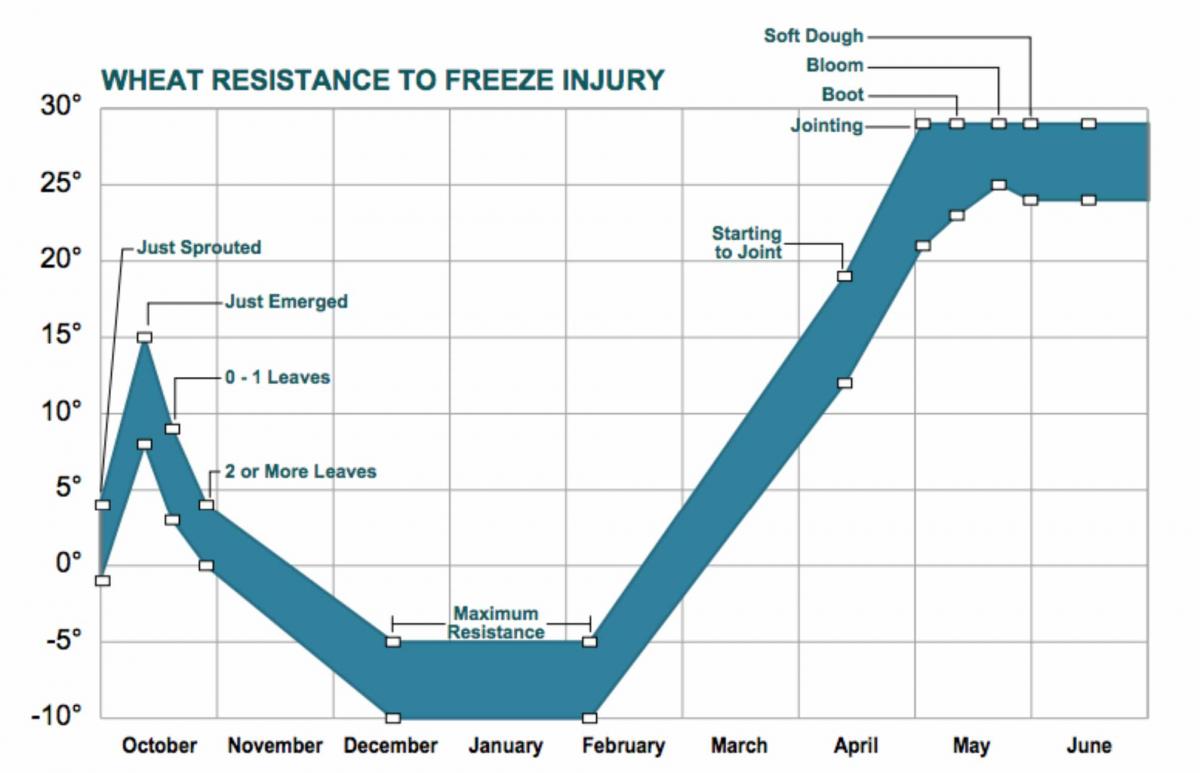
Wheat plants that are not well established before going dormant in November/early December will be especially vulnerable to Winter kill............starting when temps drop below +10 deg. F without insulating snow on the ground and shallow roots.
Below -10 Deg. F with no snow is the threshold many use for major damage to the dormant wheat.
https://www.sunflower.k-state.edu/agronomy/wheat/winter_damage.html
https://cropwatch.unl.edu/factors-contributing-winter-wheat-winter-injurykill-2014-15
+++++++++++++
This article above is for North Platte, NE, which has a unique climate(drier and colder), so planting and conditions will be different than most of the Winter Wheat belt.
https://www.canr.msu.edu/news/winter_injury_to_winter_wheat_in_michigan
++++++++++++++++++++++++
https://extension.sdstate.edu/low-temperature-effects-winter-wheat
#Russia's fifth-largest grain producing region, Voronezh, has declared a state of emergency due to drought. Voronezh borders Ukraine and is the outlined area on the map below.
#Egypt's state grains buyer struck a deal to receive monthly #wheat supplies between November-April, about 510,000 tonnes per month. This totals 3.12 mmt, and is one of the largest ever direct deals. Source will be Black Sea.https://msn.com/en-us/money/ma
Oct. 2: CBOT Dec #wheat futures settle up 2.7% at $6.15-1/4 per bu, the most-active contract's first $6+ finish since mid-June. In focus:Worsening drought in top-exporter RussiaEgypt strikes one of the largest ever direct wheat buying deals Downgrades to Australian crop
+++++++++++++
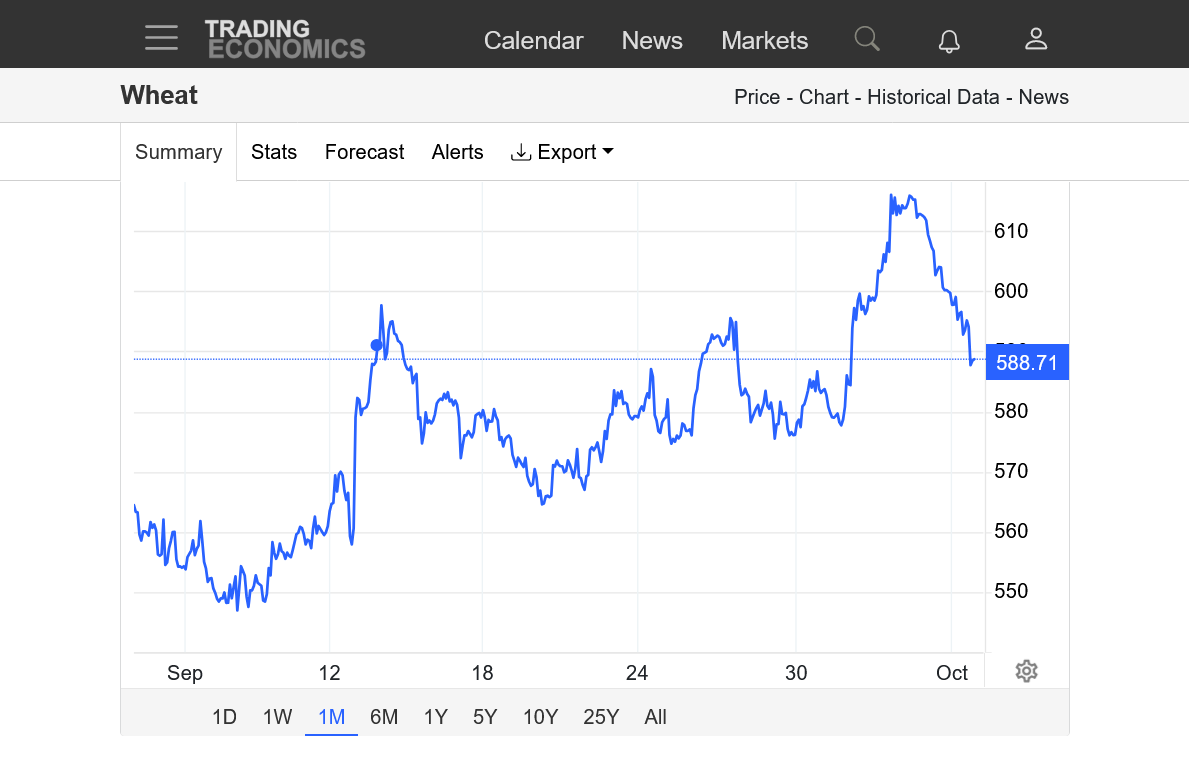
October 4, metmike: Wheat has surprisingly dropped 30c since these spike highs and getting within 10c of testing the 20 day moving average.
Not sure of the reason right now, possibly better rain chances in the 2nd half of October??? Too much of a price increase too fast? Funds have covered most of their shorts???
Wheat has surprisingly dropped 30c since these spike highs and getting within 10c of testing the 20 day moving average.
Not sure of the reason right now, possibly better rain chances in the 2nd half of October??? Too much of a price increase too fast? Funds have covered most of their shorts??? Wheat is globally traded more and has many more key producing areas than corn/beans(US and South America count most for exports).......including the US, Australia, Russia, Ukraine, Canada and France. It's FOOD for people!!!! Corn and soybean meal are food FOR ANIMALS.
https://tradingeconomics.com/commodity/wheat
1. 1 month
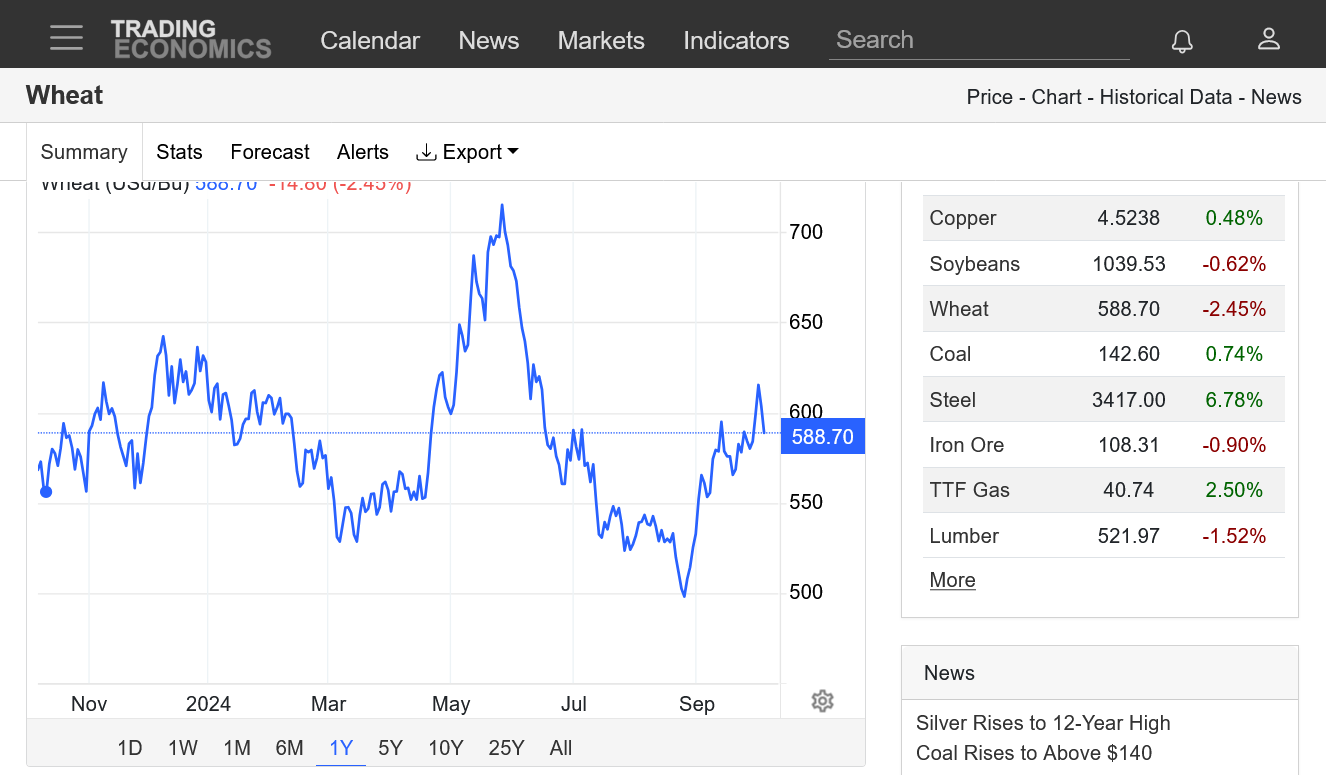
2. 1 year
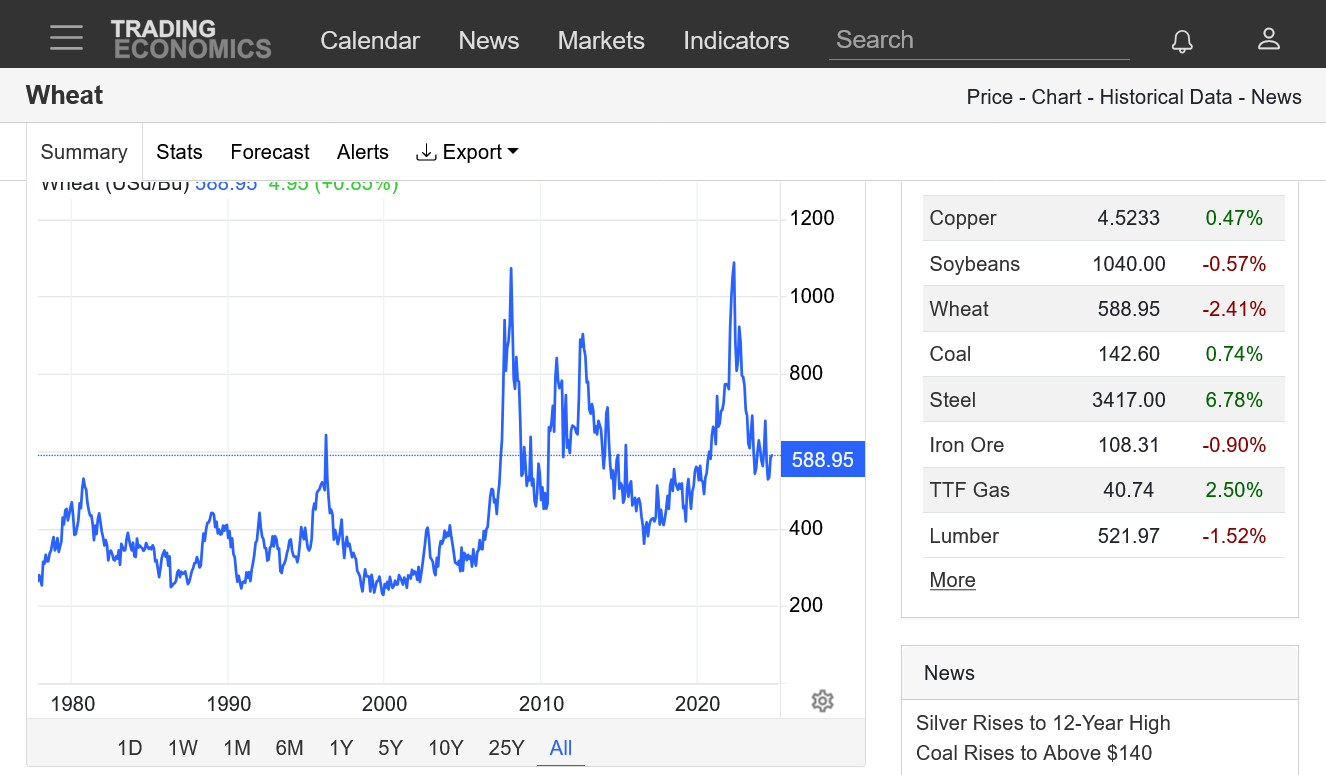
3. 50 years
++++++++++++
https://worldpopulationreview.com/country-rankings/wheat-exports-by-country
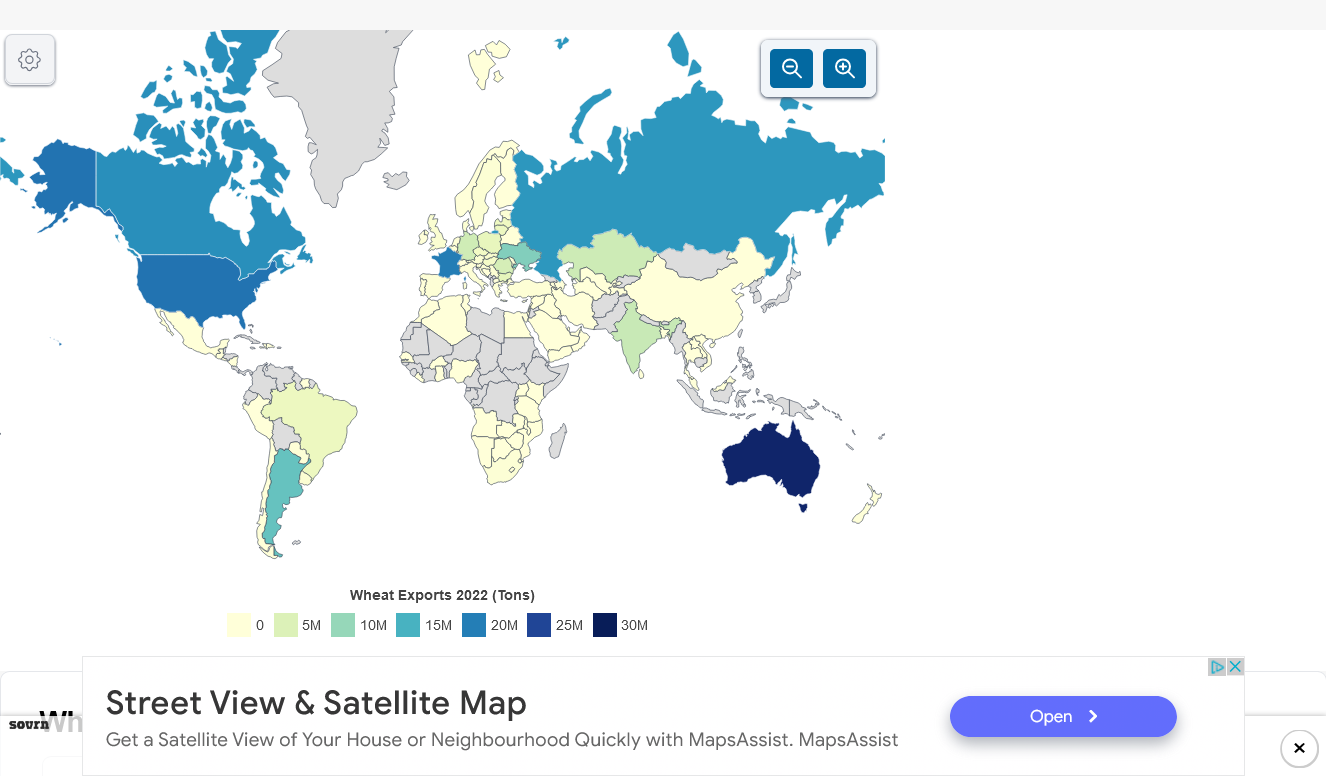
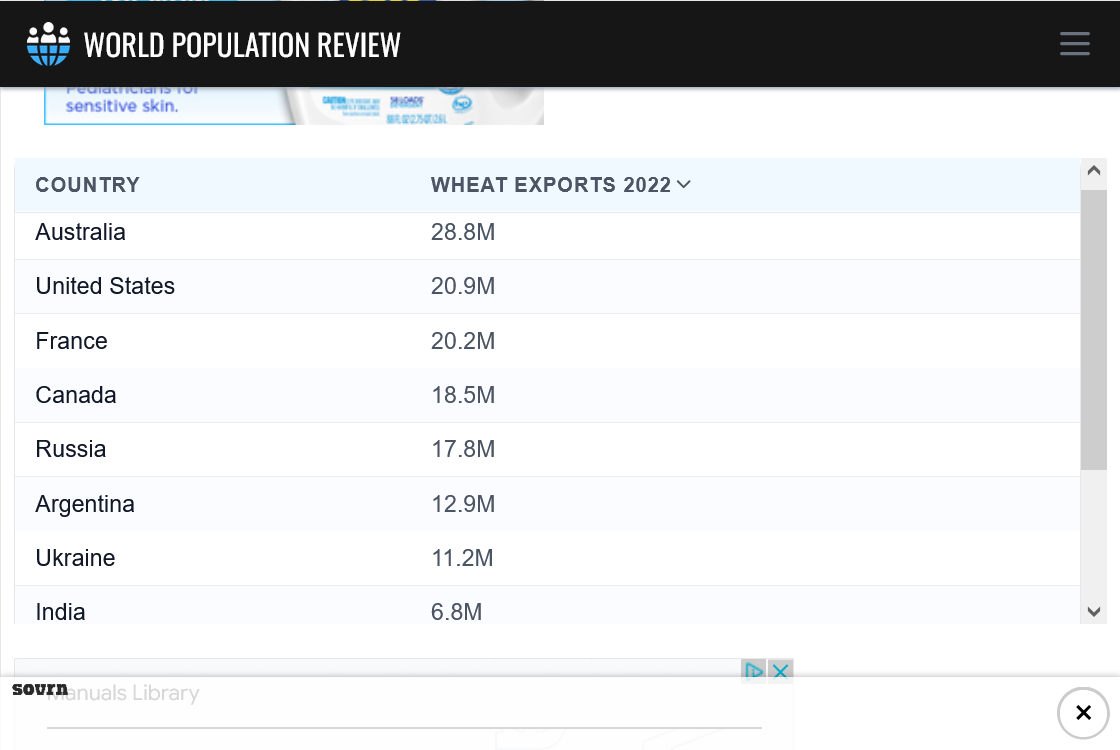
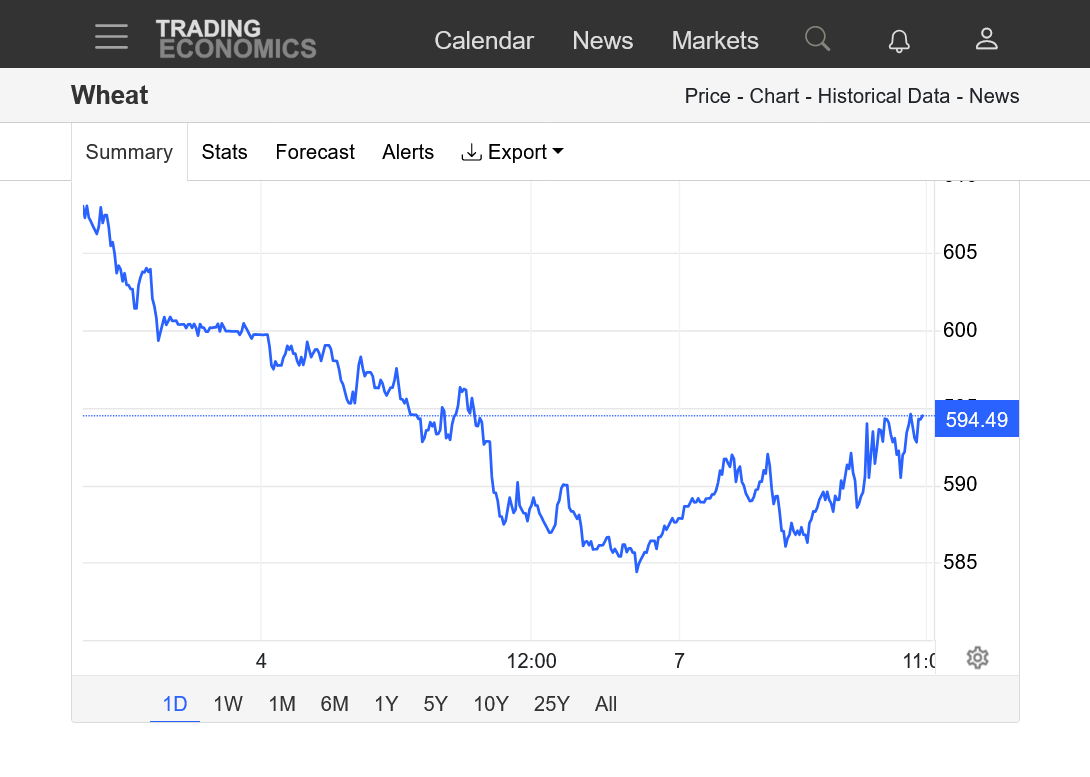
Wheat traded lower last evening (not sure why) but just before midnight, reversed higher. The US weather is BULLISH for Winter Wheat planting with no rain in the forecast.
https://tradingeconomics.com/commodity/wheat
1. 1 day
2. 1 month-wheat tests the the bottom of the new uptrend and it HOLDS!
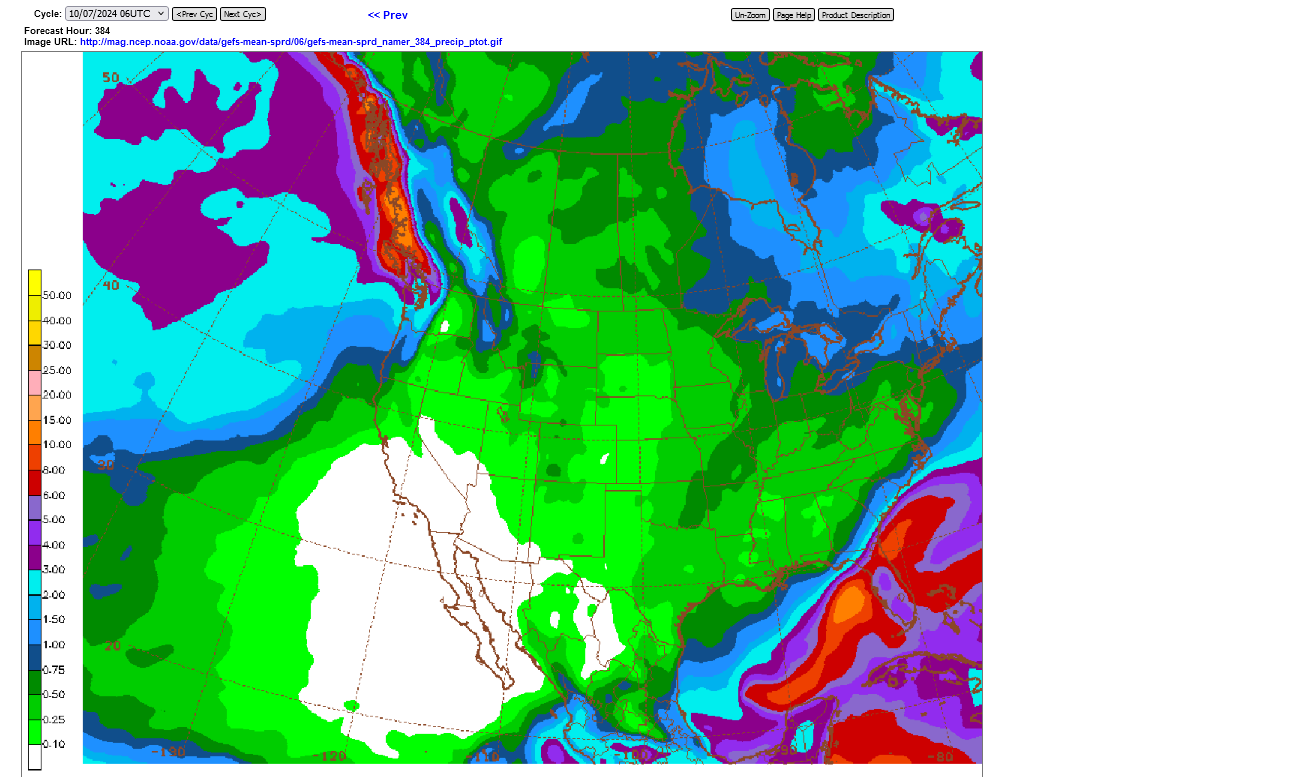
2 week rains from the last 6z GEFS, mostly in week 2 and not much:
https://www.drought.gov/data-maps-tools/nasa-sport-lis-soil-moisture-products
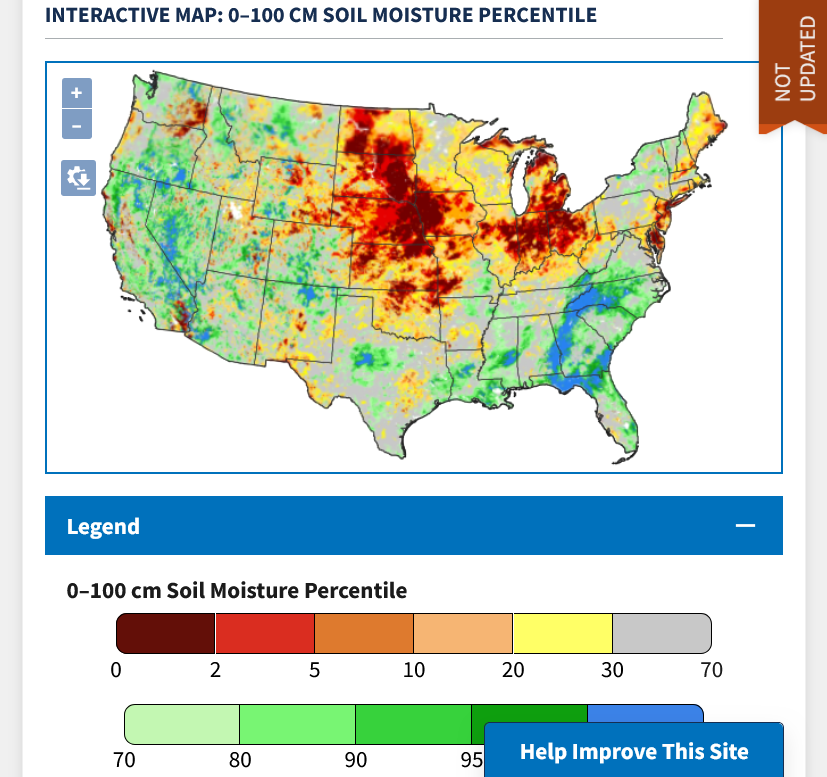
https://www.nass.usda.gov/Charts_and_Maps/Crops_County/ww-pr.php

Just so you'll know, this extremely dry weather is being caused by the NATURAL La Nina in the Pacific and NOT the fake climate crisis!
By metmike - Oct. 7, 2024, 12:11 p.m.
Still no needed rains with wheat struggling to make additional gains(on top of those since the bottom). The latest 2+ week forecasts have a slight uptick in rain chances late in October.
Last 6z GEFS below:
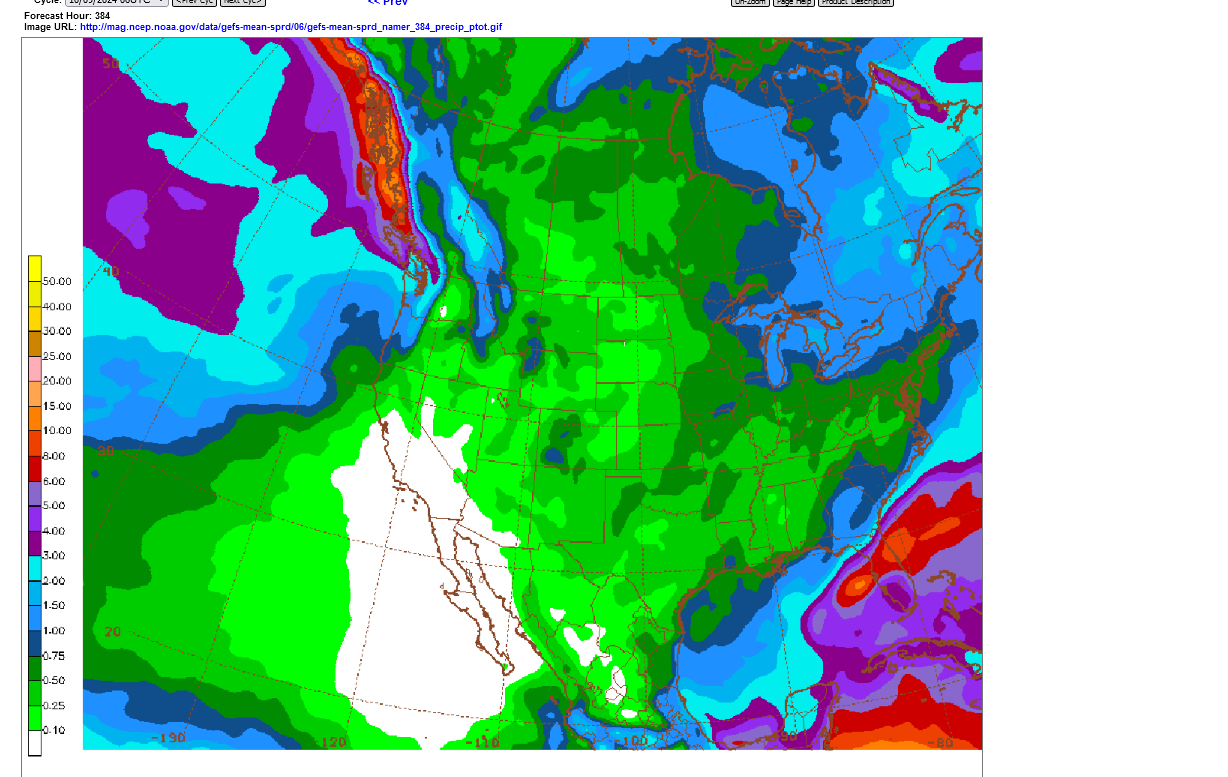
Rain chances picking up on the European model only in the S.Plains at the very end of 2 weeks from a huge pattern change that brings southern stream energy in from a trough in the Southwest, where an upper level ridge has lived for months(keeping Gulf moisture cut off)
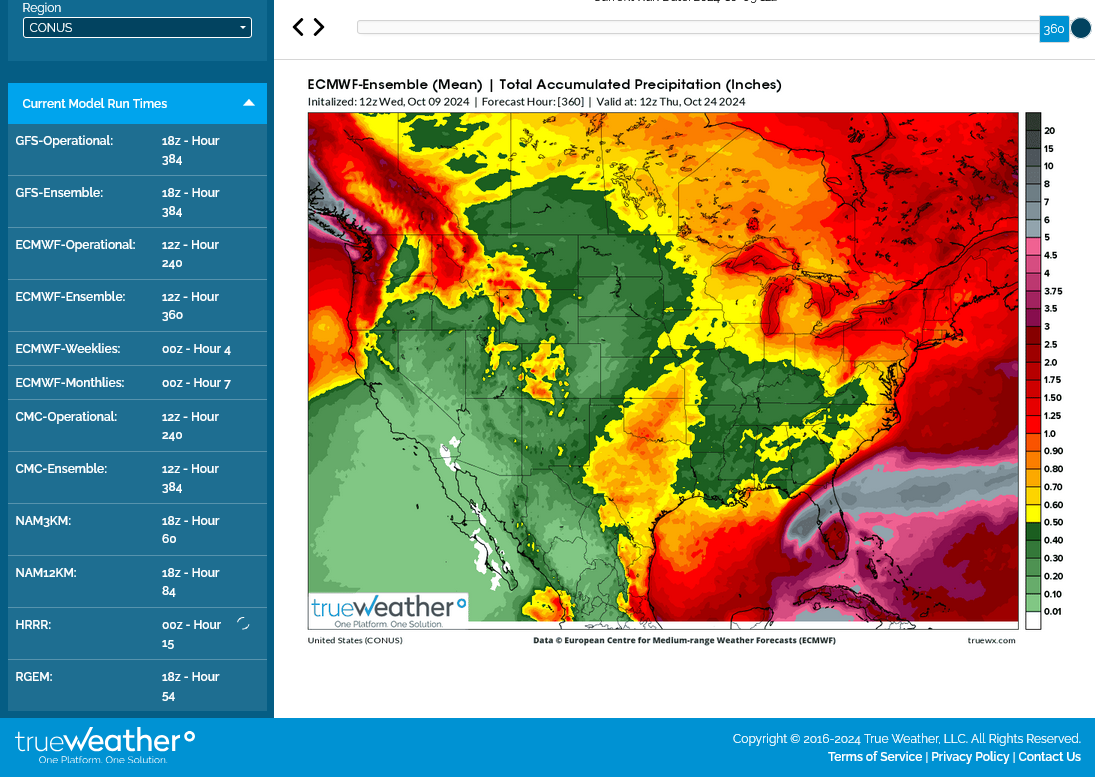
The European model solution we showed yesterday looks like it was on to something first!
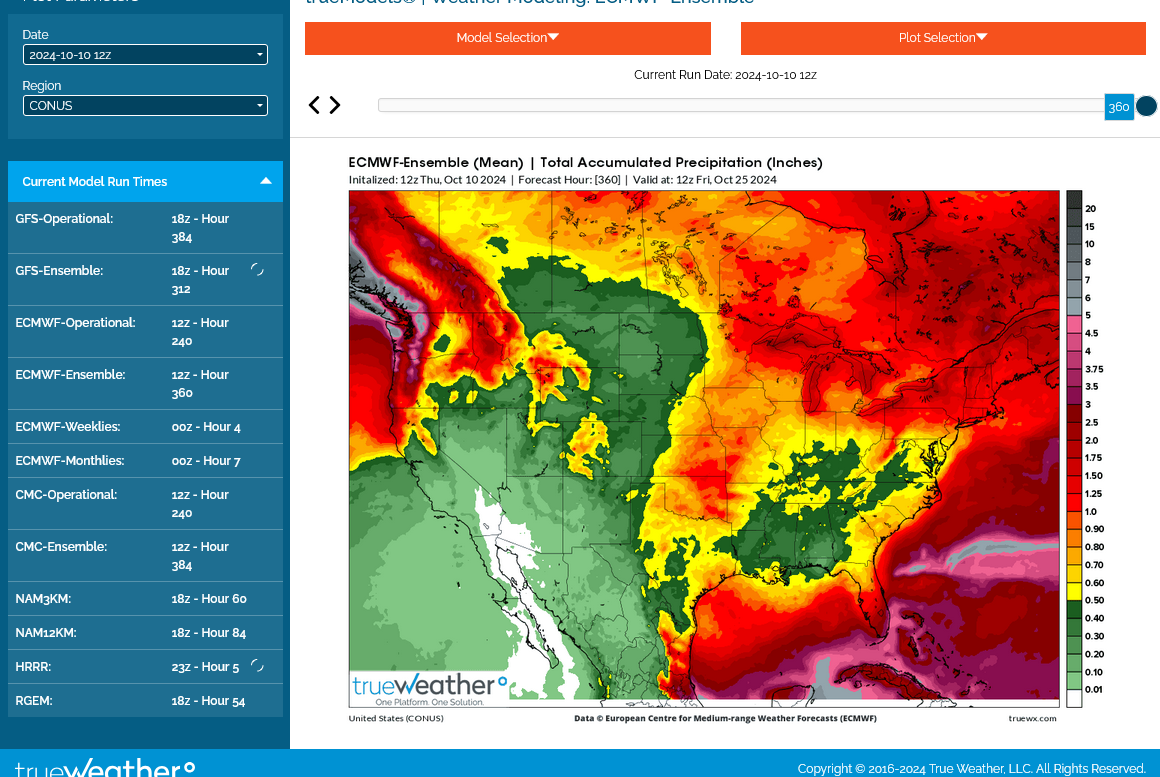
Here the last 12z solution for total precip.
++++++++++
The NWS was catching on today!!!
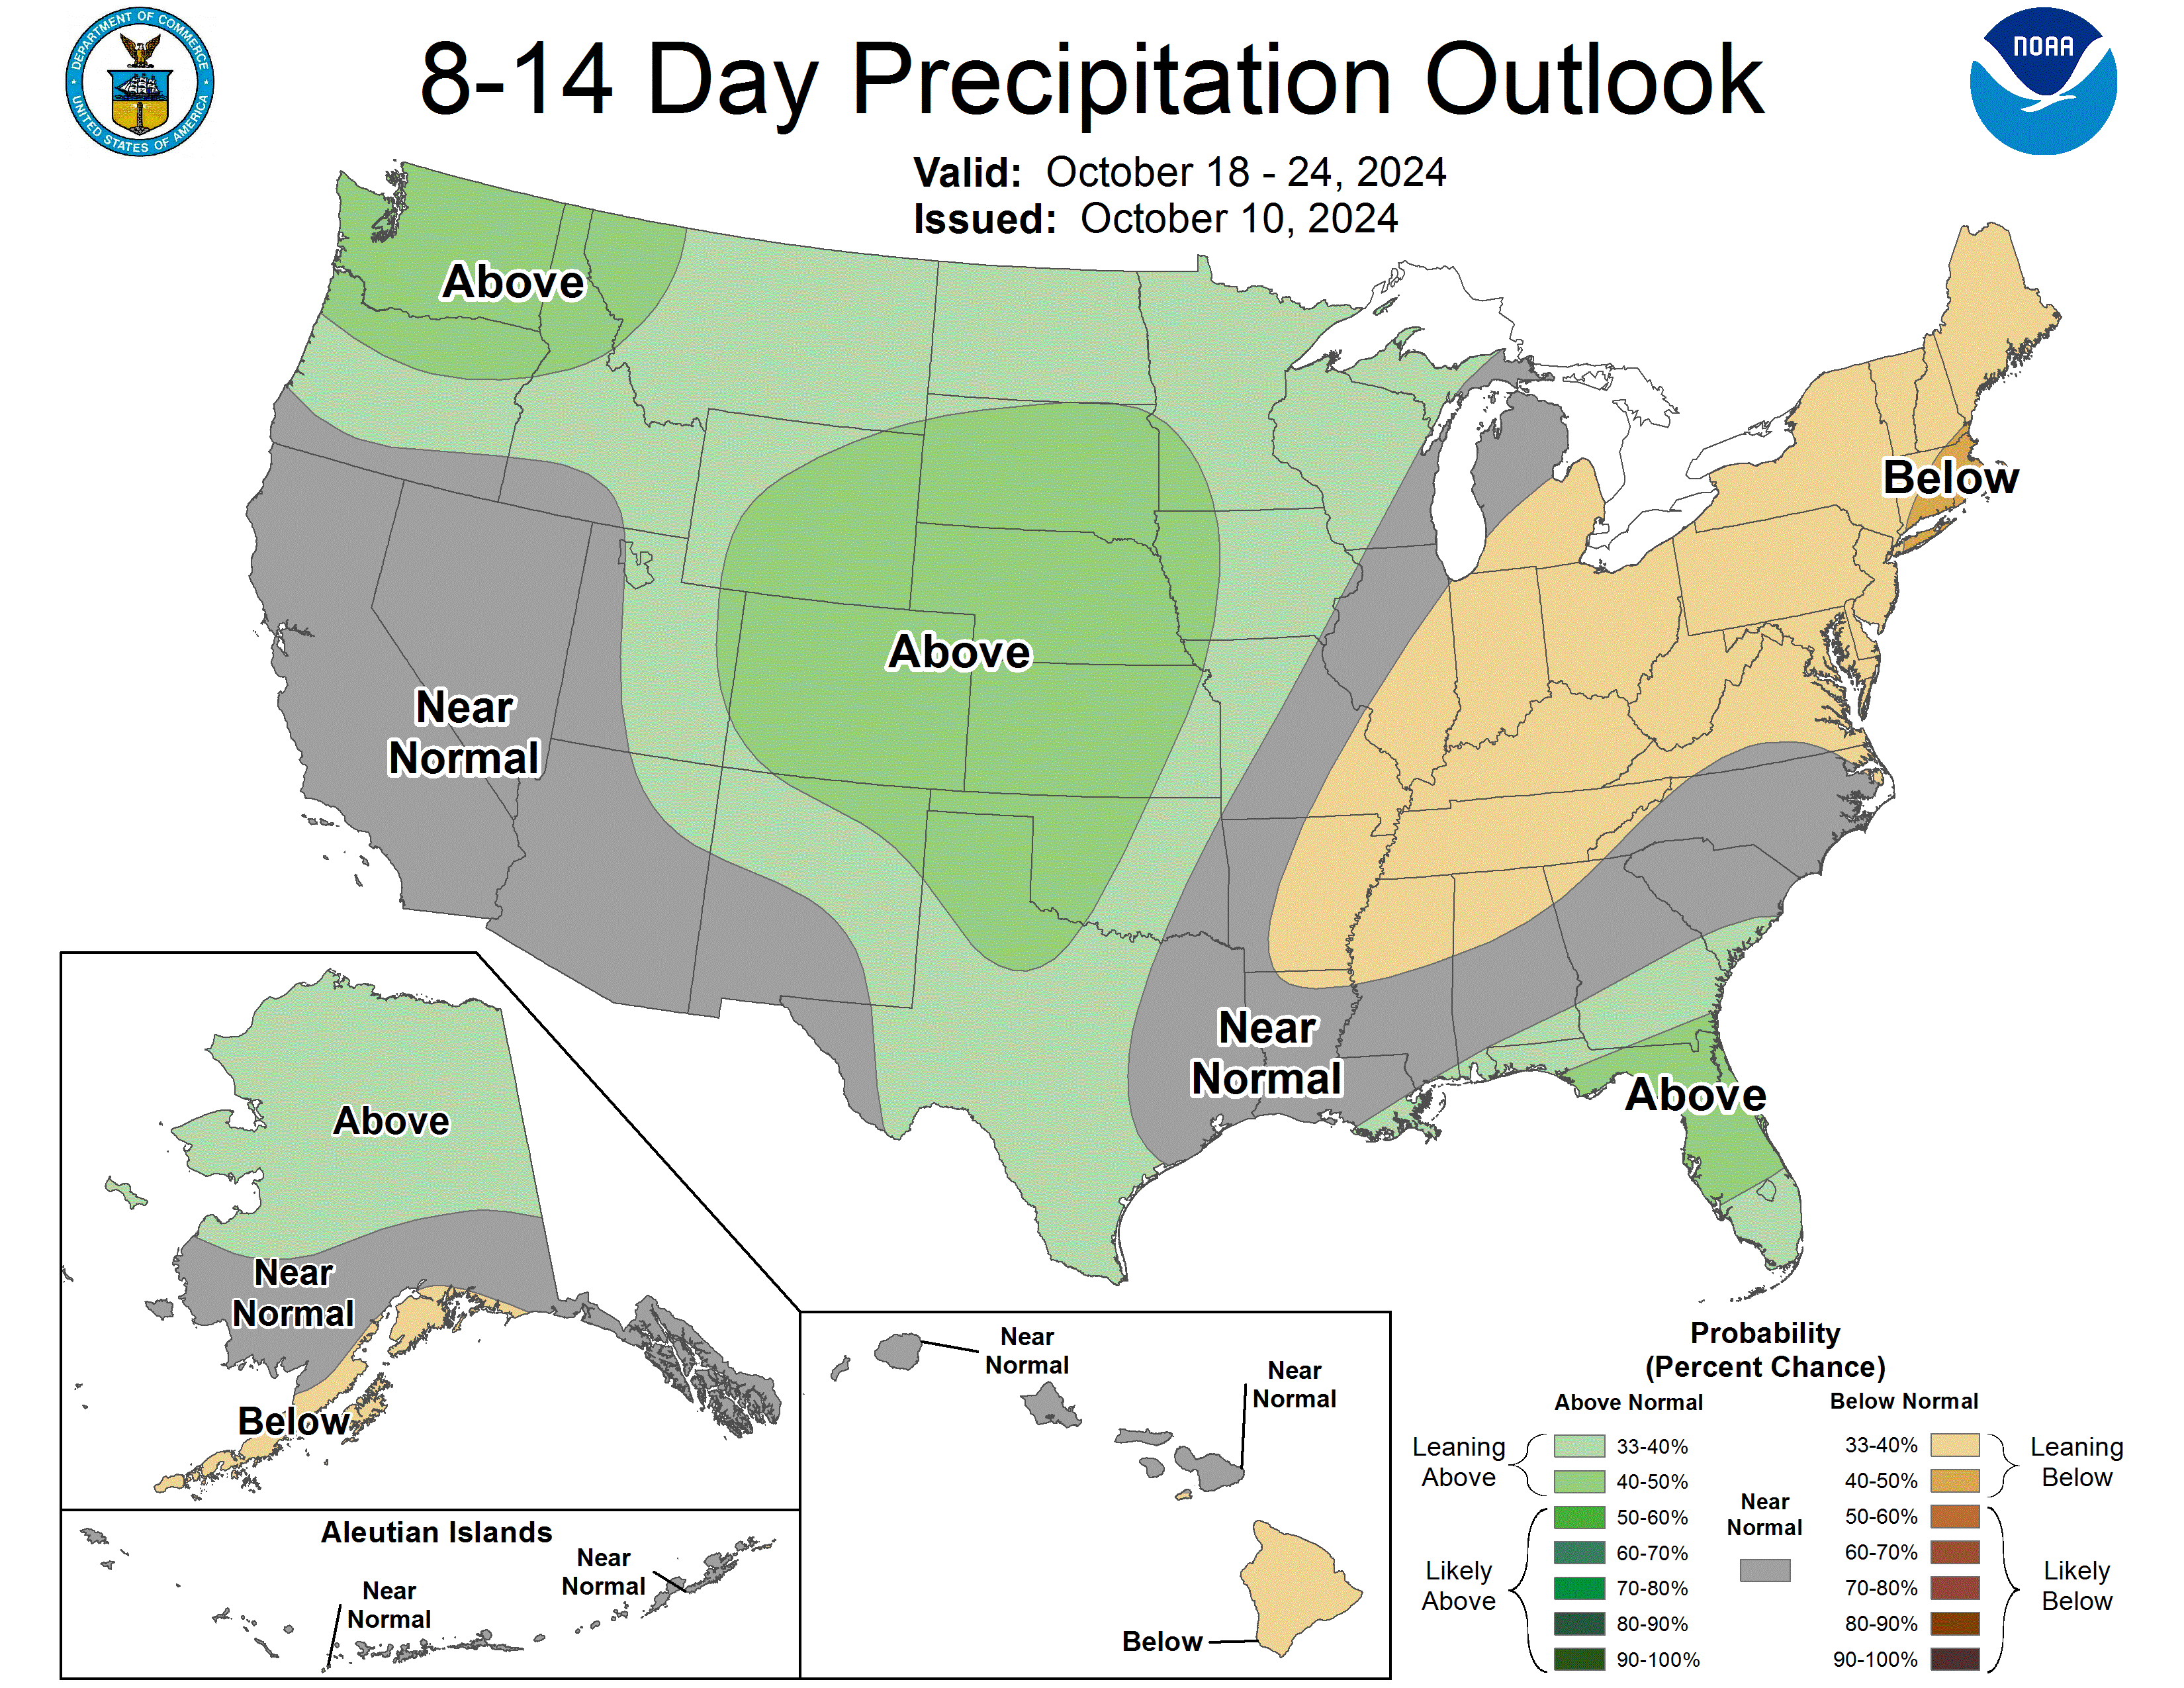
Man, this would be the best thing that can happen in the Plains and Midwest in drought!!!
Last 0z European model continues to increase rains in the Plains towards the end of these 2 weeks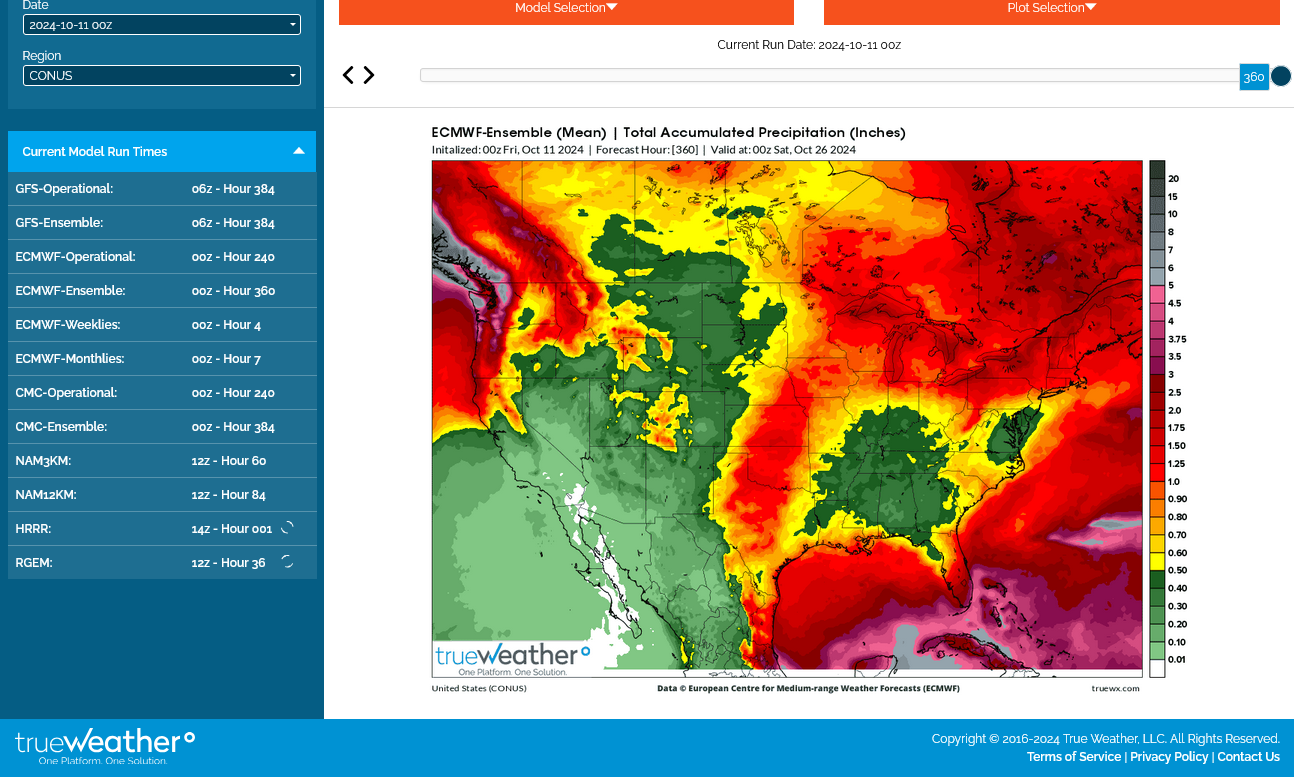
Here's the last 6z GEFS model run, now that this model is picking up on the week 2 rains, first predicted by the European model earlier this week.
These rains would be extremely welcome in the Plains and Midwest that have a drought currently. We want to recharge as much soil moisture as possible in the Fall, for the Winter Wheat crop to become well established before going dormant but also in the Spring so the soil moisture profile is favorable for next years growing season.
When the ground freezes up, especially in the northern areas, melting snow or rain will NOT soak in and instead, just become runoff until the ground thaws out.
So we need the moisture BEFORE the ground freezes.
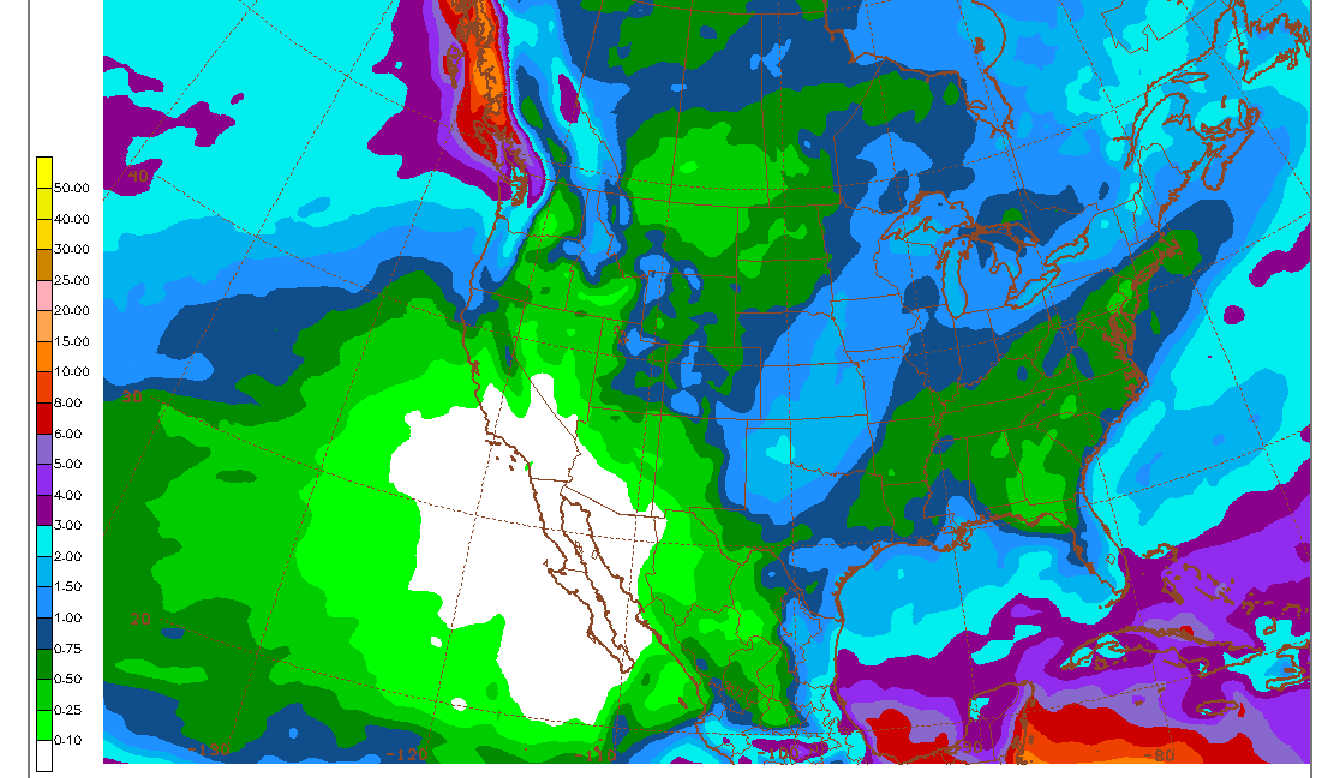
Late week 1 rains continue to be bearish for wheat, especially the KC/HRW wheat grown in the Plains. Not sure why the market bounced higher very early this morning.
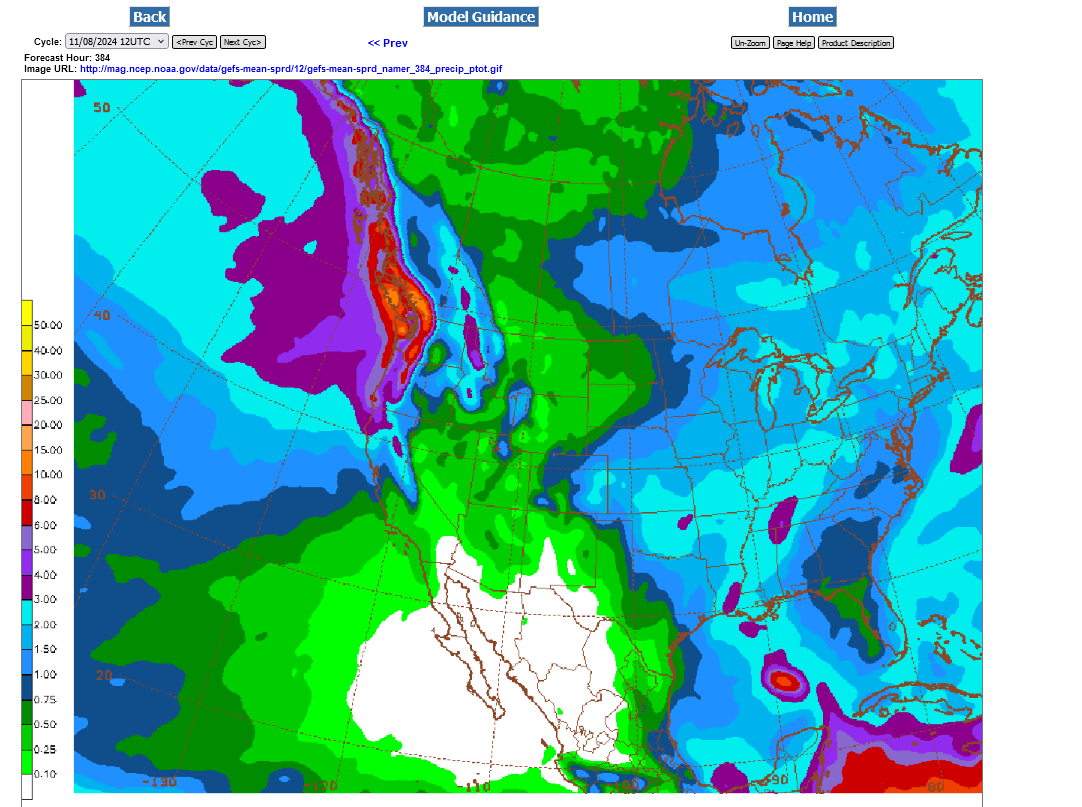
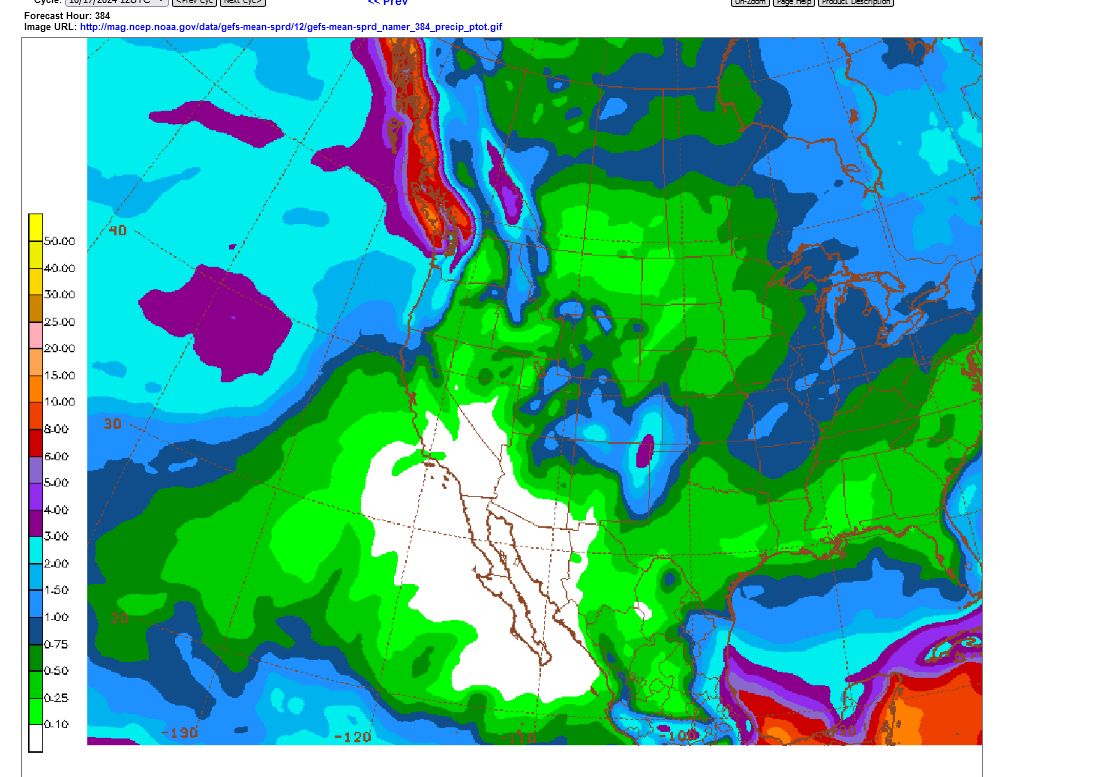
This was the last 6z GEFS model total liquid precip out 16 days(384 hours).

Not exactly drought busting, especially with much above temps in week 2 but at least rain chances return late this week:
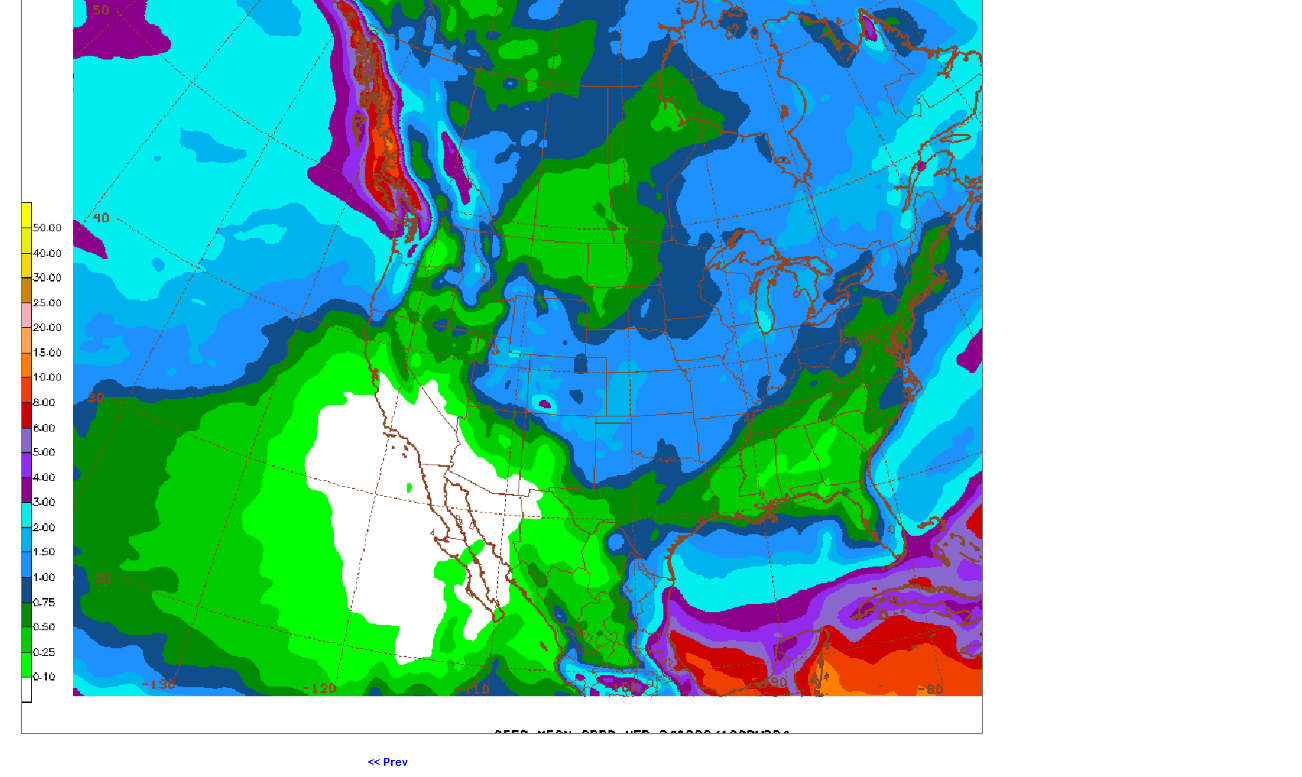
https://www.marketforum.com/forum/topic/83844/#83848
7 Day Total precipitation below:
http://www.wpc.ncep.noaa.govcdx /qpf/p168i.gif?1530796126

Last 12z GEFS total rains thru 384 hours. NOT ENOUGH.
All the weather:
Another state of emergency for #Russia's grain areas. The Kursk region on Thursday declared this emergency to help compensate farmers amid the drought that has killed winter grain crops. Kursk is Russia's 7th largest grain producing region and borders Ukraine to the north.
The latest forecast for Kursk is bone-dry through the rest of October and the two-month rainfall deficit remains substantial. However, there have been some showers in the last couple weeks, and apparently it doesn't take much to rejuvenate a parched wheat crop. Hmmm
BIG increase in precip for the central and eastern Midwest and almost all the SRW crop grown in those areas. The HRW is grown in the Plains. This is almost all towards the end of week 2:
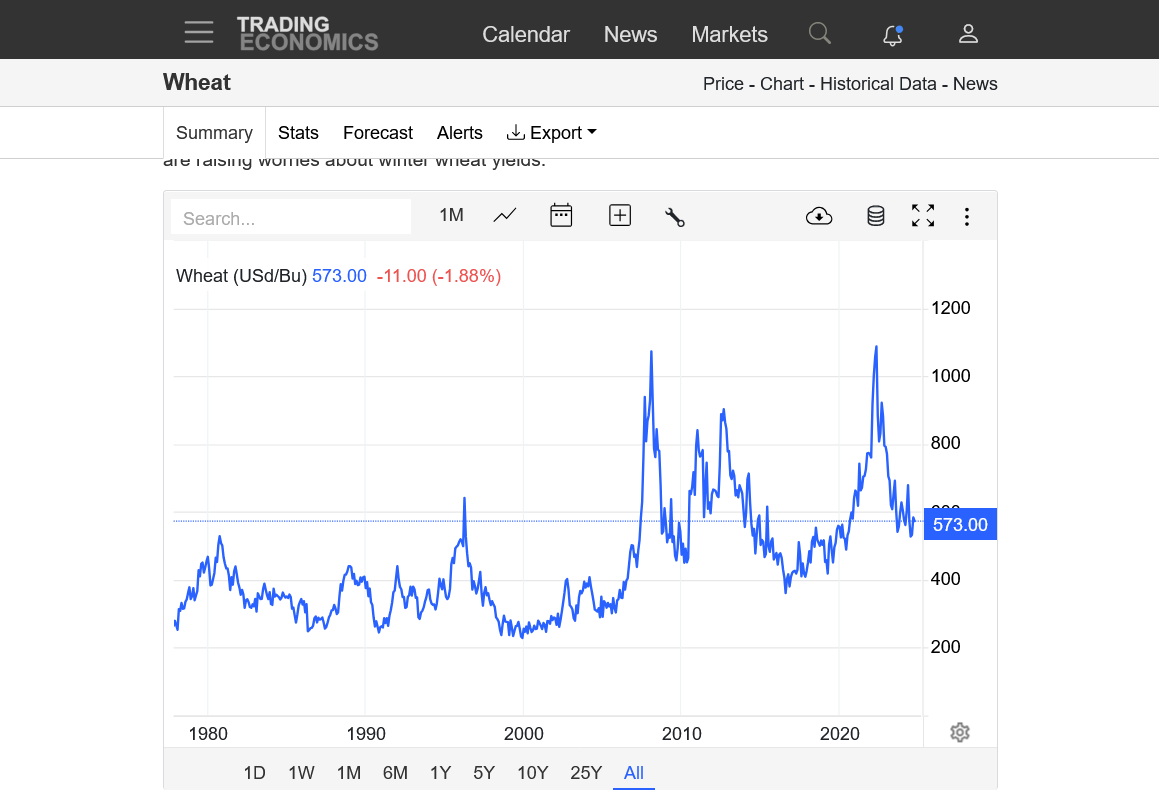
https://tradingeconomics.com/commodity/wheat
2. 1 year-Major high at the end of May. Major low at the end of August
3. 50 years-Historic highs in the Spring of 2022 and early 2008.
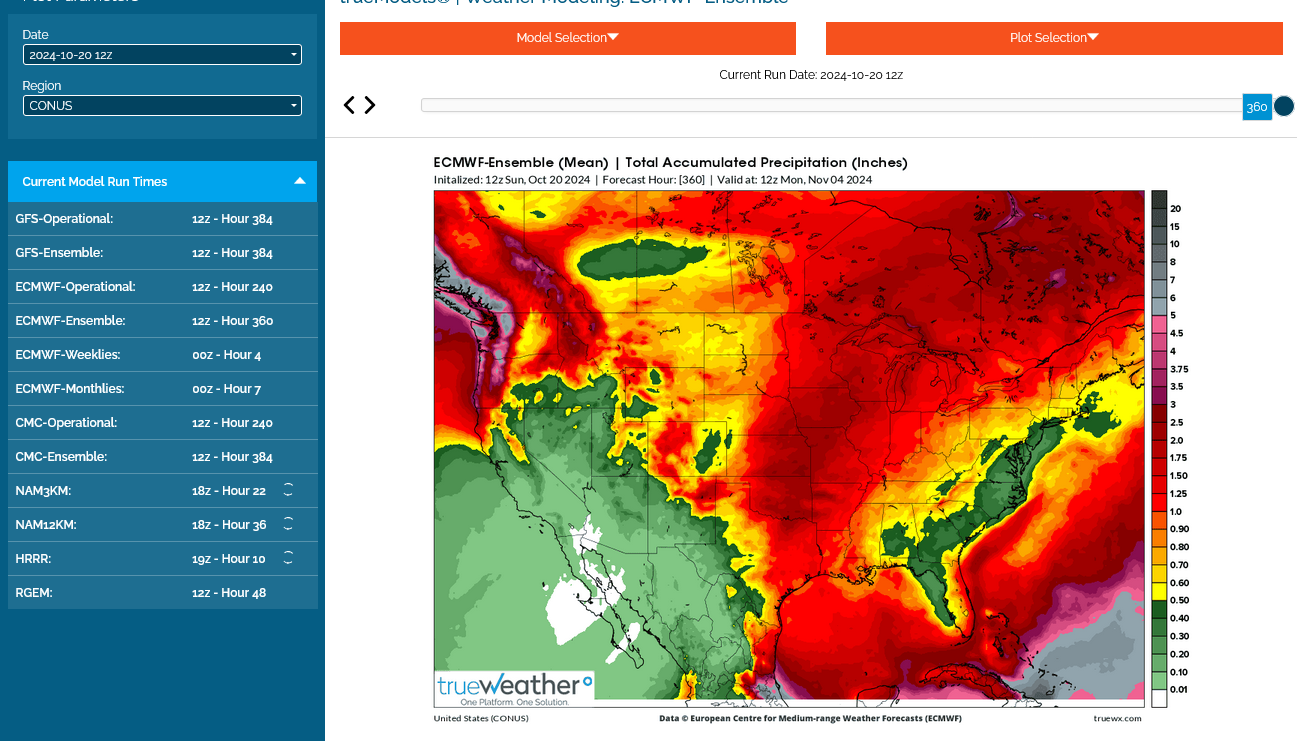
This source and the European model has crappy colors for precip totals (not sure why they don't use blue and green) but its got the most rains, mostly in week 2 for areas currently in drought. This was the last 12z run, just out for the next 15 days(much of it in week 2).
The darkest reds in the center of this map are close to 2 inches.
TrueWeather is a wonderful weather data source, despite these hot temperature and drought colors being used for precipitation.
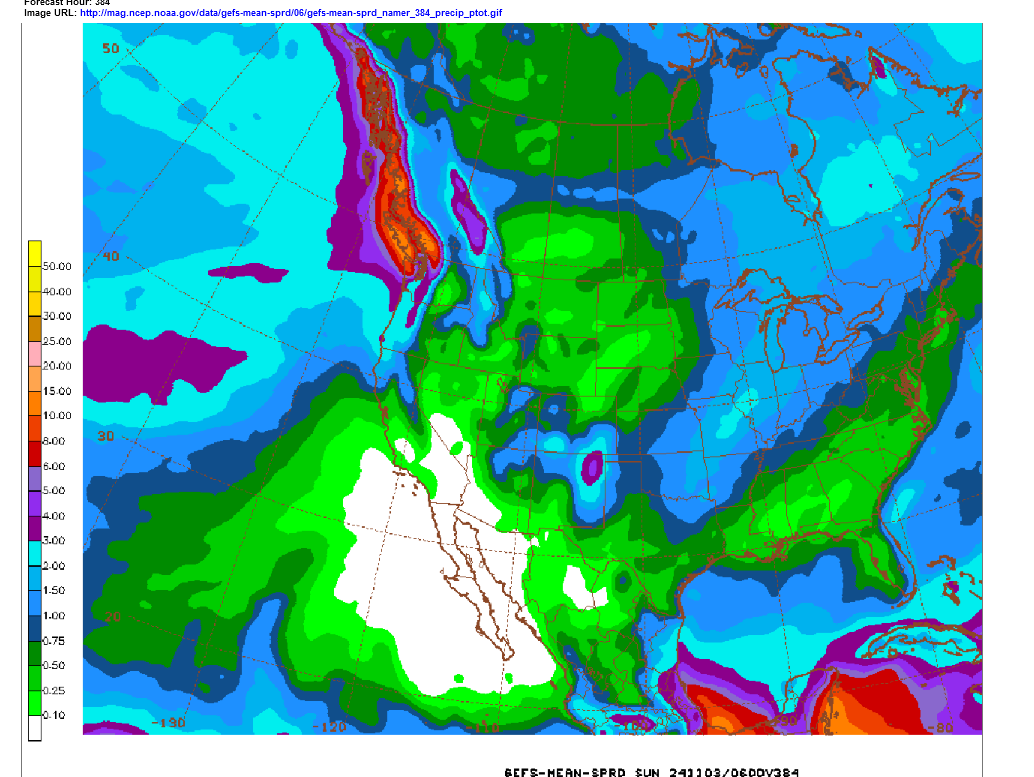
The GEFS (last 6z run below) has taken the lead of the European model and increased rains(totals thru 384 hours), mainly with a week 2 PATTERN CHANGE. Deep trough-West on the day 8 of the upper level chart below, along with the upper level ridge in the Southeast in a position to pump in Gulf of Mexico moisture: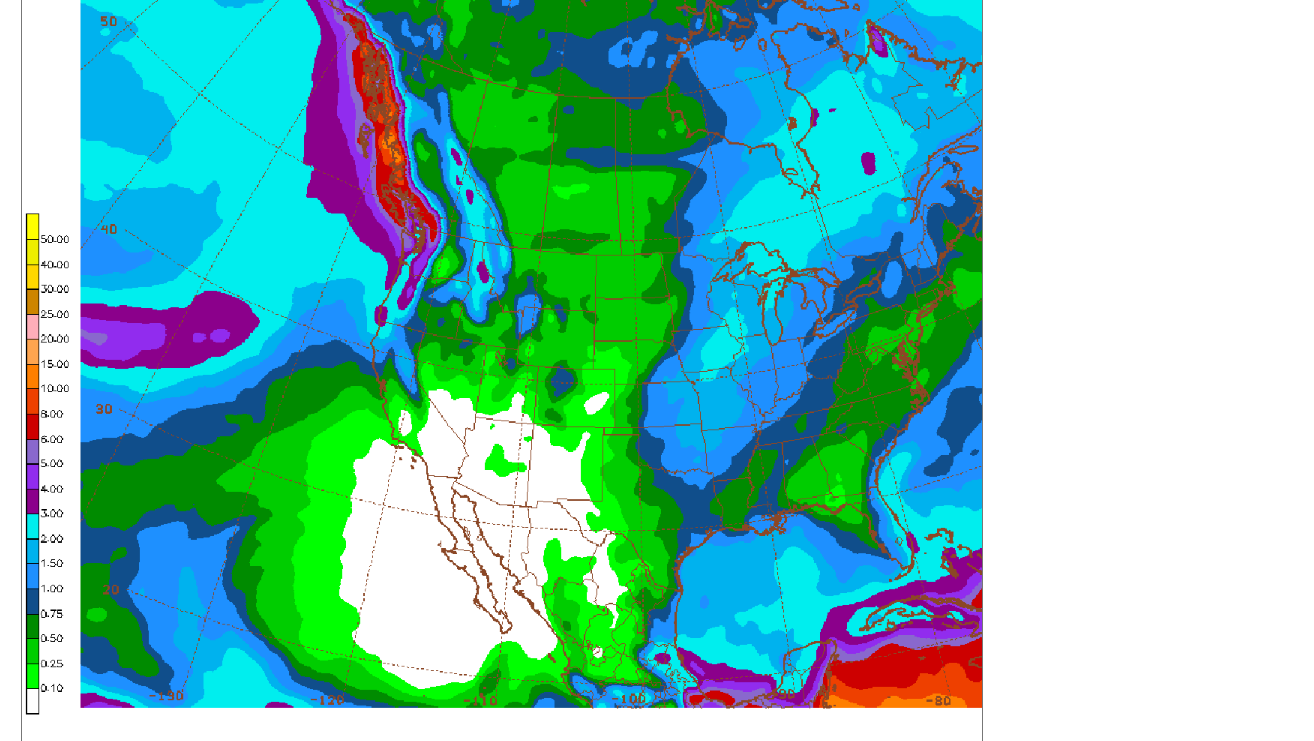
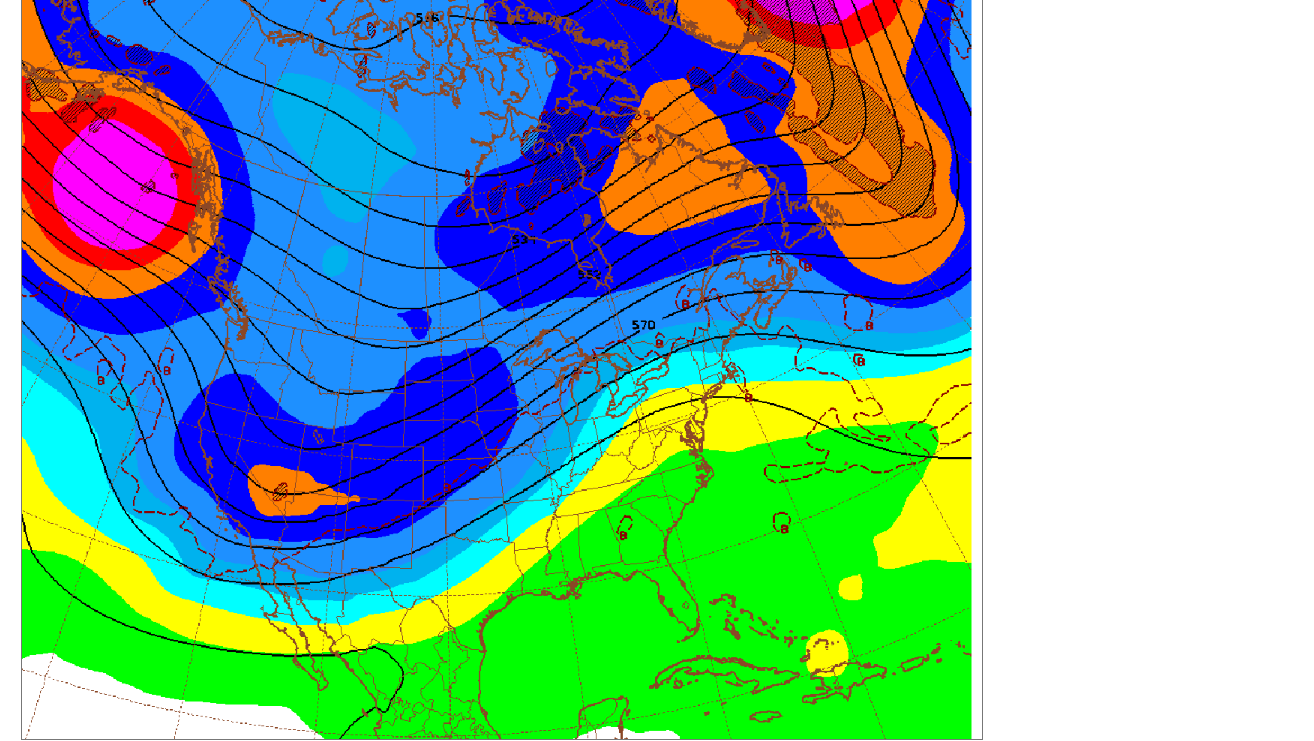
We haven't seen a map/forecast like this in a very long time! Months??
Wheat gradually gave up every bit of its +10c early morning gains as the day went on!
https://www.marketforum.com/forum/topic/83844/#83852

Last 6z GEFS. Total rain for the next 384 hours. Decent rain events/bearish(first 1 in months for some areas) but NOT a permanent pattern change to break the drought.
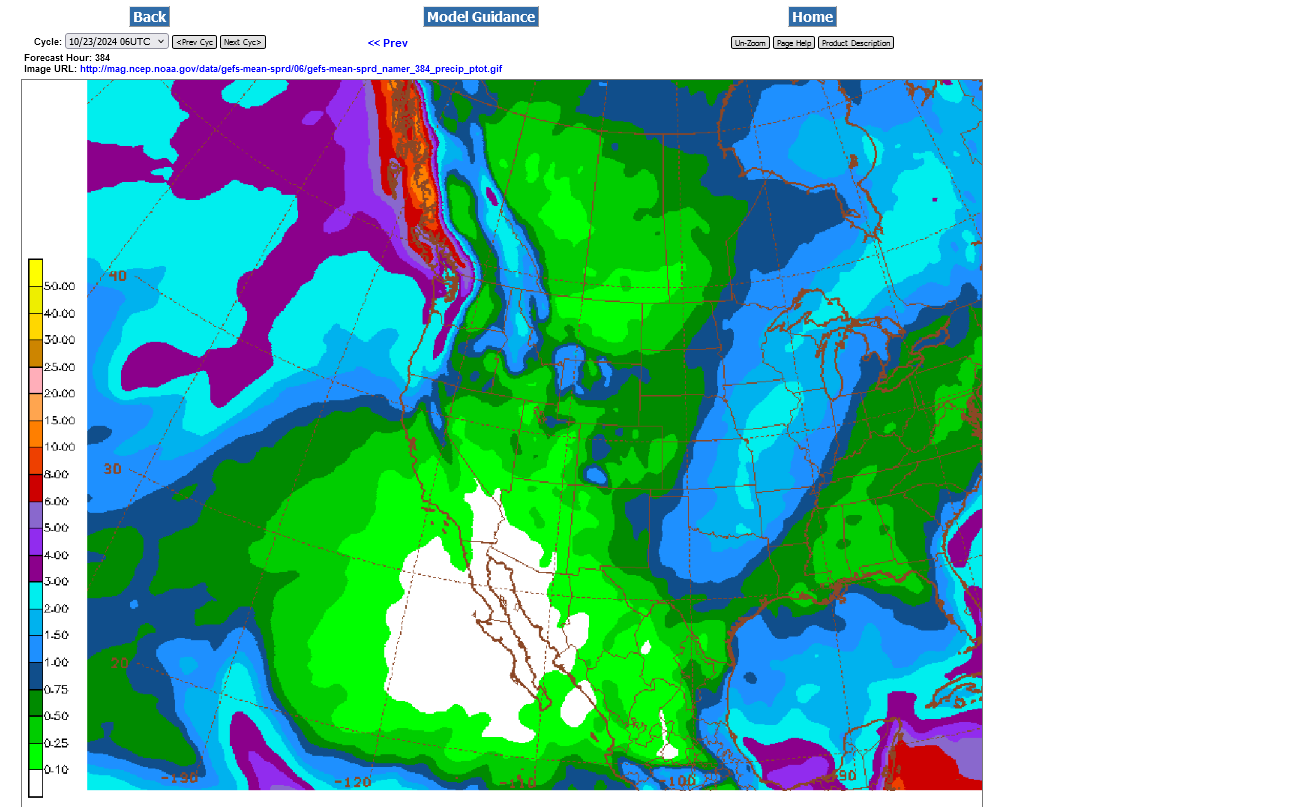
Decent rains next week for luckiest locations but NOT a drought buster and it only lasts for a few days, then back to the dry pattern at the end of week 2!
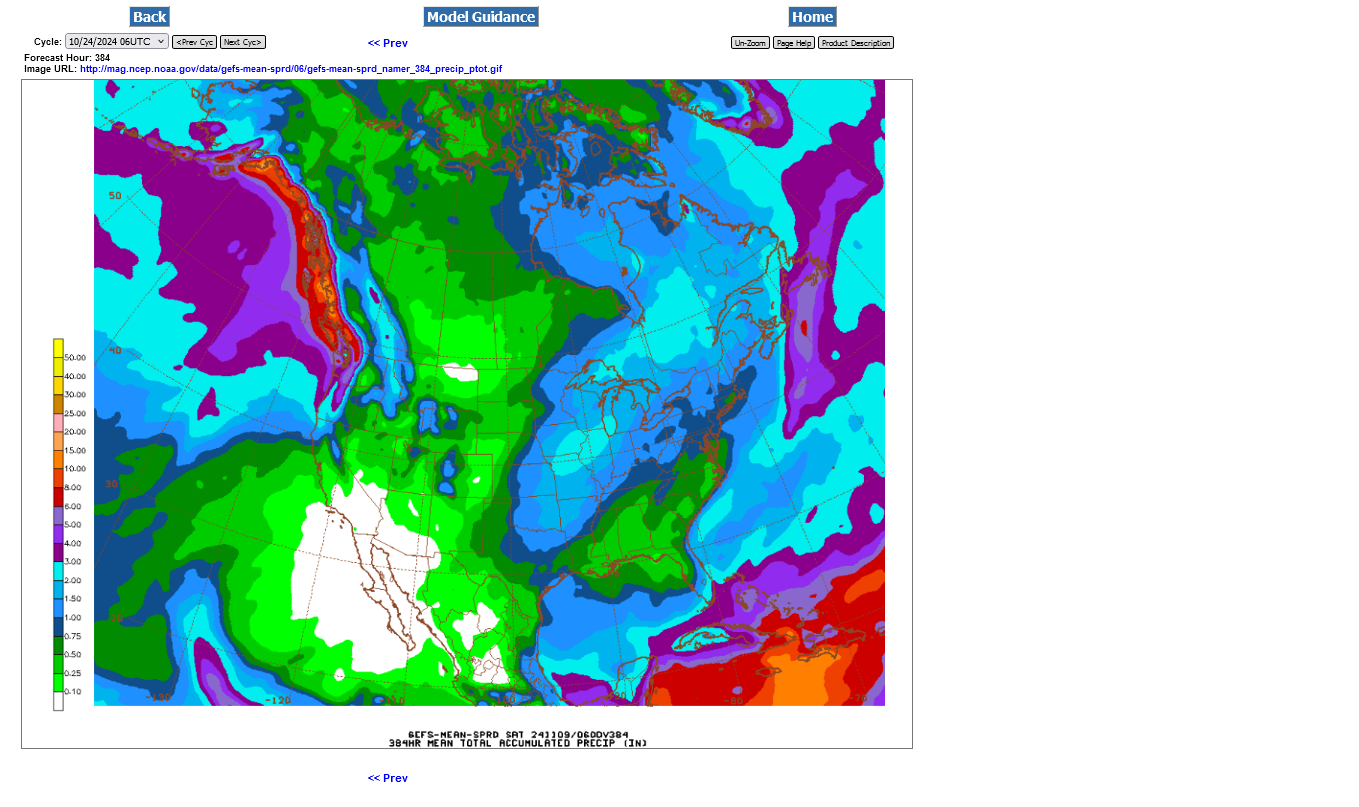
Rains boosted a bit on the last 6z GEFS for the next 384 hours but this is NOT drought busting. It looks like pattern after 2 weeks will go back to being dry.
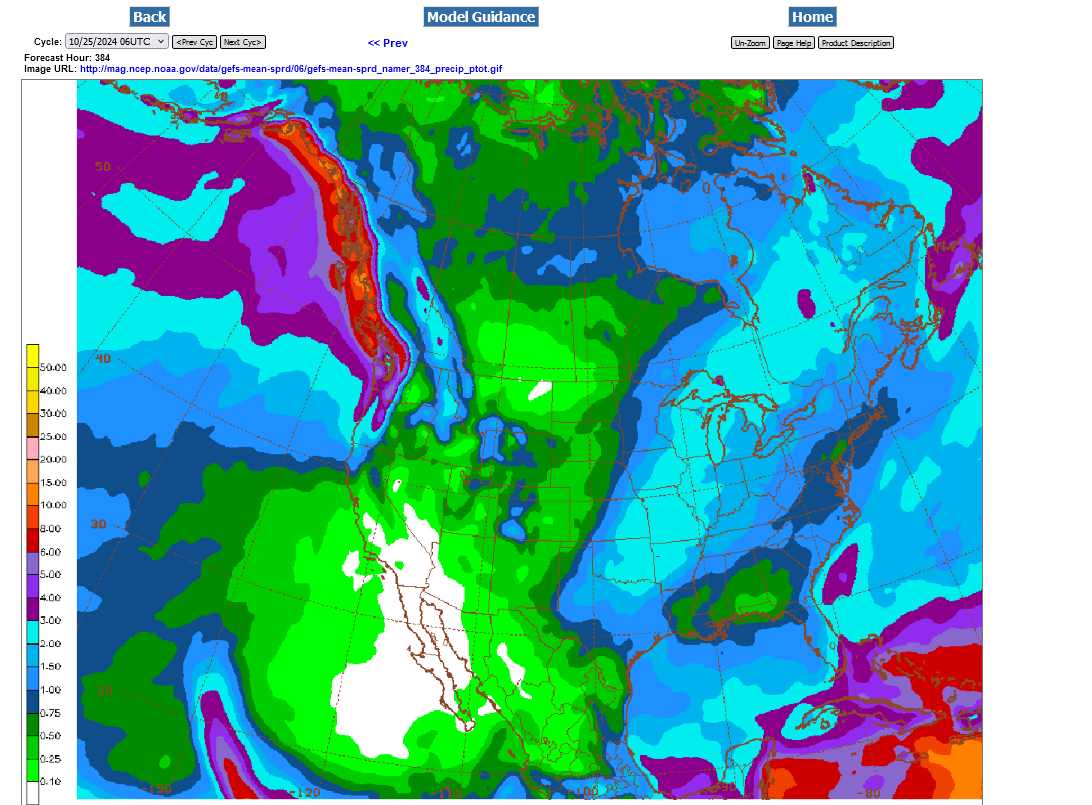
https://www.marketforum.com/forum/topic/83844/#83853
https://www.drought.gov/current-conditions
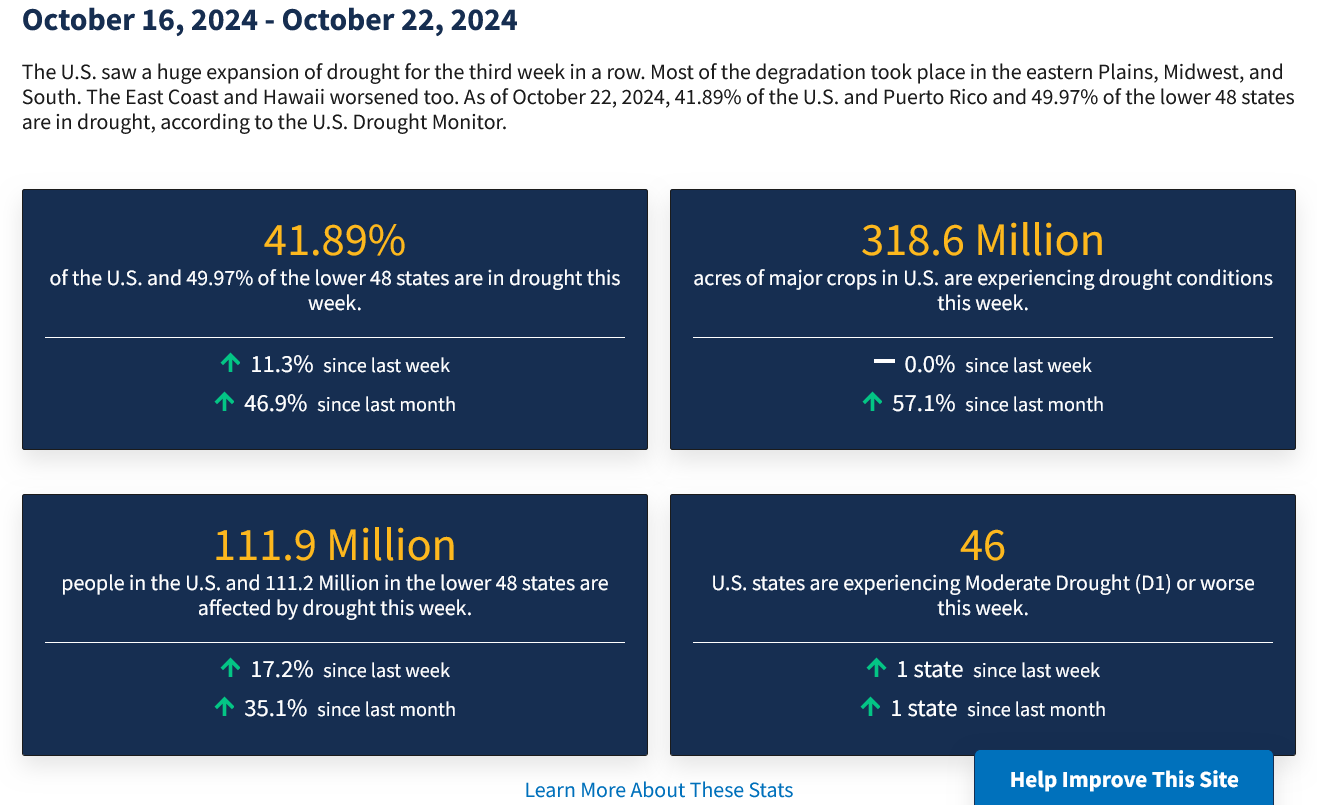

Great discussion on drought here:
2 week rain amounts on the just out 12z-October 26 GEFS. This looks transient(back to dry after that period)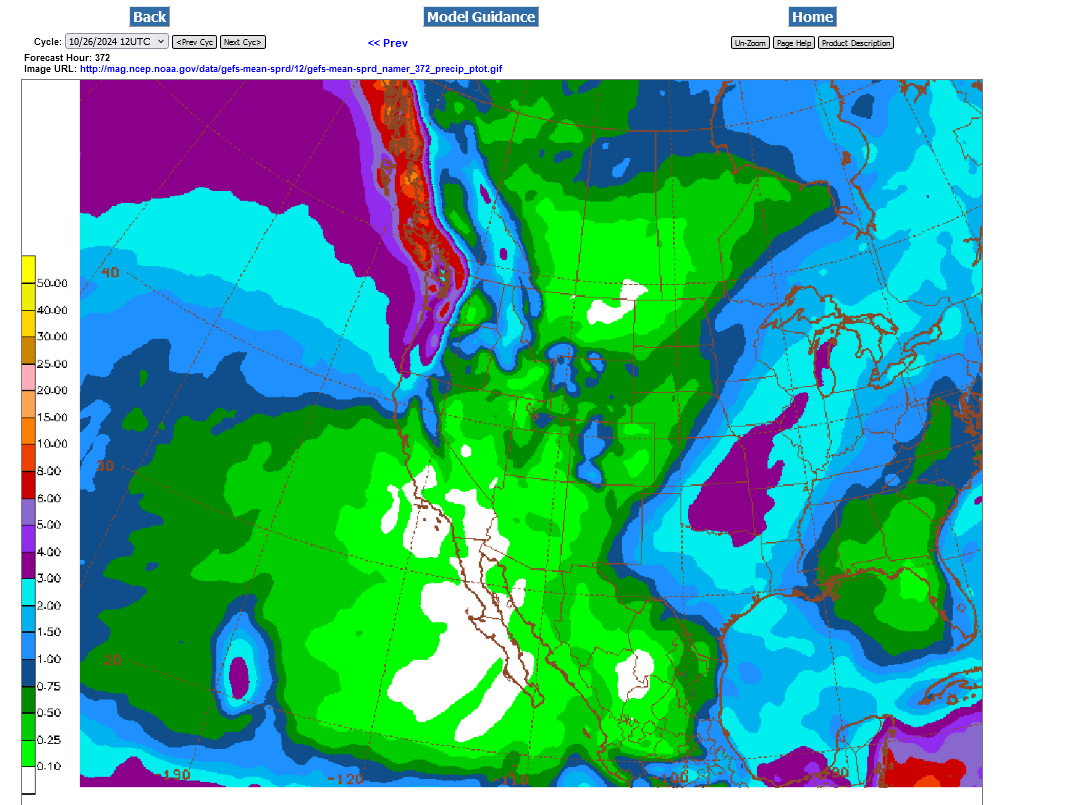
Last 18z GEFS 10-27-24 Total rains 384 hours Wheat is lower to start the week. Extremely welcome!!!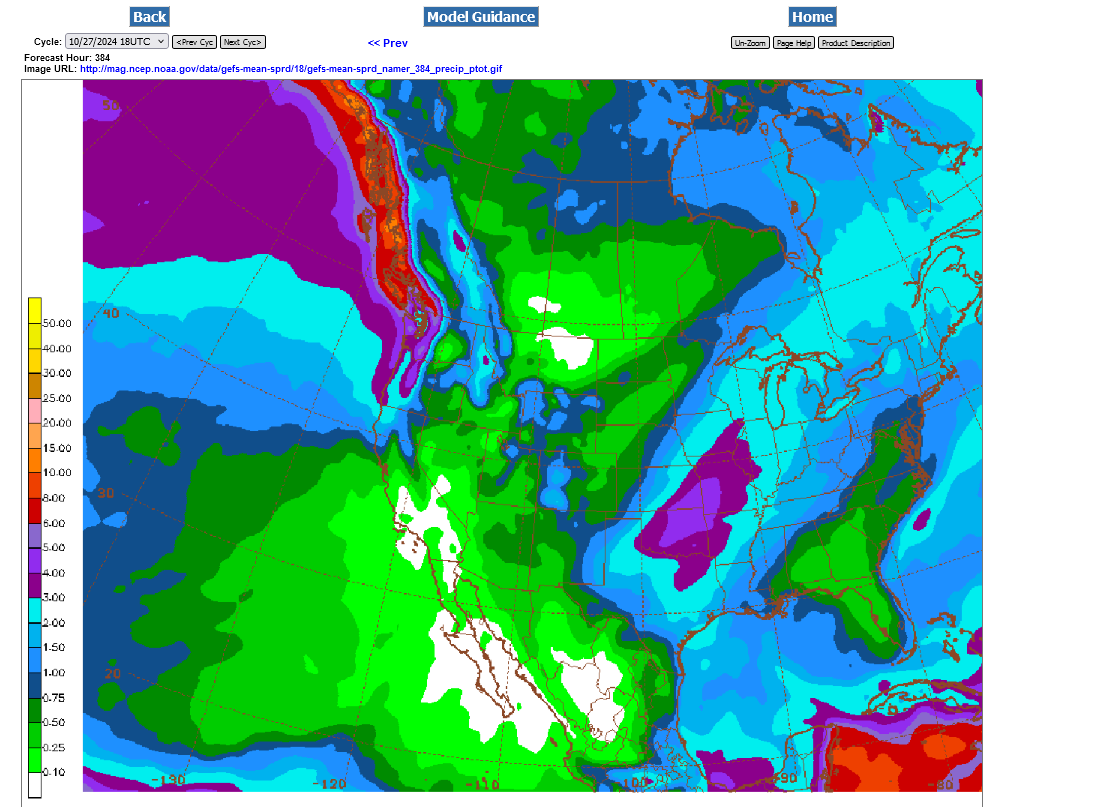 ++++++++
7 Day Total precipitation below:
http://www.wpc.ncep.noaa.govcdx /qpf/p168i.gif?1530796126

As expected, the MAJOR drought is impacting conditions of the Winter Wheat crop that has been planted.
USDA rates 38% of U.S. winter #wheat in good or excellent shape, below the year-ago 47% and the week's second-worst on record (28% two years ago). Weaker ratings than last year across the board, top grower Kansas a bit better. Many dry areas should see rain in the coming days.
Now comparing against the five-year average for the date.....
As of Sunday, 89% of U.S. #soybeans were harvested (most for the date since 2010) and #corn was 81% finished (most for the date since 2012). However, only 38% of winter #wheat is in good/excellent condition, below all trade estimates, which ranged from 42-53%.
Entire report here:
Wheat has double digit gains today because of the market being surprised at how bad the current crop condition is from the drought.
however, this is in spite of the most rain in the forecast for many severe drought areas in many months.
Rains have been increasing every day for a week now. Latest maps when back in the office.
The amount of rain, will actually make a serious dent in the drought for many areas.
2 week rains from the last 12z GEFS.
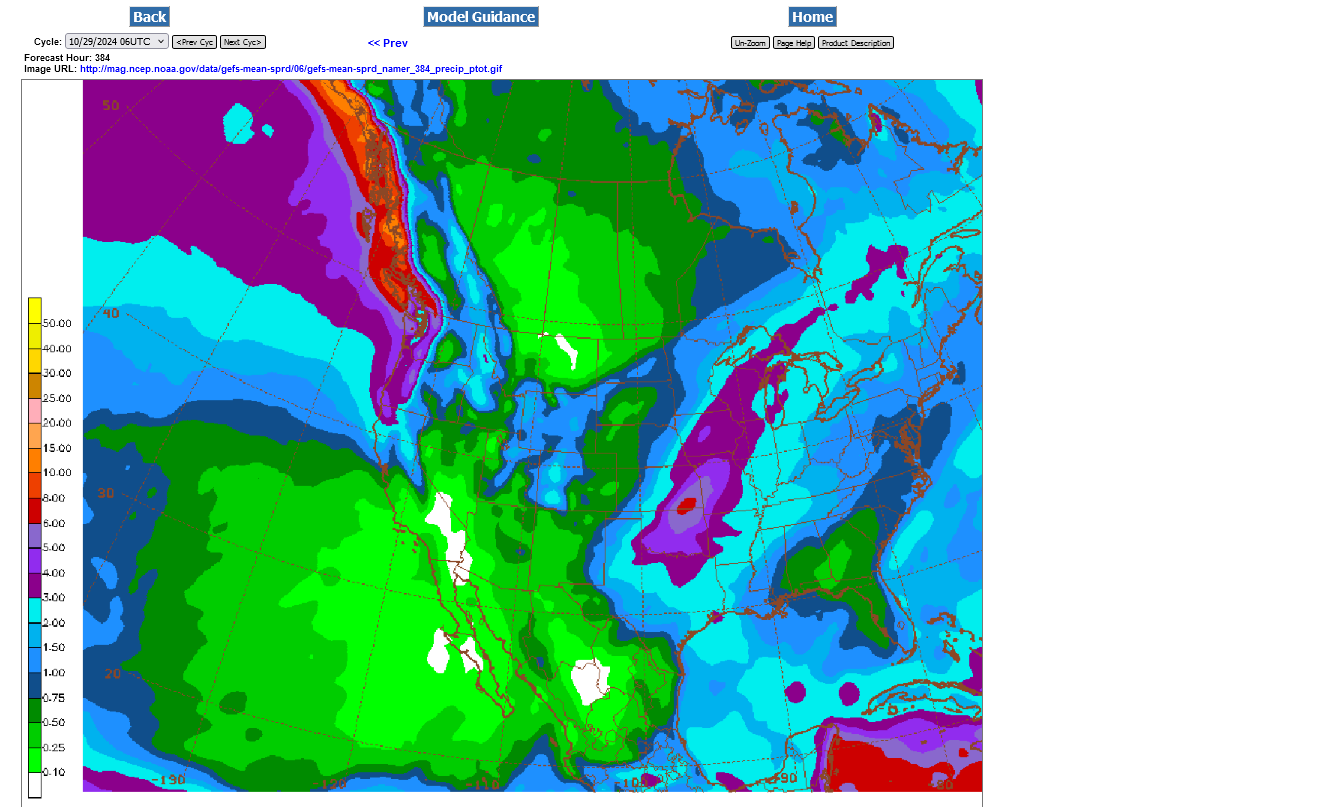
Get all the comprehensive weather here:
384 hour rains from the last GEFS. BIG Dent in the drought for many areas!
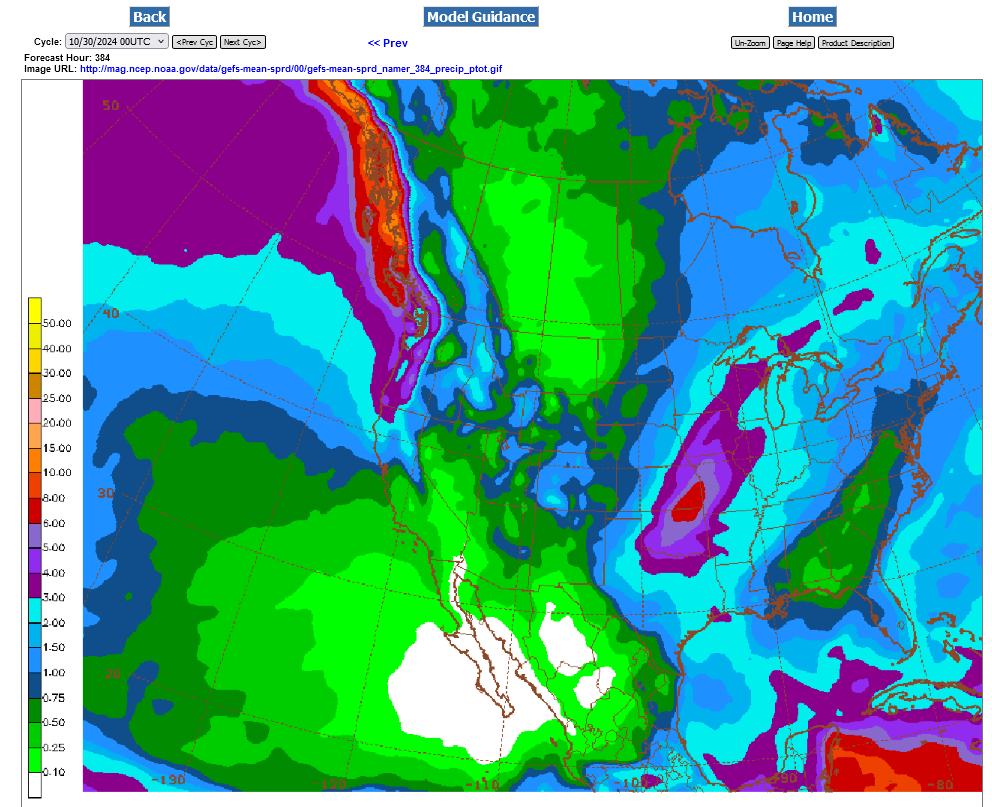
Rains have continued to increase in drought areas which will almost wipe out the drought in some spots. Just what the vegetation/crop doctor ordered.
Total 16 day amounts on this last 6Z GEFS. WOW! This is NOT like most La Nina's!

This will be a drought buster for many areas!!
384 total rains from the last 12z GEFS below.
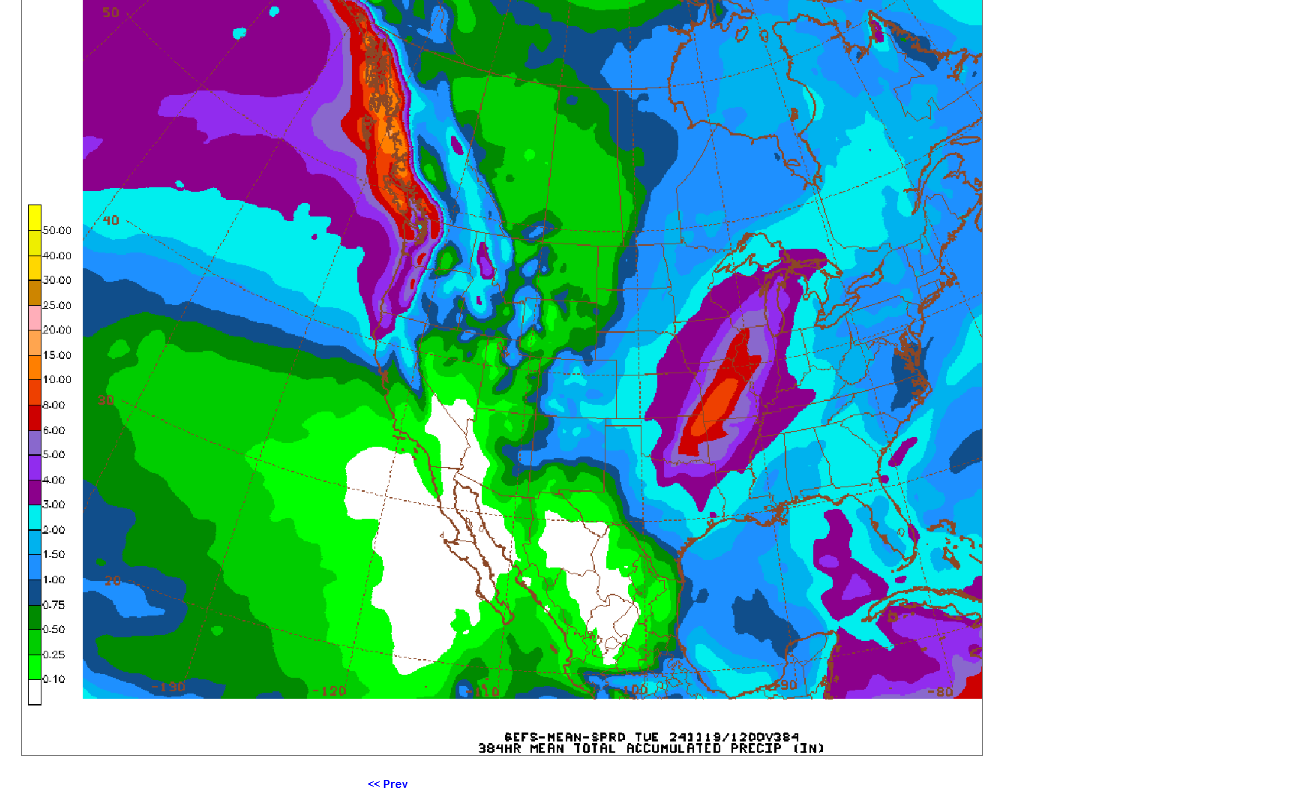
Comprehensive weather details: https://www.marketforum.com/forum/topic/83844/
2 week rains. Continuing to erode the drought in some places and help Winter wheat soil moisture, especially for #1 producer KS:
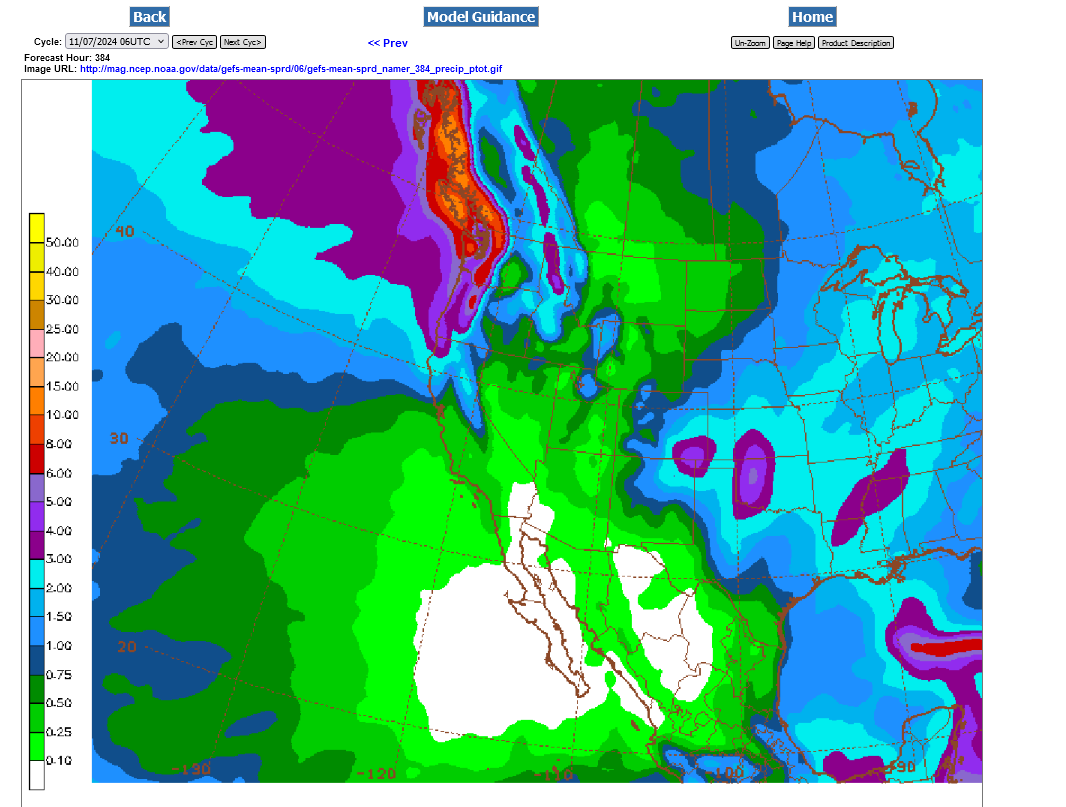
Still more rains to come the next 2 weeks. Especially southern and Eastern Midwest. Also C/S Plains.
