This is worth it's own thread and I don't want to completely bog down the great tropical weather thread that Larry started for us.
To get you up to date on this rain event.
Weather-UPDATED LINKS
https://www.marketforum.com/forum/topic/83844/
Previous post from that link:
I got .05 and the NWS got .04 here on the last Saturday in August after 29 days with 0 in the rain-gauge at Evansville, IN.
This broke the consecutive days with 0 streak but it was only enough to wet the ground and contributed nothing to help us with the FLASH DROUGHT. We have another 2 weeks with no rain coming up. Things are getting really bad here. We'll be spending several hundred $$s more in irrigation the next week+.
I feel certain that this will be in the top 5 for driest stretches in history for us and it could be the driest??? I just can't find records for Evansville, IN right now which go back to before 1900.
The DP is incredibly low and comfortable today, in the 40s but with the strong breeze, this is just drying things out faster. Fortunately, we will see MUCH cooler temps which is part of the problem with this pattern......NO GULF MOISTURE with dry, continental air masses dominating.
This is being caused by the rapidly developing La Nina:
La Nina here we come!
8 responses |
Started by metmike - June 14, 2024, 10:23 a.m.
https://www.marketforum.com/forum/topic/104931/
https://www.marketforum.com/forum/topic/104931/#107114
Note the extremely dry areas from the Eastern Cornbelt, southward!
https://www.marketforum.com/forum/topic/83844/#83853
Soilmoisture anomaly:
These maps sometimes take a day to catch up to incorporate the latest data(the bottom map is only updated once a week).
https://www.cpc.ncep.noaa.gov/products/Soilmst_Monitoring/US/Soilmst/Soilmst.shtml#
![]()

++++++++++++++++++++++++++++
Updated daily below:
https://mrcc.purdue.edu/cliwatch/watch.htm#curMonths

DROUGHT MONITOR
https://droughtmonitor.unl.edu/
Sept 4, 2024 FLASH DROUGHT IN MANY AREAS(thanks to oncoming La Nina)!!!
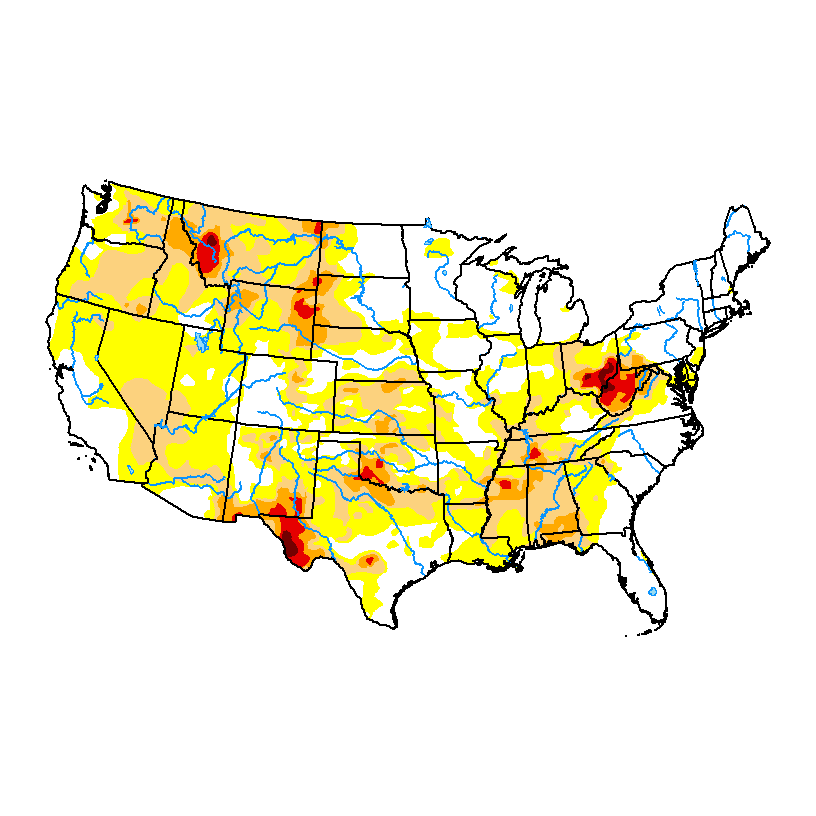
We are bone dry here. I checked out a soybean field earlier today and found pods that were NOT filling well.
It was still completely green as these hybrid plants, along with beneficial CO2, causes all plants to be drought resistant (less transpiration loss from roots thru stomata on the underside of leaves which don't need to open as wide to capture the elevated CO2 in the air).
However pods are filling right now and the plant needs much more moisture, which is absent in our soil to help maximize the size of the seeds inside the pods.
The seeds inside the pods were mostly pretty small, so the pods were pretty flat on many plants.
Since the plants were all green still, I'm thinking they were planted late and a rain in 5 days can still help.
All the weather forecasts earlier this month were looking at, potentially another 2 weeks of dry weather
That has changed drastically the last 3 days because of what will be the remnants of tropical system, Francine.
This was the updated forecast on Saturday:
Re: Re: Re: AEW in E ATL could be next TC
By metmike - Sept. 7, 2024, 11:41 p.m.
cutworm,
Great stuff by Eric, as always.
The last 12z European model is more bullish on rain chances here at the end of next week:
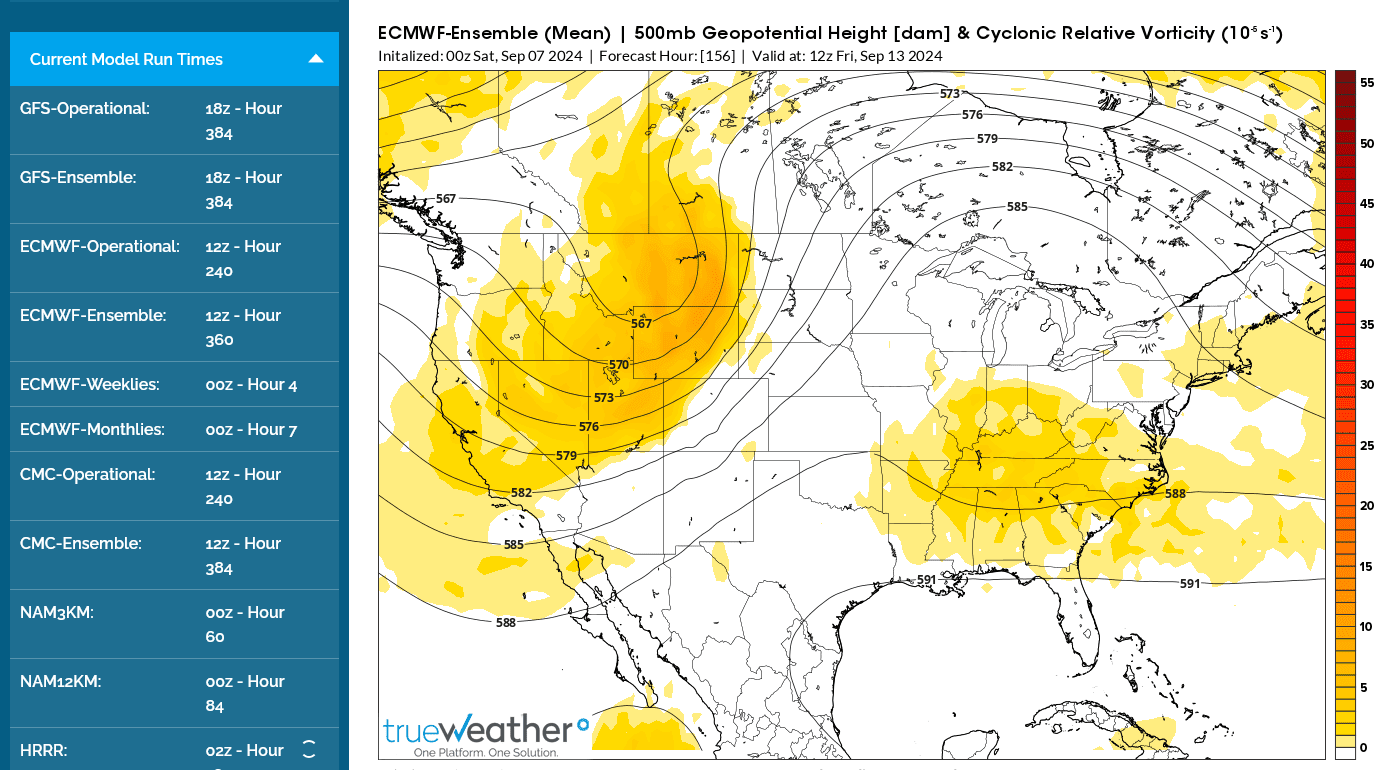
1. Previous 0z 500 mb forecast for the end of this week.
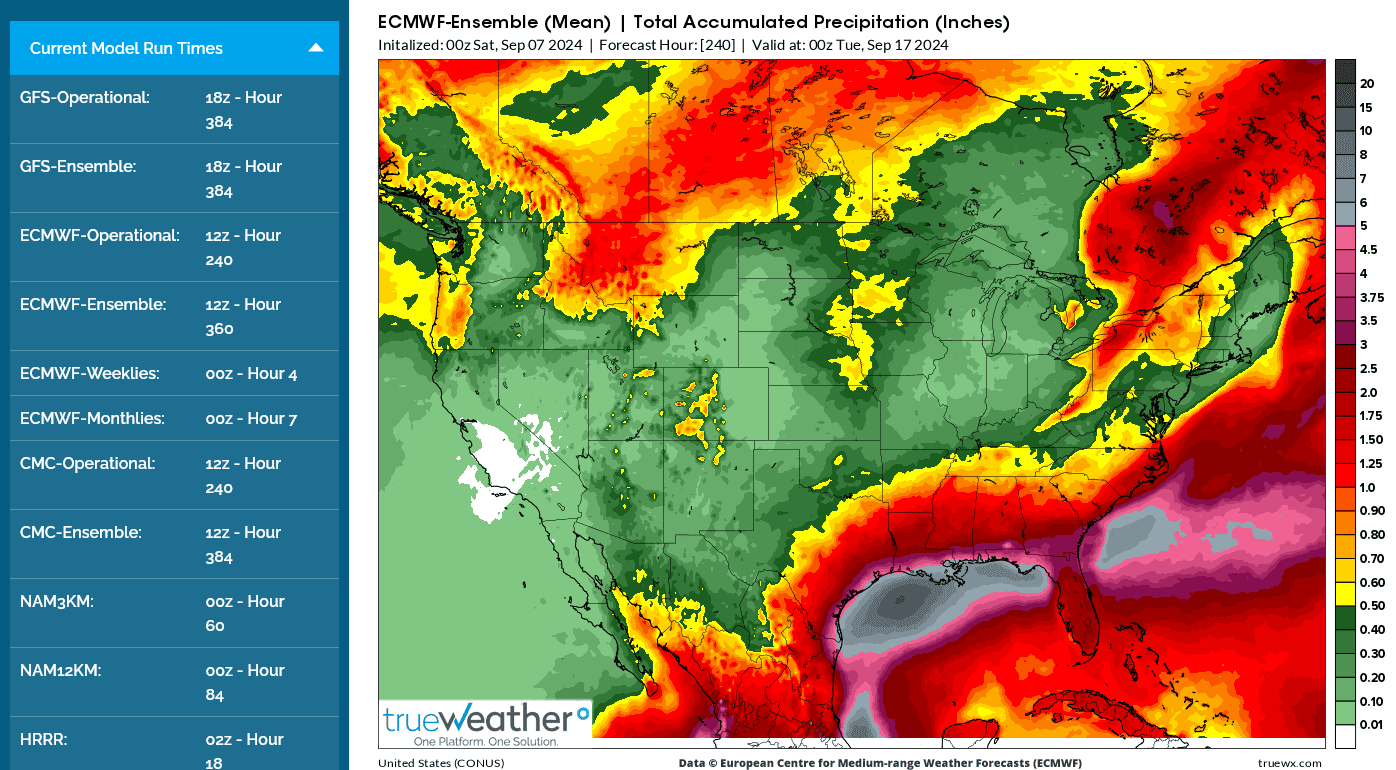
2. Followed by total rains thru 9 days. for that model from 12 hours ago.
+++++++++++++++++++
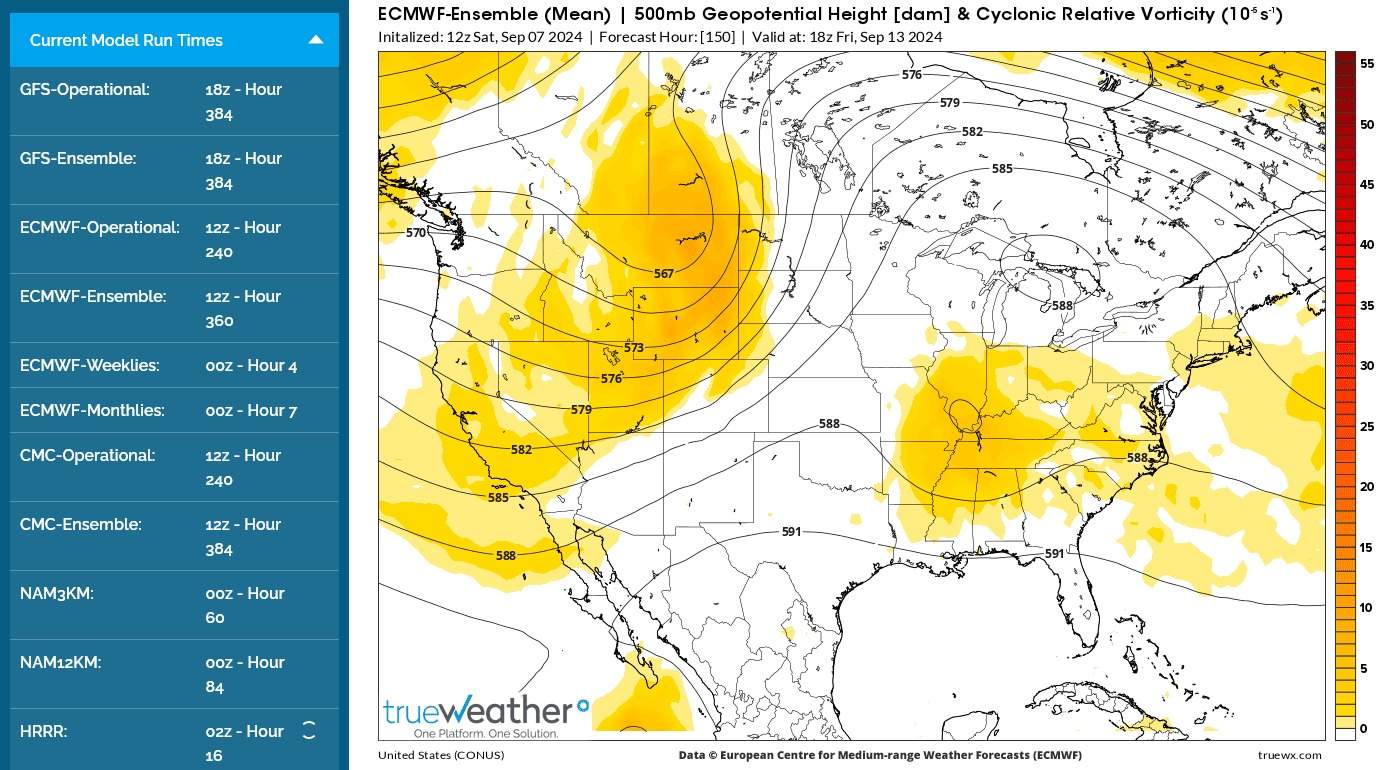
3. Last Euro 500 mb forecast for the end of the week. Vorticity pattern is farther north with a small cut off low in extreme southern IL.
4. Rains thru 9 days MUCH farther north by 200+ miles, almost from Indianapolis to Dayton, OH line.
+++++++++++++++++++++++++
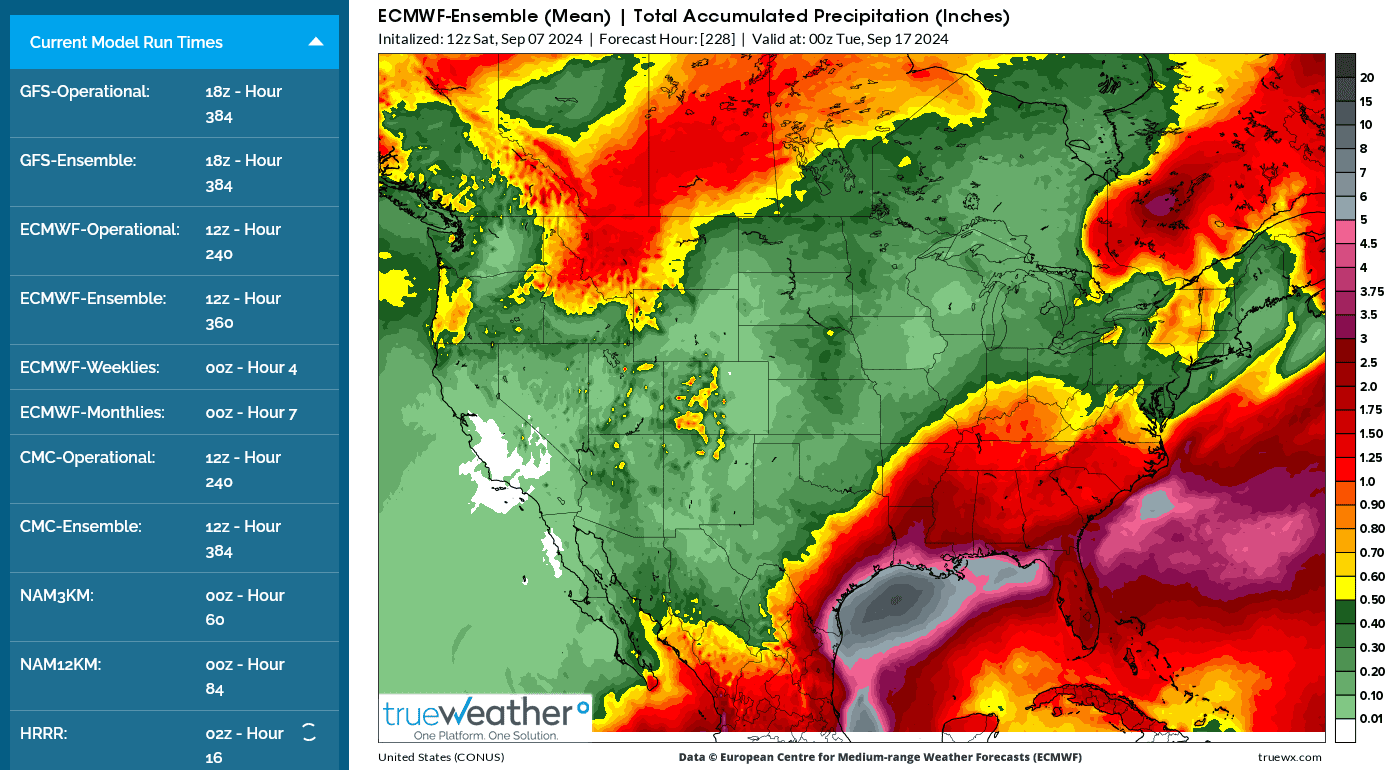
12z data from the European model
We now have the forecast reasoning to justify making the forecast much wetter at the end of this upcoming week. The Canadian model is even farther north and the last 18z GEFS, for the first time has moved towards this solution..
5. 12z Canadian model
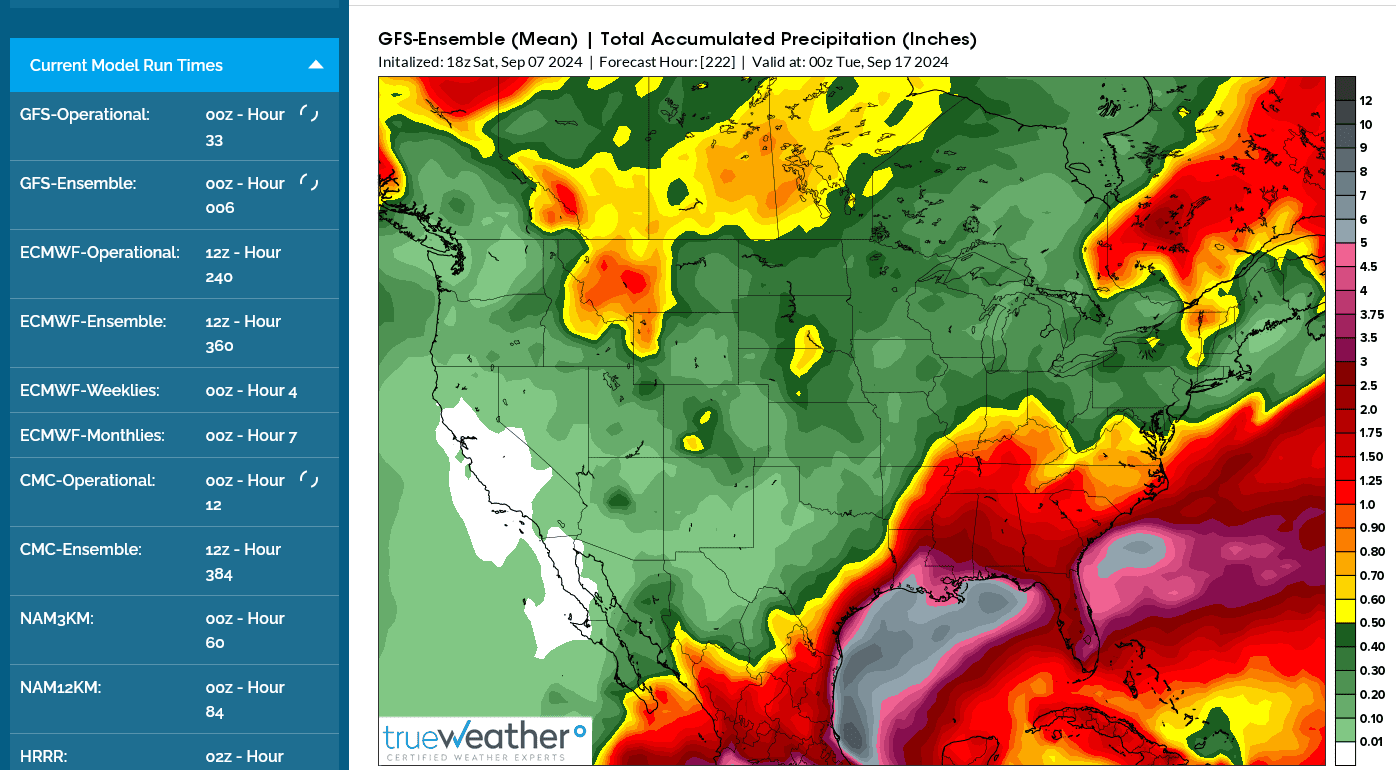
6. GEFS 12z run
7. 18z GEFS model. Rains MUCH farther north.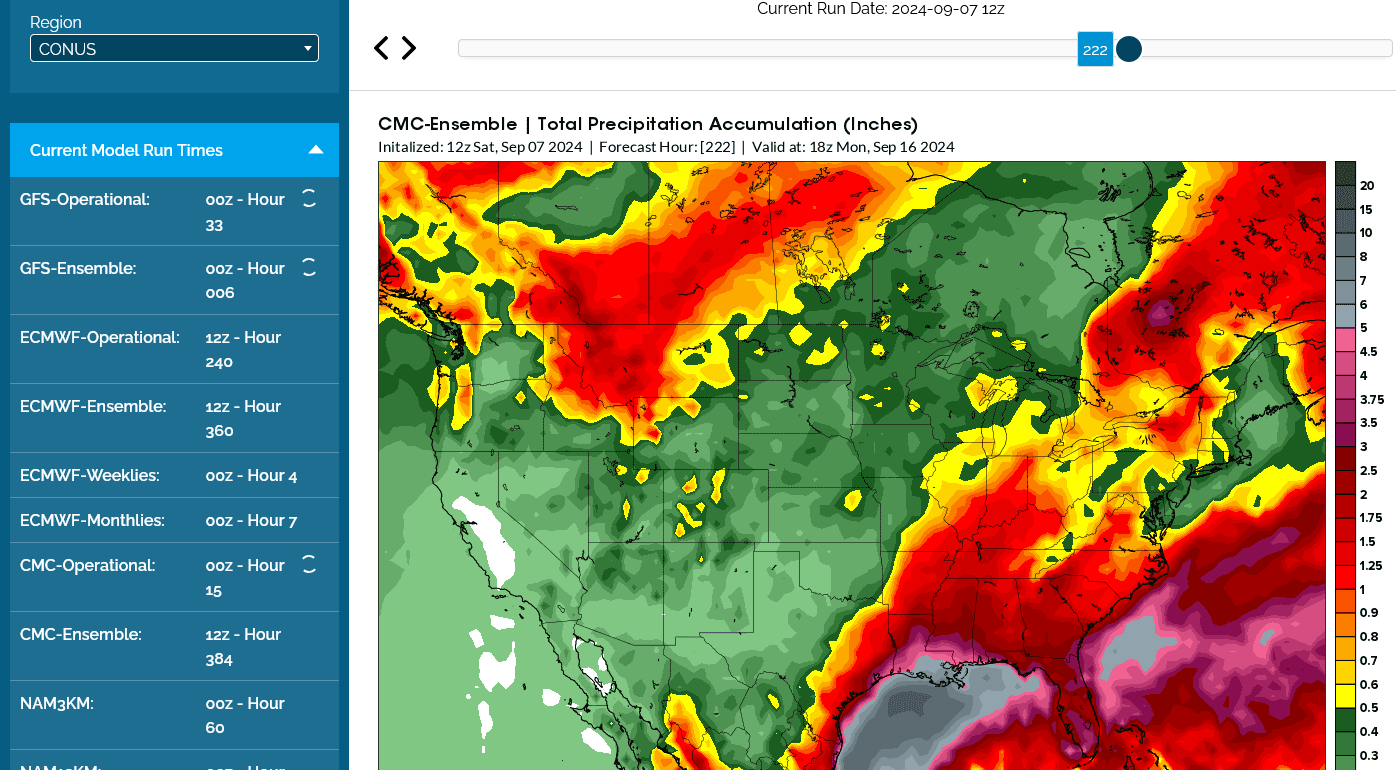
+++++++++++++++++++++++
6. GEFS 12z run
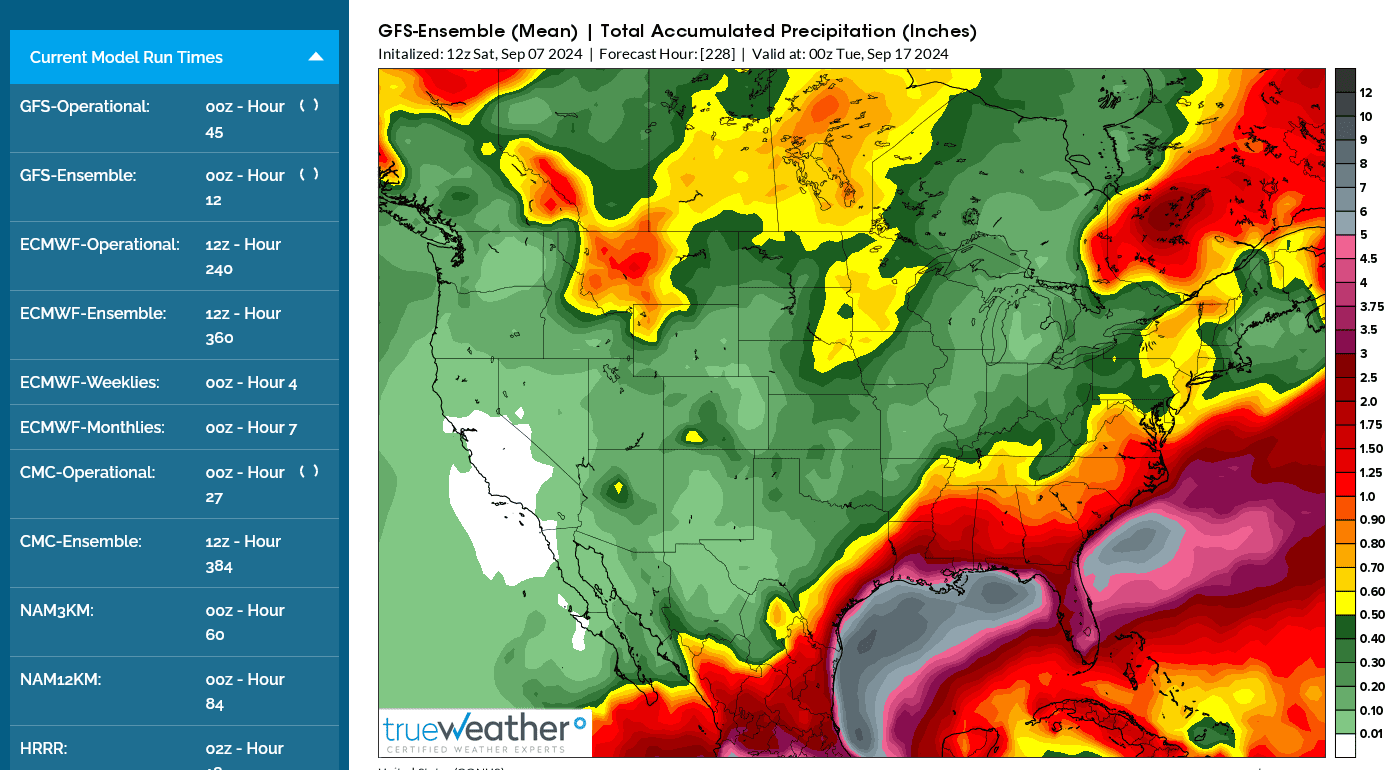
7. Last GEFS 18z run. Rains much farther north.
Things can move back in the other direction/south again but this is potentially good news to help with the flash drought in the Ohio Valley
Here on Sunday, things are looking ever BETTER!
Re: Re: AEW in E ATL could be next TC
By metmike - Sept. 8, 2024, 9:20 p.m.
In 4+ decades as a meteorologist, I've never been this excited about the potential for the remnants of a tropical system to hit us!!!!!!
Potential for 2 inches of rain to take us out of one of the driest 5+ weeks in history for Evansville, IN.
.05 in our rain gauge since August 1st.
https://www.nhc.noaa.gov/refresh/graphics_at1+shtml/213729.shtml?cone#contents
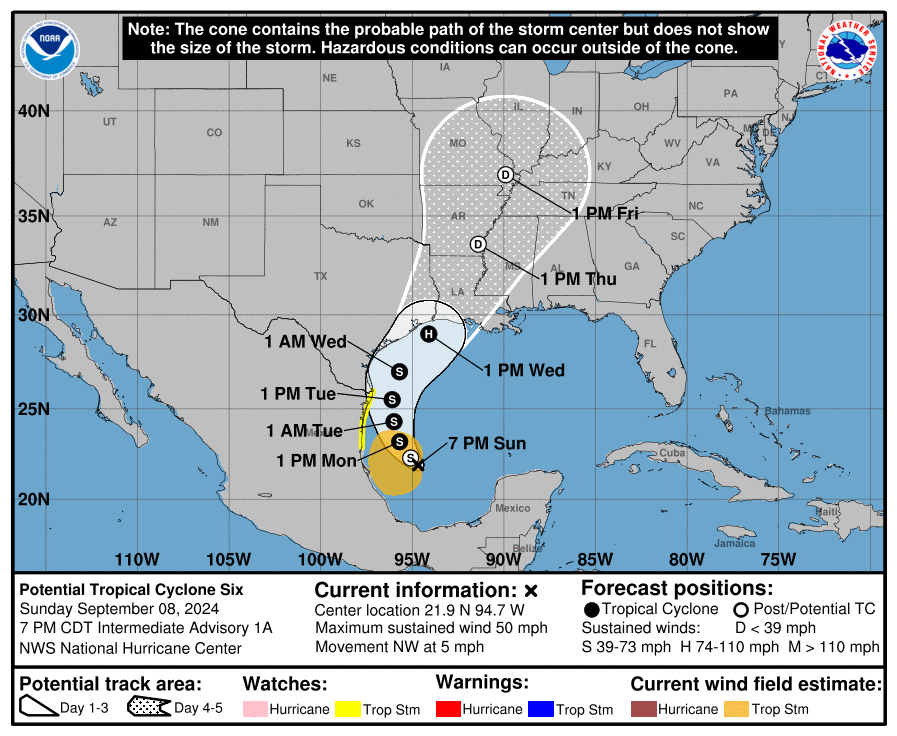
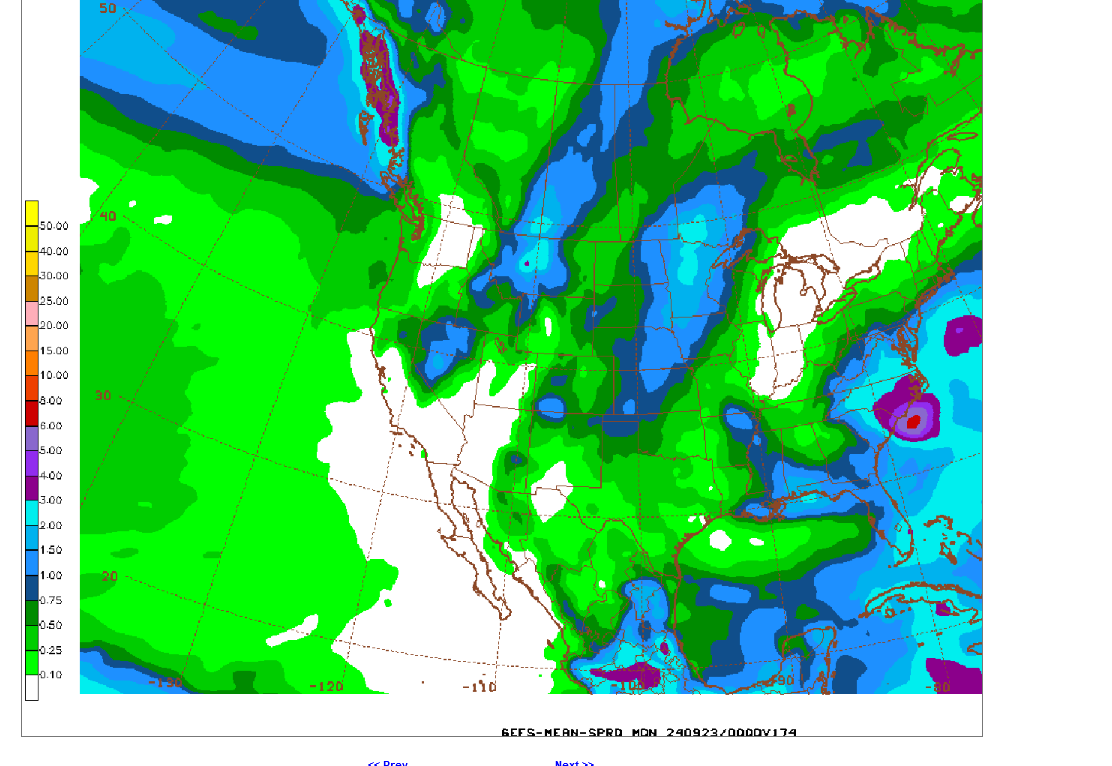
This was the forecast from the just out 18z GEFS, by far the most bullish yet for rains here!!!
500 mb heights Friday Noon
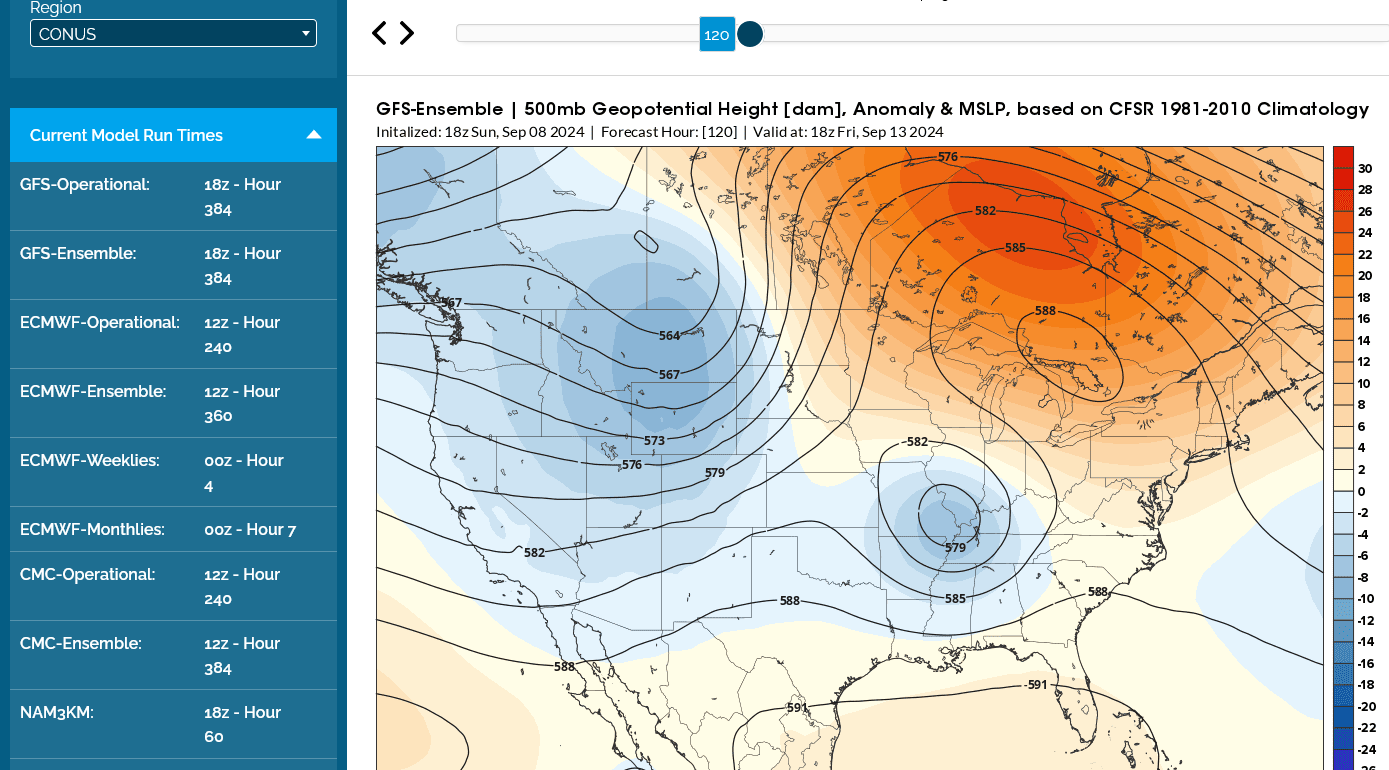
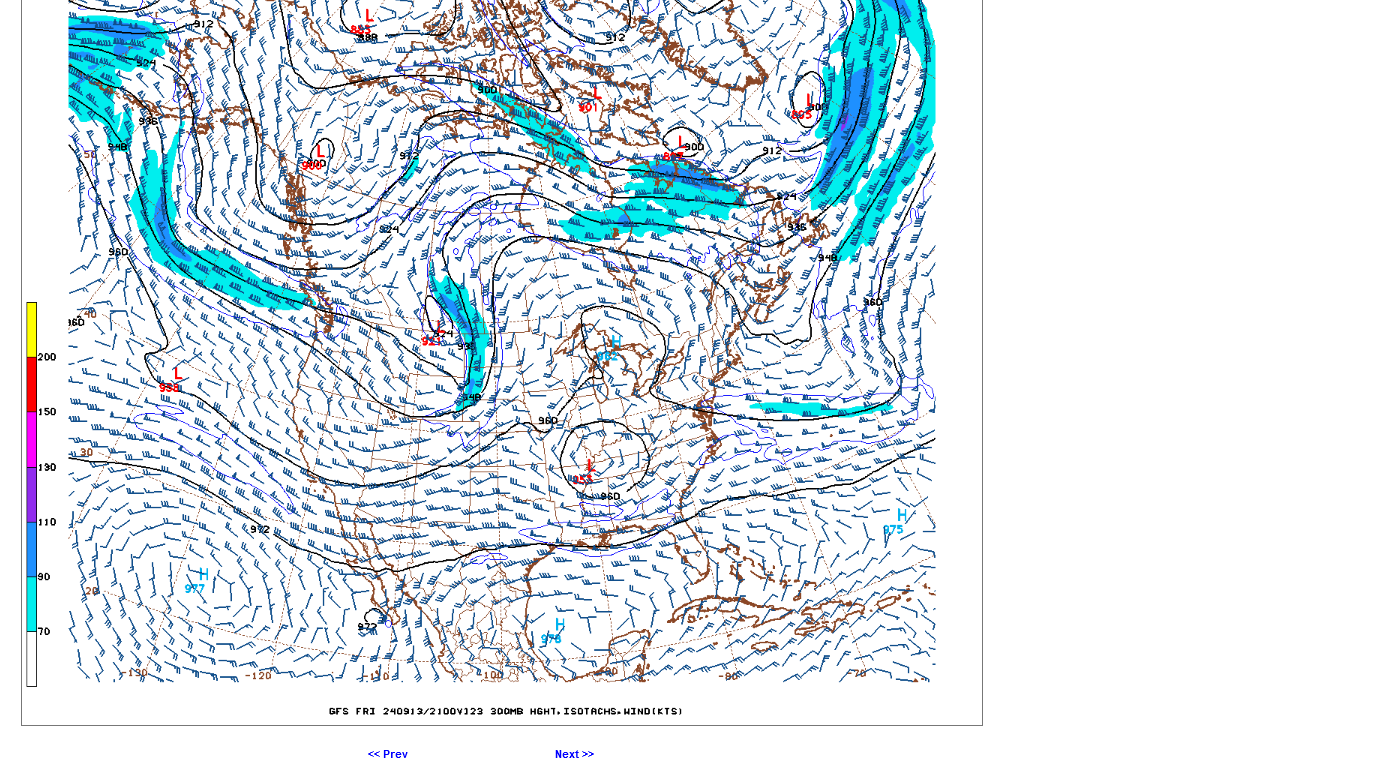
This is the 300mb jet stream level from the last 18z GFS run. The remnants of soon to be TS and maybe minimal Hurricane Francine may actually get trapped(or move extremely slow) for a short while close to the Ohio River, with the main jet stream farther northwest and an upper level high to the north.
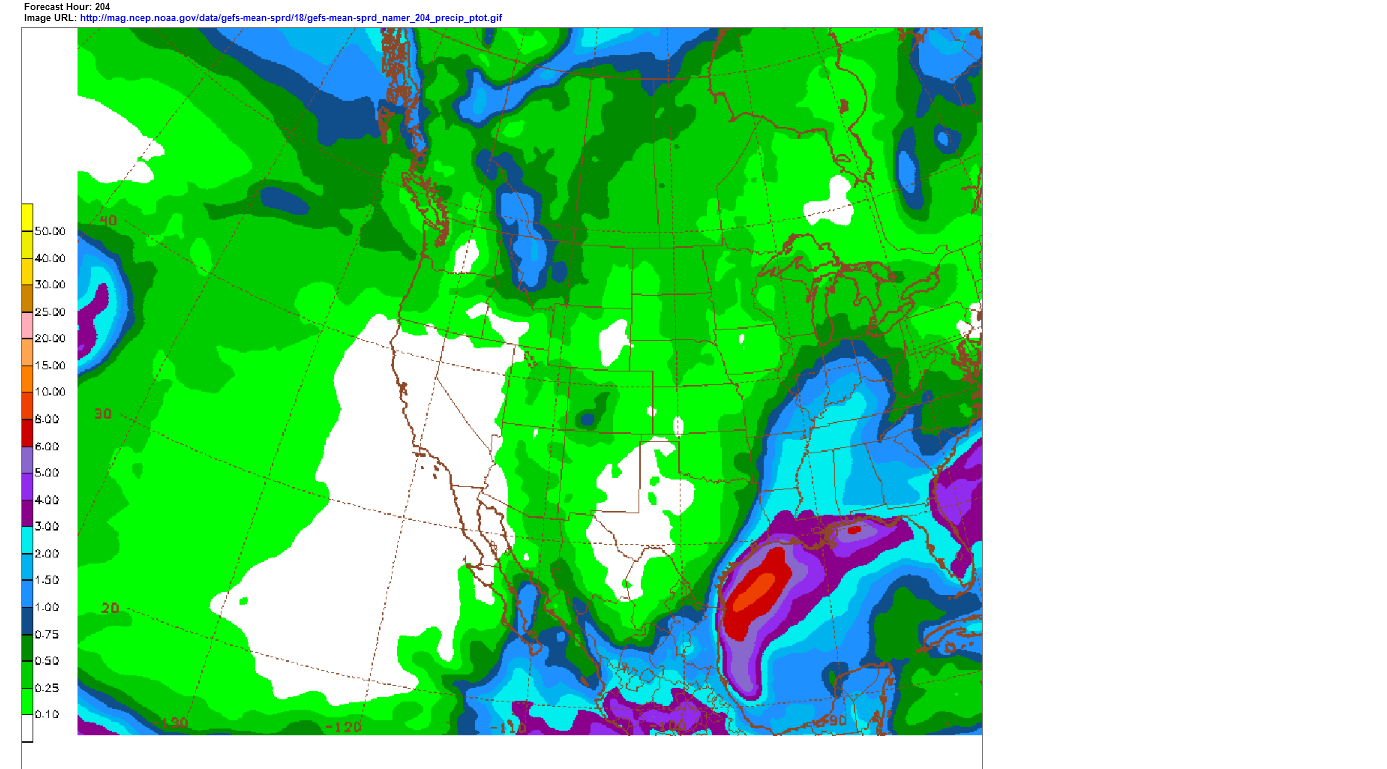
18z GEFS total rains the next 8 days below. Light blue = 2+ inches up to the Ohio River! Yippee!
https://www.marketforum.com/forum/topic/83844/#83848
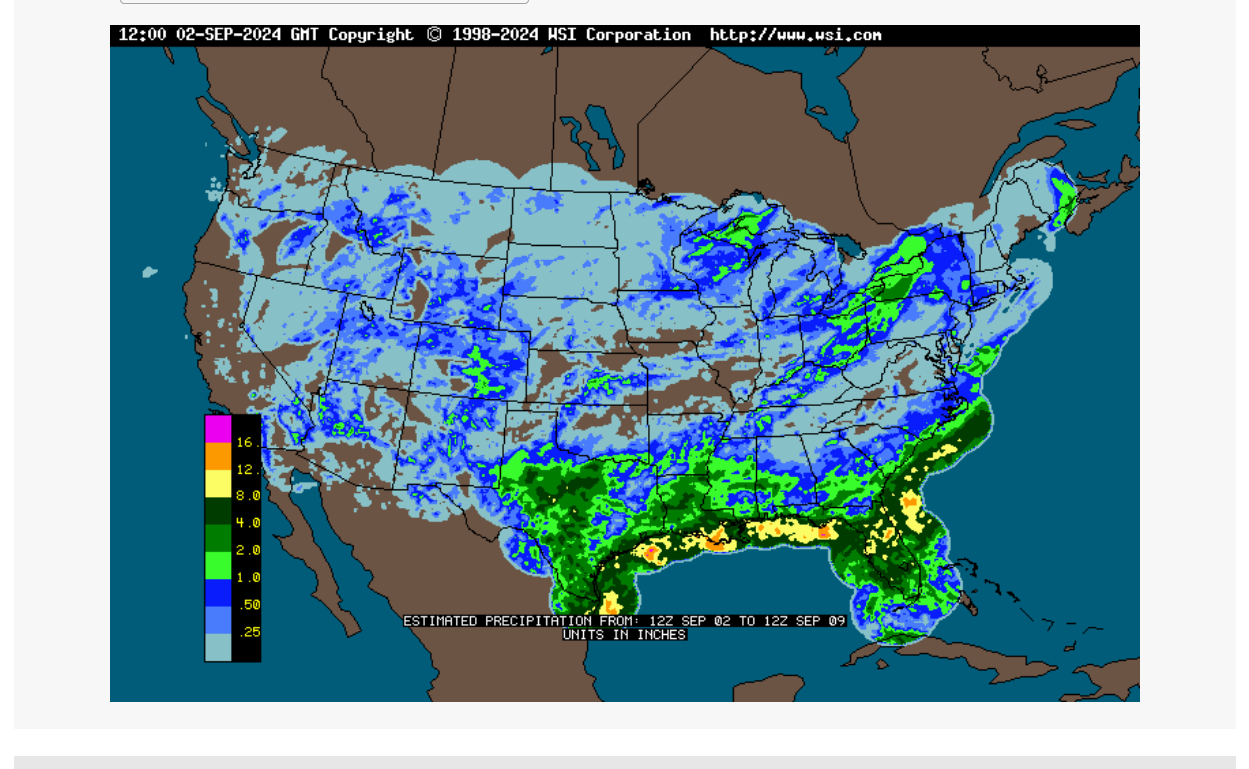
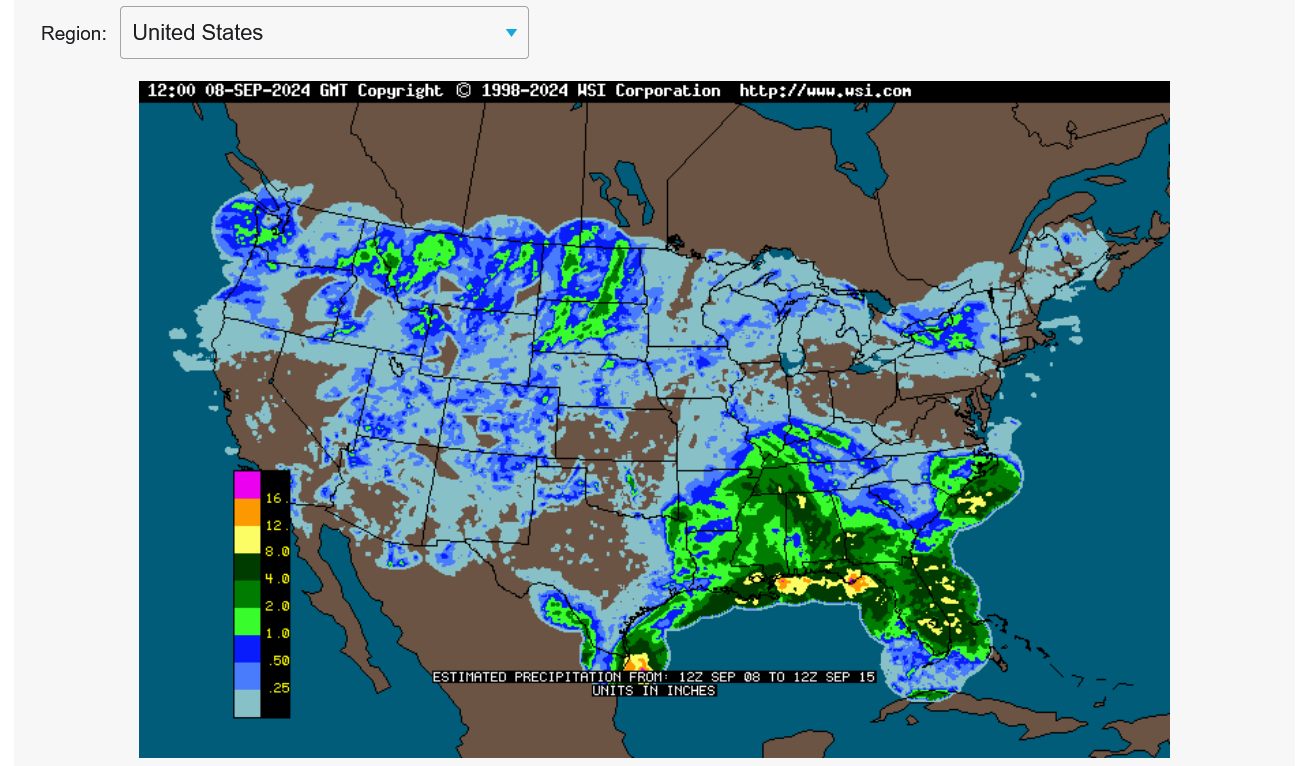
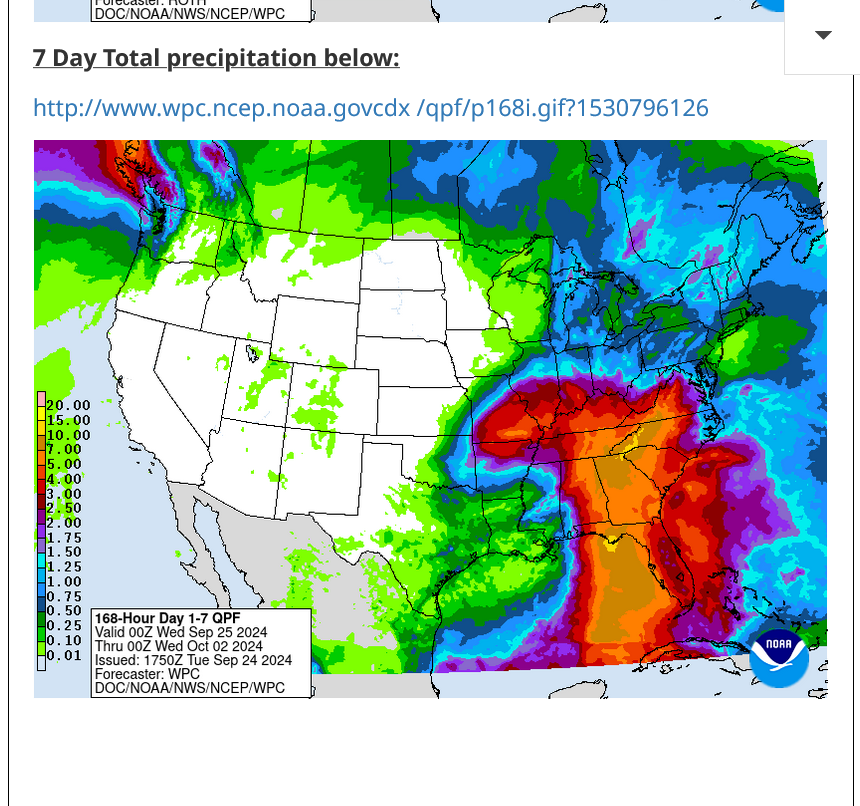
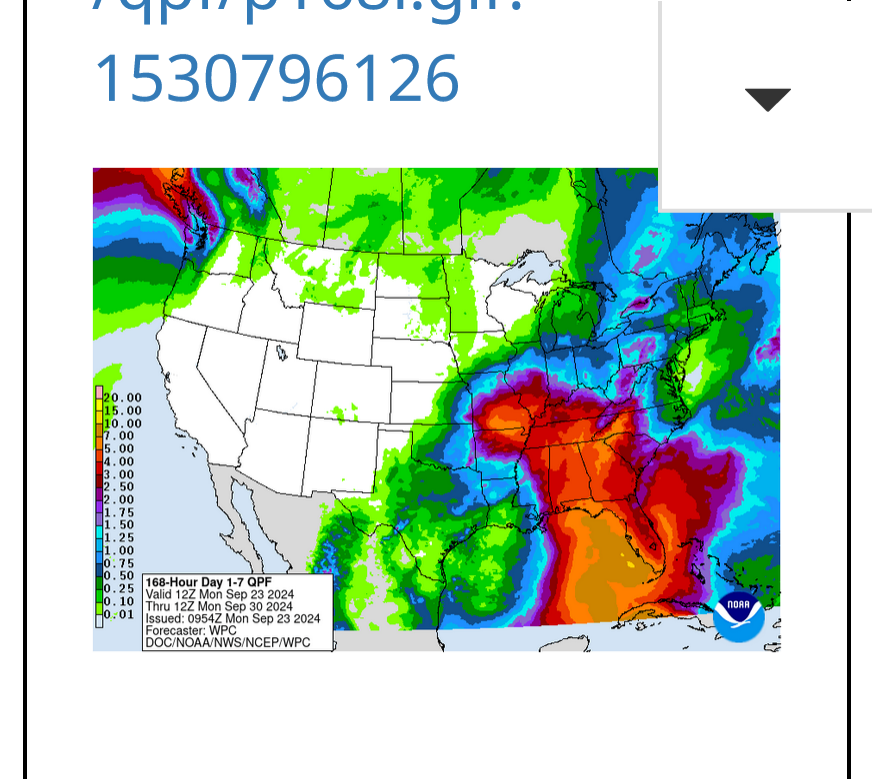
7 Day Total precipitation below: NWS
http://www.wpc.ncep.noaa.govcdx /qpf/p168i.gif?1530796126

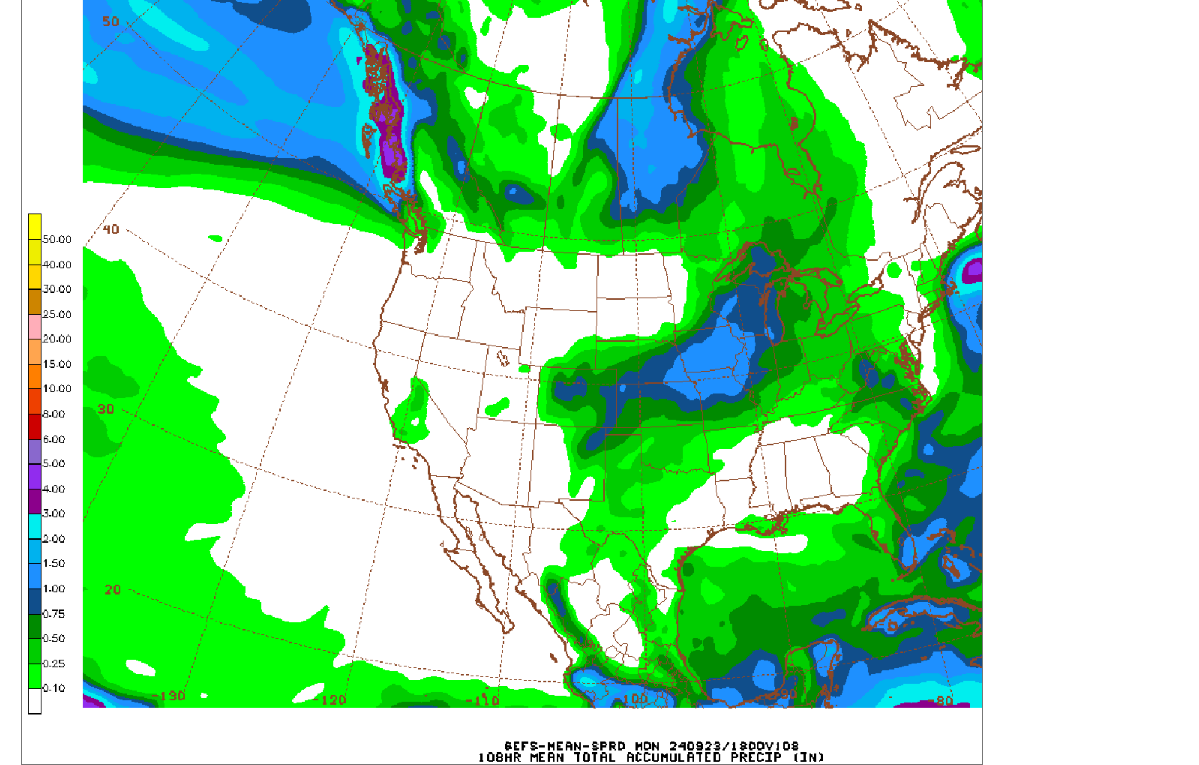
Just out 0z GEFS total 1 week rains!
That light blue is 2+ inches, up to Southwest IN! Almost all the areas in sw.OH, s.IN, KY, TN, AL, MS which get these rains will be celebrating for as much as 4 inches(more southern locations) because its been so dry!

E.TX and LA that get more than that and don't need rains will not be as excited. However, the risk for excessive rains is not that great.
Excessive rain threat.
https://www.wpc.ncep.noaa.gov/qpf/excess_rain.shtml
Current Day 1 Forecast
Day 1 Threat Area in Text Format
Current Day 2 Forecast |
Day 3 outlook

lot of info to "predict" rain but at this same time last week last Friday was "also Predicted" to be likely and north of 80%. So as the weather goes, we will see.
mcfarm,
I beg to differ with that assessment.
That last cold front had low chances for rain in IN and what rains were forecast, had a very small window to occur because the cold front swept thru quickly.
Below was the configuration of the rain shield which lined up extremely well with the weather model predictions.
You can see the northeast to southwest bands that lined up exactly with the lift ahead of the cold front.
First band hit farther northern IN with some light scat. rains late Thu. Then on Fri afternoon, after the front hit more moisture some heavier scat. rains fired up as the front was exiting IN, along and south of the Ohio River.
https://www.wunderground.com/maps/precipitation/weekly
This system will be TOTALLY DIFFERENT than that.
The rain chances will not be confined to a narrow time frame. The rains will not be light. The rains will not be scattered. The main question is about how far north they will go?
This was the last European model prediction. Like previous guidance, its been going farther north and adds more rain as a result with the system almost stalling. You were on the edge of the rain shield previously but are inside of it now but still this is no guarantee on how far north it will go.

This was the last 6z GEFS. I'm using a different FREE source with better colors but it doesn't have the European model which I get from TrueWeather(paid for). A wonderful source for weather but crappy rain colors above.

do not know about you but our locals at this time last week we exactly for 80% or better....yes as the week wore on things changed of course....they usually do...and as it turns out that 80 plus percent lessened to finally "widely scattered showers"
South America isn’t looking any better.
https://www.reuters.com/world/americas/south-americas-rivers-hit-record-lows-brazil-drought-impact-spreads-2024-09-09/
"do not know about you but our locals at this time last week we exactly for 80% or better...'
Actually, mcfarm I can get what your locals stated at this time last week right here.
The CHANCE symbol that they used below represents 30-50% chance of rain.
I was watching alot of forecasts in IN last week but didn't see all of them.
None that I saw ever went above 50%.
Maybe you should find a better weather source
| POP Percent | Contraction |
| 10 percent | Isol (isolated) |
| 20 percent | SChc (slight chance) |
| 30, 40, & 50 percent | Chc or Sct (chance or scattered) |
| 60 & 70 percent | Lkly (likely) |
| 80, 90, & 100 percent | Ocnl (occasional) |
by: Steven Diana
Posted: / Updated:
Thanks, Jim!
We should note, while viewing their graph below that the river almost always bottoms out to its lows of the year in this time frame because of the strong monsoonal climate pattern that dominates.
It's usually just a matter of time before the rains ramp up.

From you article below:

+++++++++
But look at the NORMAL rainfall for this area in green on the graph below. OF COURSE this river falls at this time of year! What happens in October and onward is what counts!
December sees 6 times more rain than September!!!
https://www.climatestotravel.com/climate/paraguay#temperature_rain

Southeast Paraguay gets some rain, as does eastern Argentina the next 2 weeks(Southern Brazil a lot of rain) but the key Summer monsoon rain pattern won't kick into Central Brazil thru that period. Which is not unusual.
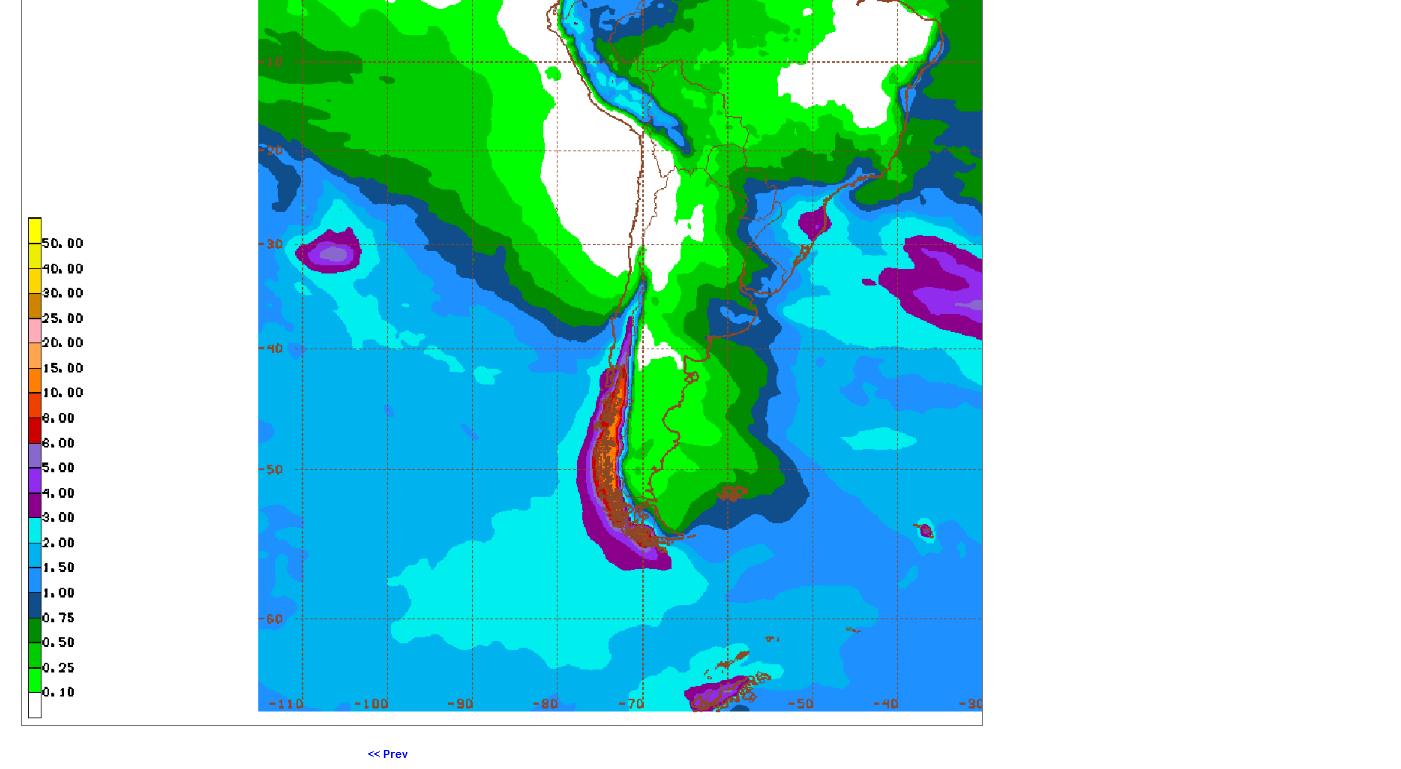
Note the uncolored areas of Central Brazil. This is because average rain is close to nothing and that's how much has fallen.
https://www.cpc.ncep.noaa.gov/products/Precip_Monitoring/Figures/global/n.90day.figb.gif

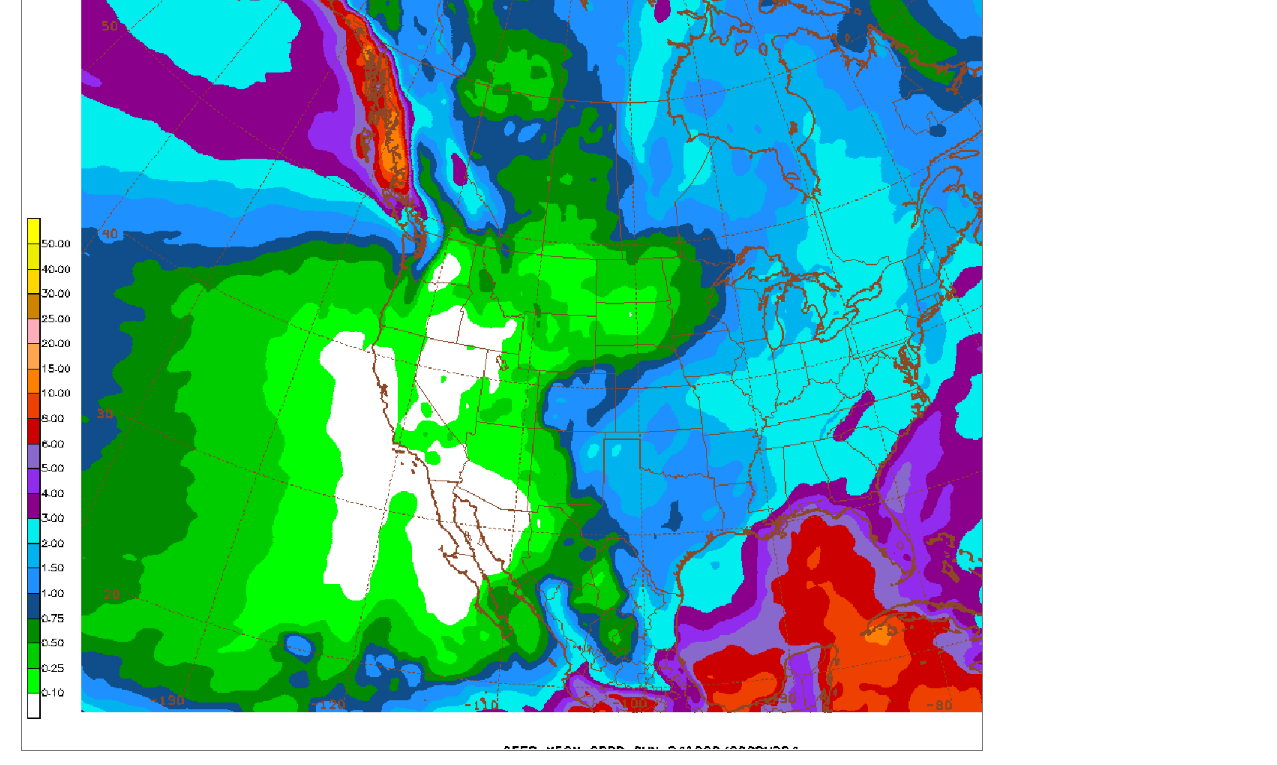
Just out 12z GEFS. Looking great, at least up to the Ohio River. Still promising a bit north of that, let's say Indy to Dayton, OH.

Same forecast. Just out 12z European model below.
You can see the remnants of Francine at 500 mb, first map. Even MORE confidence in it getting TRAPPED underneath the strong upper level high pressure system in the Northeast Great Lakes that blocks it from going northward. The main jet stream is farther west and can't pick it up or steer it.
99% of the time, with an upper level high in that position, it would keep us pretty dry this far north but the well developed and chock full of tropical moisture remnants of Francine will track in the southerly flow into IN. Hurray!

Surface Weather maps for days 3-7 below:
https://www.wpc.ncep.noaa.gov/medr/medr.shtml

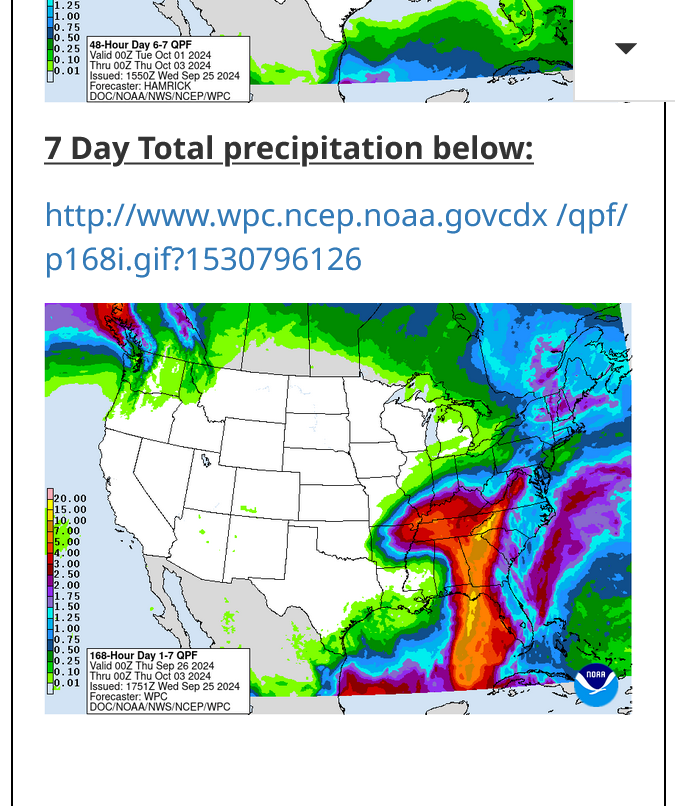
7 Day Total precipitation below: NWS
http://www.wpc.ncep.noaa.govcdx /qpf/p168i.gif?1530796126
Still looks great(barely) for the southwest corner of IN and southward. However, if the remnants of Francine stalled out farther south, the heavy rains would not make it as far north:
7 Day Total precipitation below:
http://www.wpc.ncep.noaa.govcdx /qpf/p168i.gif?1530796126
++++++++++
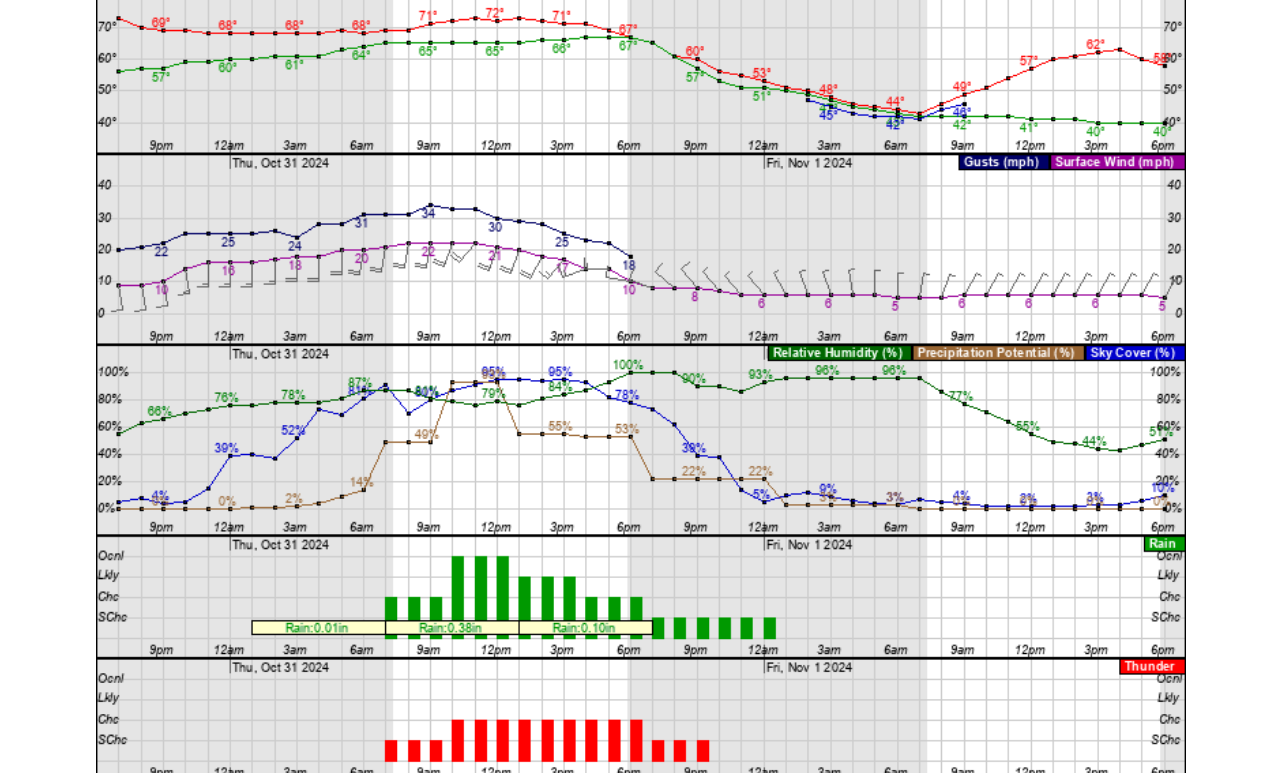
This was the last 48 hour computer generated numerical output for Evansville, starting at 10am Thursday. Rain chances start on Thu afternoon and become likely on Thursday night.
Total rains are approaching 2 inches with most of it falling from Thu pm to Friday PM.

You can get the rest of the NWS information for that site from the regional office in Paducah, KY here:
THIS IS OUR CURRENT TROPICAL STORM FRANCINE THREAD:
AEW in E ATL could be next TC
31 responses |
Started by WxFollower - Aug. 26, 2024, 2:27 p.m.
Francine IS going to stall out, with most of its support cut off, and much of the remaining moisture raining out quickly after it reaches its farthest north point.
I have a bit of a concern that the last model runs didn't take Francine as far north as the previous few runs.
This is not good news for Northern Indiana and bad news for the state of Ohio in severe drought but still very hopeful for us in Evansville, close to the KY border.
This was the last forecast from the NWS. They may shift things a bit farther south if the trend continues:
https://www.marketforum.com/forum/topic/83844/#83848
7 Day Total precipitation below: NWS
http://www.wpc.ncep.noaa.govcdx /qpf/p168i.gif?1530796126
Going to be close to see if the great rains get north of the Ohio River. Amounts have dropped a bit but the north to south rainfall gradient is going to be pretty steep.
Along the path of the rain corridor, a place with lots of rains around .5 could be 100 miles north of places that get 3 inches.
Just out 0z GEFS total rains thru Sunday below:

The latest guidance continues to pull back slightly on the northern extend of the Francine rains.
Evansville is right on the northern edge. Let's hope that there's no more shifts farther south!
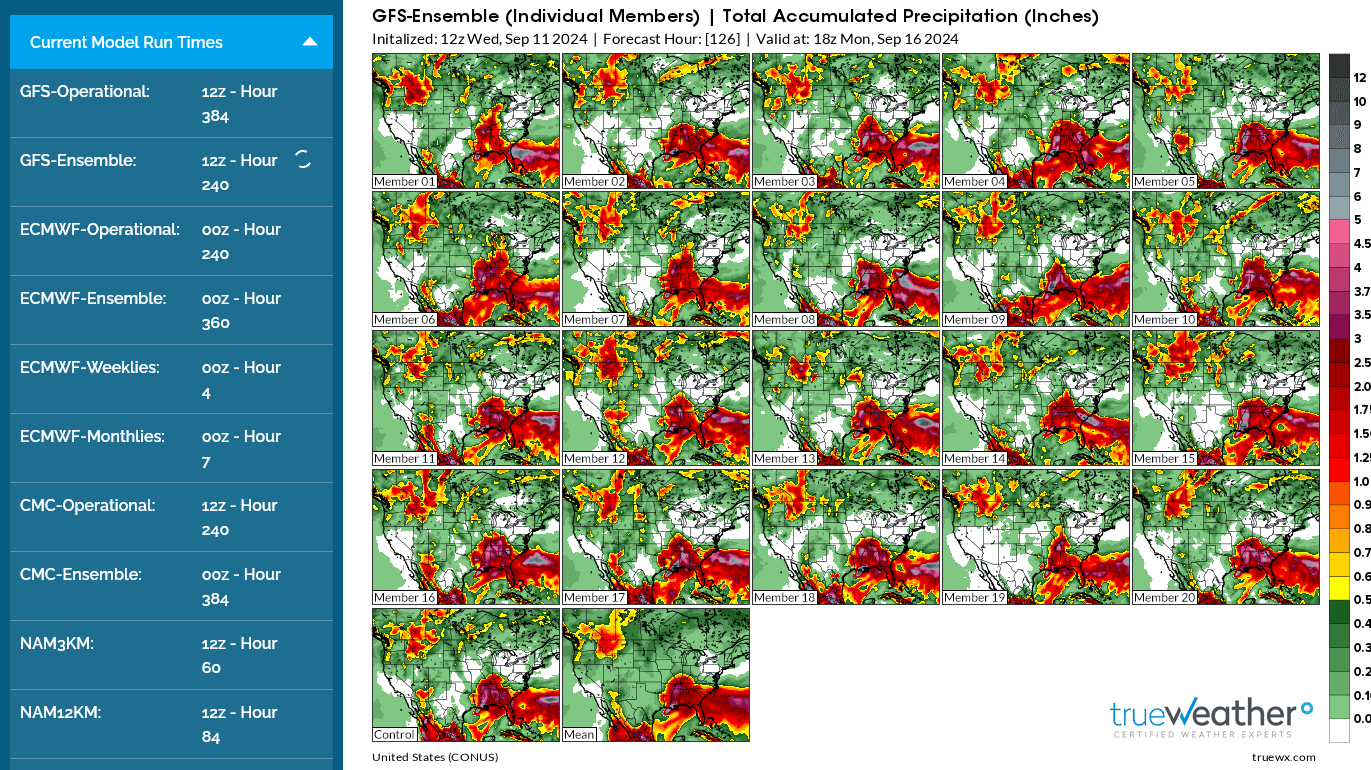
This is the just out 12z GEFS:

The GEFS model above is an average of dozens of different solutions of the GFS model, each with a tiny change in a key meteorological parameter which is part of defining the physics of the atmosphere but we can't model with all the perfect equations(calculus).
Its sort of like a person having a very challenging medical condition with uncertainty on how it will progress and using 30 different expert doctors opinions to predict that.........THEN AVERAGE THEIR DIAGNOSIS AND EXPECTATIONS TOGETHER INTO 1 PRODUCT........AN ENSEMBLE.
These were the individual ensemble members below for this last 12z GEFS. You can see the differences and the range between them.
There are a few that don't quite get much rain to Evansville. A few spread the moisture well into Indiana. Those solutions are POSSIBLE. The majority bring in at least an inch of rain to Evansville, which is the most likely outcome.

++++++++++++
Performance studies tell us that the ensemble AVERAGE does best in the long run. It's the most consistent and the most likely. But sometimes, an outlier solution can "see" something that the other solutions don't because that solution has equations that better pick up on the specific dynamics.
Each major model has its own ensemble with dozens of individual members that get averaged together.
Good meteorologists mainly go with the ensemble average but also look at individual members to see the spread/differences to see what is possible and to see what the make up of the average is.
For instance, there would be a huge difference in 2 different ensembles that, let's say both came up with an average value of 1 inch of rain with the following individual members.
1. Ensemble average 1.00" of rain with 90% of the solutions having a value of .8" to 1.2". This give solid confidence that the rains should be close to 1 inch.
2. Same system with an ensemble average of 1.00" of rain but 40% of the members are LESS THAN .5" and 40% are MORE THAN 1.5" and ONLY 20% CLOSE TO THE AVERAGE OF 1 INCH. In this case, the average of 1 inch is LESS LIKELY than the 2 extremes that are much more and much less but average out to something in the middle.
These were the just out 12z Canadian model ensemble members.
The spread is MUCH wider than the GEFS spread.
20% have Evansville missing most of the rain but OVER 50% have the moisture and rains pushing to Chicago and even farther north. This makes the much farther north solution MORE LIKELY than the average (below it) in this case FOR THIS MODEL.

This was the average for all the individual ensembles above.

Each model also has slightly different equations than all the other models, so this is like having an entirely different team of doctors projecting the outcome for the same patients condition.
I note that many meteorologists today, fail to look at all the models and all the ensembles because its incredibly time consuming and it just creates more work. Personally, I think the analysis is fun!
So this is what they do. I especially notice this with most NWS forecasts.
They just take the computer generated numerical guidance from the GEFS model which gives an easy to define/understand, hour by hour prediction for everything to be predicted in a forecast.
In the majority of cases, this product does a pretty good job..........but somebody using it is LIMITING THEMSELVES to not seeing EVERYTHING.
It often misses pattern recognition elements that a seasoned meteorologist can dial in to adjust model bias for certain situations.
This is the current Evansville Forecast:
https://forecast.weather.gov/MapClick.php?x=282&y=86&site=pah&zmx=&zmy=&map_x=283&map_y=86
Sunday
A slight chance of showers, then a chance of showers and thunderstorms after 1pm. Partly sunny, with a high near 80. East southeast wind 5 to 8 mph.
+++++++++++++++
Why did they add thundershowers at EXACTLY 1pm for a forecast 4 days from now that can't possibly pinpoint something like to an exact time??? There it is on the graph below with the small red bars at the bottom right that pop up at 1pm Sunday. So this forecast gives a false impression that the forecaster is able to predict the weather, hour by hour for days..............because they use the computer generated forecast below that goes hour by hour and WILL BE WRONG for the exact time more than right for that exact time.
Within 5 hours of that time frame, for 4 days out, mostly right but not the exact hour. NO WAY!
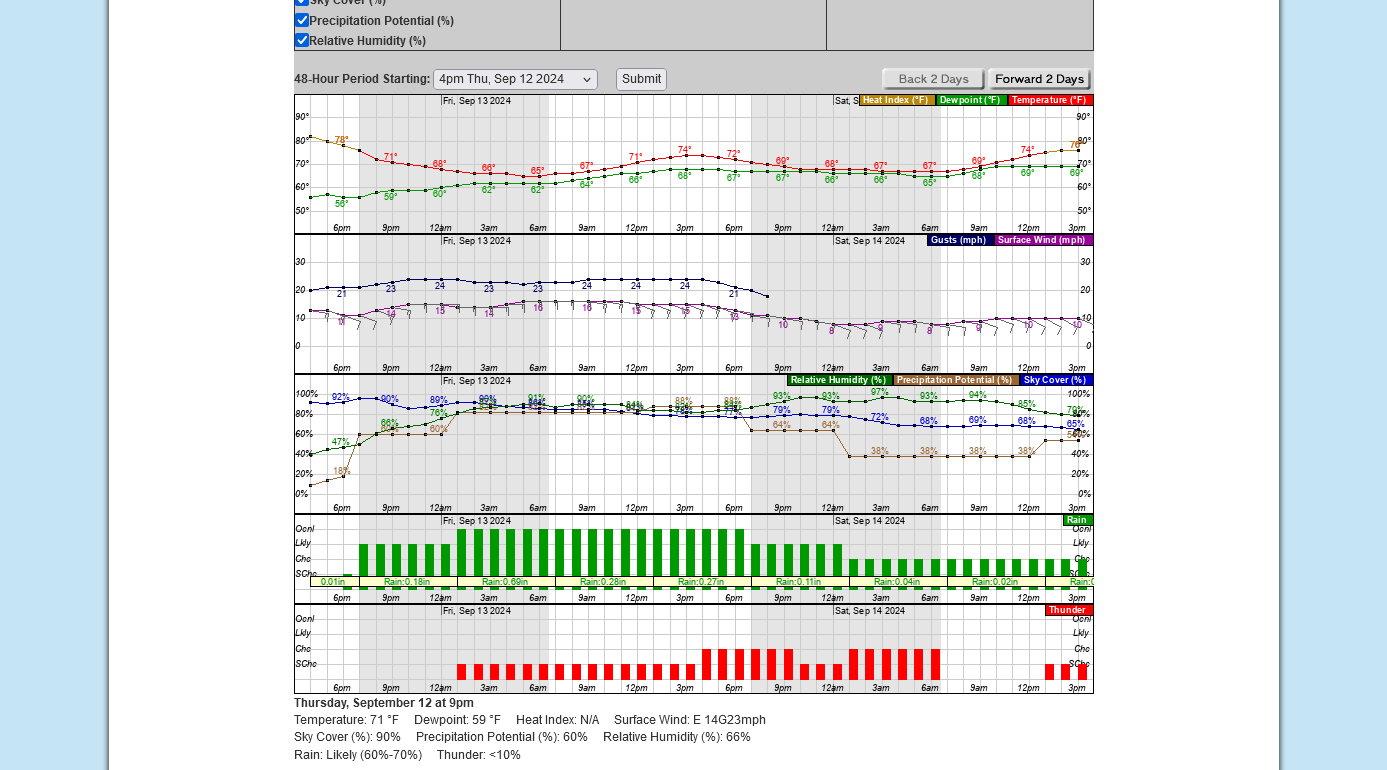 BTW, the computer generated total rains predicted have DROPPED slightly the last 2 days but still at 1.5"+ for the event which would be mega awesome and at least make a dent in the severe flash drought.
The biggest change on the just out 12z European model(which is the best model) is to shift the(diminishing amounts) rain north thru the entire state of IL to WI. The majority of solutions now show this.
If you remember. Earlier, this was what more than 50% of the Canadian model ensembles did.
So instead of the storm stalling to the south, the blocking HIGH to the north is progged to move to the East Coast and the backside circulation will help steer it to the north.
Latest models don't take as much moisture, northward across the state of IL but we now getting in to the real of NOW casting.
Instead of using forecast models, we use observations of what is actually happening to predict where things are headed!!!
The radar site at Paducah is picking up the northward moving rain bands.
The latest numerical model guidance has Evansville only getting a bit over an inch which is the least amount so far this week.
Rains should start late this evening. There is a chance that they could dry up as the northern periphery hits bone dry air and the upper level, blocking high to the north suppresses northward movement.
There is a chance for the rains to be disappointing, which I would define as anything under 1 inch.
Weather.gov > Paducah, KY
This link below provides some great data. After going to the link, hit "Mesoanalysis" then, the center of any box for the area that you want, then go to observation on the far left, then surface observations to get constantly updated surface observations or hit another of the dozens of choices.
 |
Based on recent trends, I'm going to have to adjust rain amounts down even more.
They started at close to 2 inches early this week and have slowly been dropping since then.........down to just over an inch overnight. Recent trends have me adjusting down below 1 inch of general rains.
There will be a lingering/stalled weakness/moisture in the atmosphere into early next week that will support scattered daily showers and some luckier places could still get over 2 inches.
The NWS, however is still pretty optimistic for more rains than that.
https://www.marketforum.com/forum/topic/83844/#83848
7 Day Total precipitation below:
http://www.wpc.ncep.noaa.govcdx /qpf/p168i.gif?1530796126
+++++++++++++
Evansville Radar picking up on the rains to our south:
https://forecast.weather.gov/MapClick.php?x=286&y=82&site=pah&zmx=&zmy=&map_x=286&map_y=81
https://radar.weather.gov/station/kvwx/standard
At least this just out 18z GEFS run has gone back to slightly increasing the rains again vs the prior model 6 hours earlier(and stops the trend of less and less rain). The steep rainfall forecast gradient means a tiny shift/deviation in either direction will mean a huge difference for amounts.

https://www.timeout.com/music/the-25-best-songs-about-rain
++++++++++++
Great songs. They missed some really good ones:
https://www.youtube.com/watch?v=g4flAZEgtjs
+++++++++++++
With our 2 year old grandson, Cyrus in mind:
https://themusicclass.com/blog/10-best-child-friendly-rain-songs-raina
These Francine rains are hitting some extremely dry spots!
We got .7" overnight. Compared to expectations earlier in the week, it's disappointing but all things considered, this was a WONDERFUL, MEANINGFUL rain event.
It could have been worse, considering the surprise fashion in which the rain even unfolded.
There were heavier, 1+ inch rains northeast of us but farther south, a huge corridor of LESS rains. Nashville, TN only got .11!
They were supposed to get over 2 inches on EVERY forecast. This was a shockaroo and my 100,000th lesson on why to never assume anything in a weather forecast like this one
We have some moisture and unstable air around for a couple of days still. Lucky places could get MORE beneficial and extremely welcome rains from scattered, hard to predict cells.
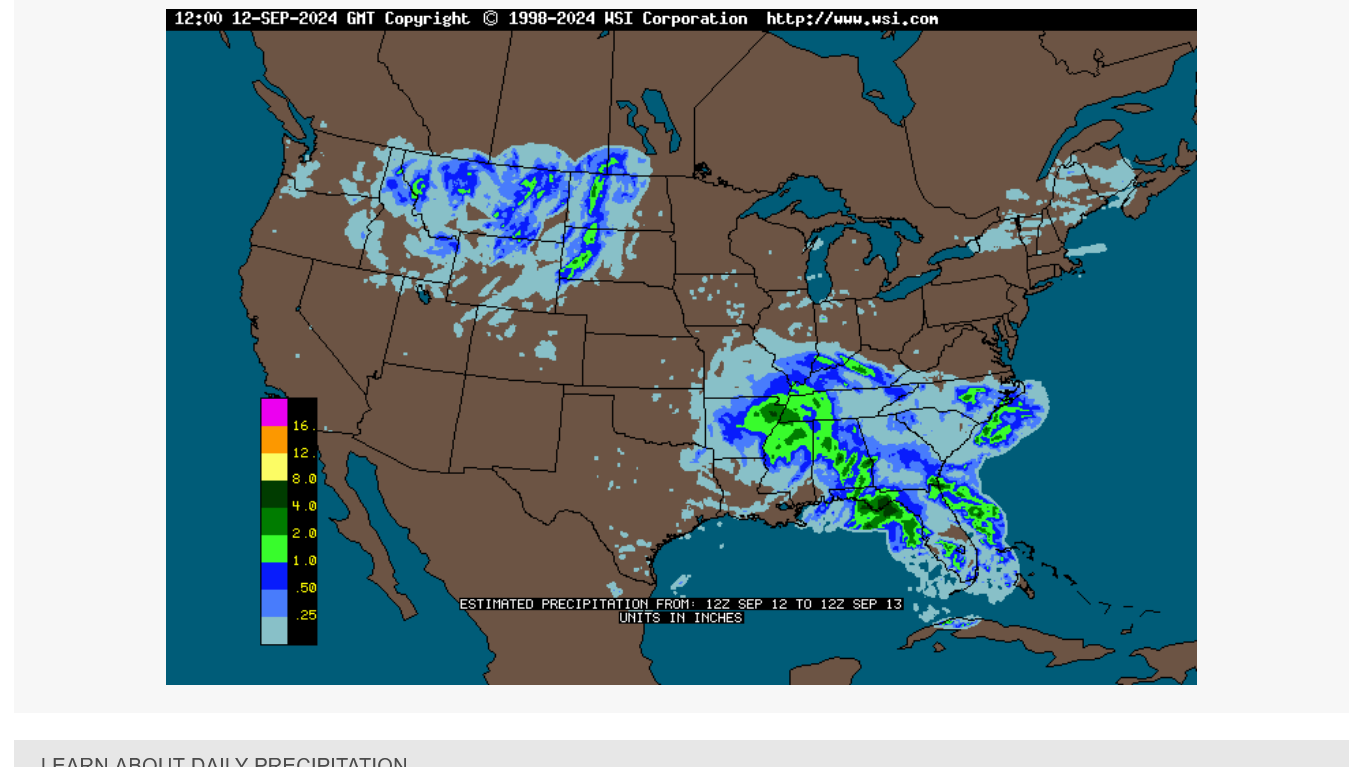
9-13-24: Past 24 hour rains:
https://www.wunderground.com/maps/precipitation/weekly
Rains this weekend look to stay southwest of us. Small chance for a shower late on Saturday.........then another extended period of dry weather that, by late September could feature the drought being even worse than it was before this wonderful rain of .7 blessed us!
Evansville Radar picking up on the rains to our south:
https://forecast.weather.gov/MapClick.php?x=286&y=82&site=pah&zmx=&zmy=&map_x=286&map_y=81
https://radar.weather.gov/station/kvwx/standard
Rain forecast for the next 10 days from the just out 6z GEFS. Not promising for our area.

One good thing is that the suns angle is getting lower in the sky and less powerful, along with less intense heat so that we won't dry out nearly as fast as the same situation, when it's June-July-August.
We got .7 inches total from Francine!
Much less than hoped for early in the week but close to the amount expected just before it hit.
Most of the rain along and south of the Ohio River was from Francine. Evansville in in dark blue, with 1+ inches in light green and 2+ inches i darker green.
.7" is much better than nothing!
https://www.wunderground.com/maps/precipitation/weekly
Total precip for the next week/7 days from the last 18z GEFS run.
ZERO rain in the forecast for the entire state of Indiana
Maybe the pattern will become more favorable for rain towards the end of the month???
Slight chance of rain, starting on Sunday but rain chances staying mostly north and west of Evansville the next 4 days.
After that, rain chances improve greatly next week:
Next 4 days from the just out 6z GEFS model.
Rain chances have improved a bit the last 24 hours. With this current system and also in the next 2 weeks.
Go here to see the breakdown for the next 7 days. Best chance early next week with best rains, still well northwest of Evansville.
https://www.marketforum.com/forum/topic/83844/#83848
Longer term, thru 2 weeks from the 6z GEFS: 2+ inches would be nice!
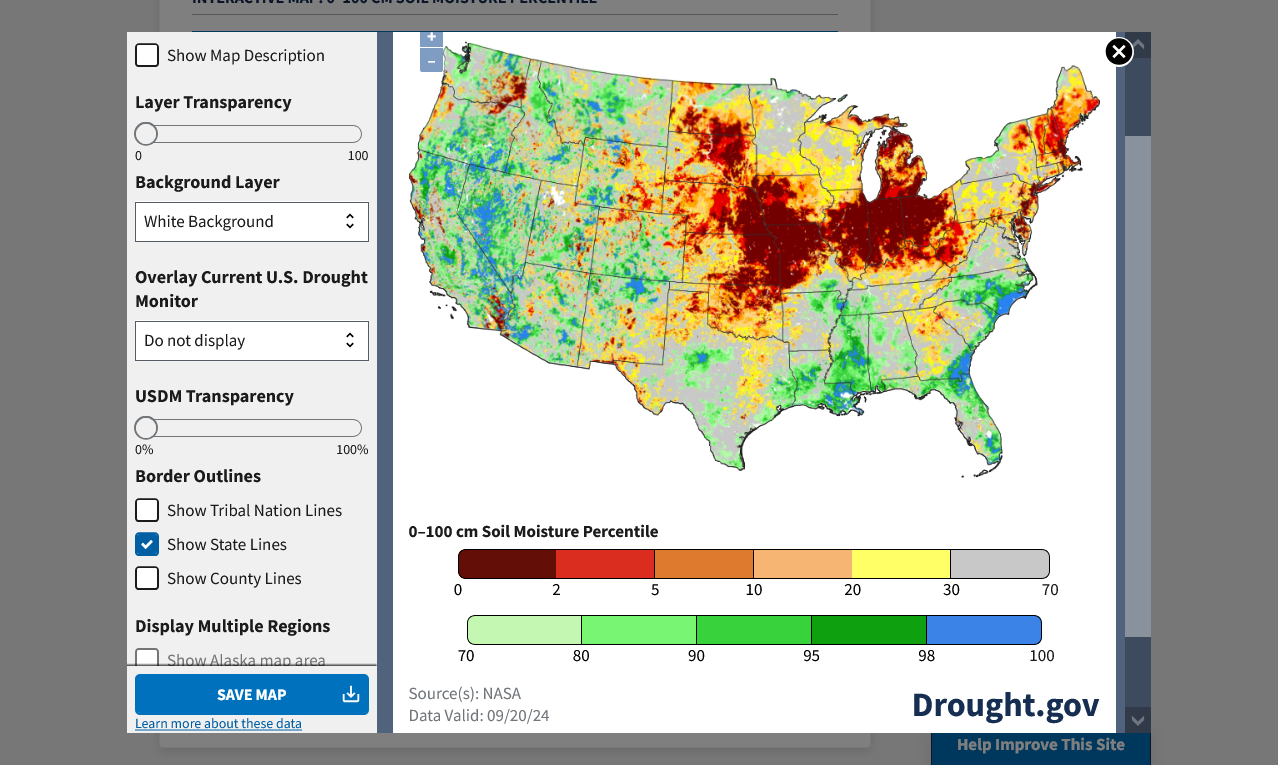
New product that shows how depleted our soil moisture is.
100 cm = 39 inches =just over 3 feet down. Evansville is in the darkest shade of red.
Basically, close to the lowest soil moisture ever in the top 3 feet. We can see how Francine greatly helped areas just barely south of us a week ago.
https://www.drought.gov/data-maps-tools/nasa-sport-lis-soil-moisture-products
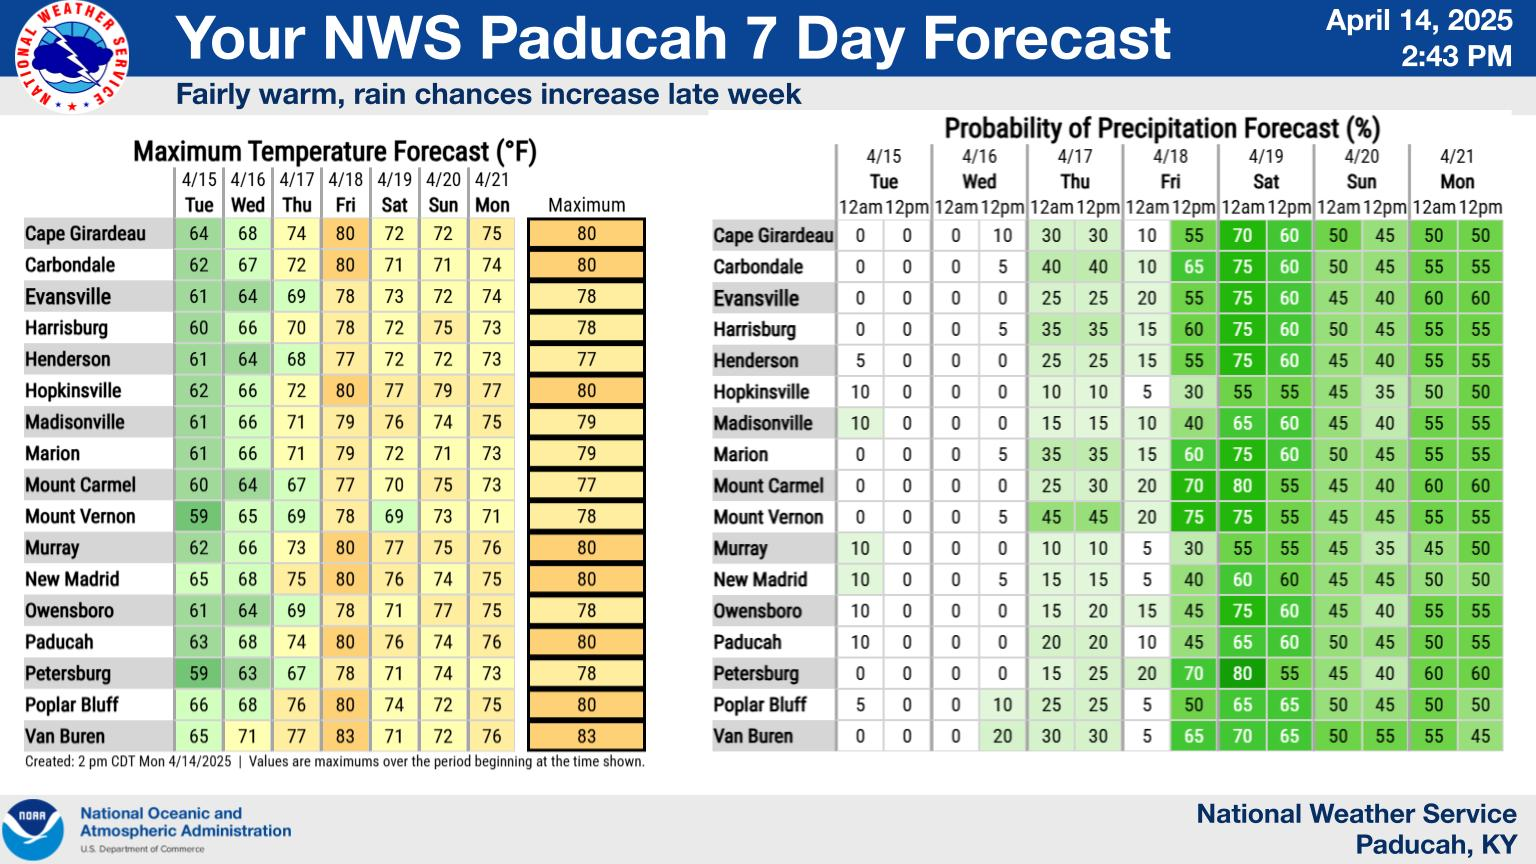
Latest NWS forecasts.
https://www.marketforum.com/forum/topic/83844/#83848
7 Day Total precipitation below:
http://www.wpc.ncep.noaa.govcdx /qpf/p168i.gif?1530796126
+++++++++++++
The last 6z GEFS model(European model does not agree) shifts the best rains, south a bit with this system to the Ohio River with additional rain chances in week 2. If it's correct(a big ?) that would be wonderful.
Next 5 days
Next 2 weeks
Yippeee!
Here it comes with near 100% certainty our biggest rain in almost 2 months(when you add up the totals this week)!
With the likelihood of more late this week and enough to make a huge dent in the drought.........possibly wipe it out!
Use link for update to the still frame below, suggesting the potential of 3" of rain here the next week.
Last 6z GEFS model for 2 weeks below:
7 Day Total precipitation below:
http://www.wpc.ncep.noaa.govcdx /qpf/p168i.gif?1530796126
Latest local radar
++++++++++++++++
We got .4 inches of steady rain soaking in. Not making much of a dent in the drought(yet) but for sure, stopping the increasing adversity/harm to vegetation and starting to reverse it.
MUCH more on the way the next week. In fact, one of the wettest September weeks in Evansville history(compared to what is normally the driest time of year).
Even though its been a pretty quiet hurricane season in the Atlantic Basin, this could be the remnants of the 3rd hurricane to impact Evansville this year. That must be a record!
1. Beryl in early July
2. Francine earlier this month-northeast edge of rains
3. Helene late this week- another 1-2+ inches?
https://www.marketforum.com/forum/topic/107518/
You wouldn't think that we would have a flash drought in August/September too!
For a chronological guide, see Timeline of the 2024 Atlantic hurricane season.

Latest 7 day rains. Enough to erase much of the drought!!!!!
The top image is intentionally a snap shot on Tuesday afternoon.
Below that is the constantly updated image.
7 Day Total precipitation below:
http://www.wpc.ncep.noaa.govcdx /qpf/p168i.gif?1530796126
Rain amounts have shifted a bit farther south on the latest models, which have cut back slightly on how much rain is expected in Evansville. The gradient on the northern periphery of the rain shield is extremely steep.
However, if Helene stays farther south=much less much rain. Farther north=MUCH MORE RAIN.
Wednesday afternoon forecast for the next week:
Updated versions:
https://www.marketforum.com/forum/topic/83844/#83848
7 Day Total precipitation below:
http://www.wpc.ncep.noaa.govcdx /qpf/p168i.gif?1530796126
Near 100% chance now for Evansville to get heavy rains. Heaviest intensity will likely start early Friday and last all day, then overnight Friday.
A few forecasts, with the remnants of Helene have Evansville getting a potential of 5+ inches total the next 3 days.
https://www.marketforum.com/forum/topic/83844/#83848
Wind gusts on Friday will likely be over 40 mph from the circulation around Helene's remnants. The remnants will stall out close to us over the weekend with the circulation/winds and rain intensity dropping.
Local information. National radars.
Steady rain the next 24 hours! Maybe 5 inches. The drought is over!
| |
Snapshot of the remnants of Helene just after 10am on Saturday:
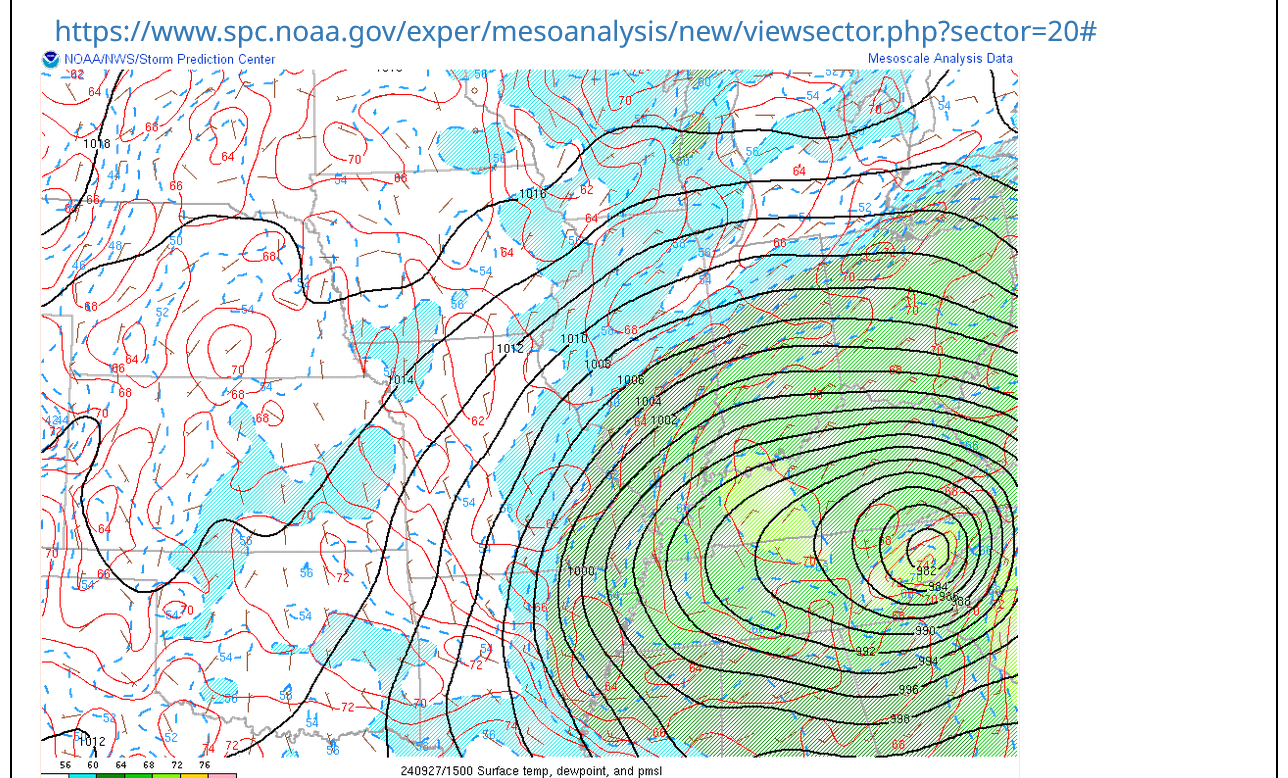
You can get the most updated versions by going here:
https://www.marketforum.com/forum/topic/83844/#83845
++++++++++++

https://www.marketforum.com/forum/topic/83844/
Ding, Dong the drought is dead, which old drought? The Wicked Drought! Ding dong the Wick Drought is Dead!!!!
Going over the 3 inch mark here of a steady, soaking rain here in Evansville!
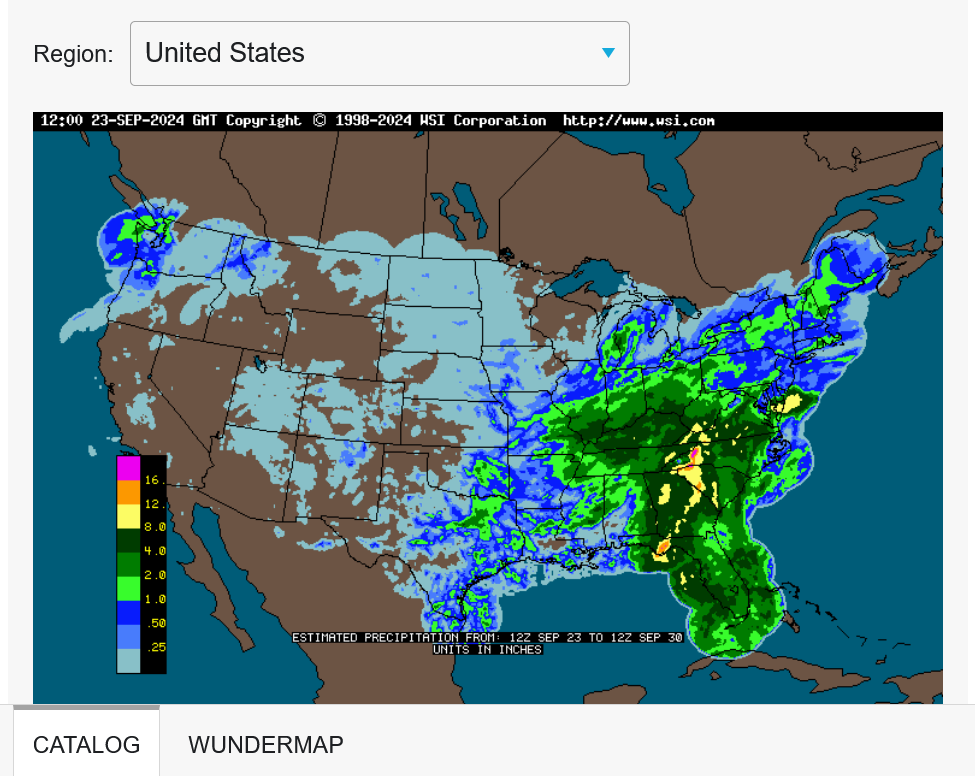
https://www.wunderground.com/maps/precipitation/weekly
9-30-24 Rains the past 7 days. Remnants of Helene dominate!
Dark greens below, along and just south of the Ohio River were 4+ inches of rain.
I got 3.5 inches, just north of the city of Evansville, IN! It came in a way that minimized runoff and maximized soaking into the soil.
This was an entire months worth of rain for September which is climatologically in the top 2 driest months, in the growing season, along with August.
https://weatherspark.com/y/13977/Average-Weather-in-Evansville-Indiana-United-States-Year-Round
%20-%20Weather%20Spark.png)
%20-%20Weather%20Spark.png)
Good thing because October is looking very dry!
Thank God we got the 3+ inches of rain from Helene's remnants because it hasn't rained a drop in October.
Without that huge soaker we would be losing some plants/trees from almost no rain for close over 2.5 months. Our outdoor water bill the past 2 months has been close to $500(I also reseeded numerous areas that had to stay wet).
There is rain in the forecast for the first time in October! Get the constant updates here:
Weather-UPDATED LINKS
68 responses |
Started by metmike - April 30, 2022, 8:01 p.m.
https://www.marketforum.com/forum/topic/83844/
Your post pretty much ignores MOST of us other than Indiana who got nothing, ziltch, natta from Heleena.
Iowa, Ill, Mn, eyc bone dry
How much/little is coming?
Long or short??
Thanks tjc,
Just so you'll know, all the other threads are for the rest of you and this country.
Like this one:
All the comprehensive weather, constantly updated:
https://www.marketforum.com/forum/topic/83844/
And this one:
By metmike - Oct. 23, 2024, 9:45 a.m.
However, I'm chess coach at 5 schools in Evansville Indiana with 300 students. With parent and teacher emails of 600+.
I'm also on the board of directors for the Scholastic Chess of Indiana and will pass on these emails to other board members that focus much more on Indiana.
I do threads like this just for them and our weather here in Evansville Indiana. I've done dozens just like this in the past for severe weather and Winter weather.
I didn't start this current one exactly that way but it morphed into it, when I passed it on to my chess group.
Here's some previous ones with that mentality in mind:
Severe weather #2 May 7-8, 2024
18 responses |
Started by metmike - May 7, 2024, 8:58 p.m.
https://www.marketforum.com/forum/topic/103838/
Severe wx week of 4-14-24
20 responses |
Started by metmike - April 13, 2024, 1:26 p.m.
https://www.marketforum.com/forum/topic/103145/
Severe threat 2-27/28-2024
9 responses |
Started by metmike - Feb. 27, 2024, 2:55 p.m.
https://www.marketforum.com/forum/topic/102510/
Winter Storms/COLD weeks of 1-7/ 1-14-24
39 responses |
Started by metmike - Jan. 7, 2024, 9:57 p.m.
https://www.marketforum.com/forum/topic/101628/
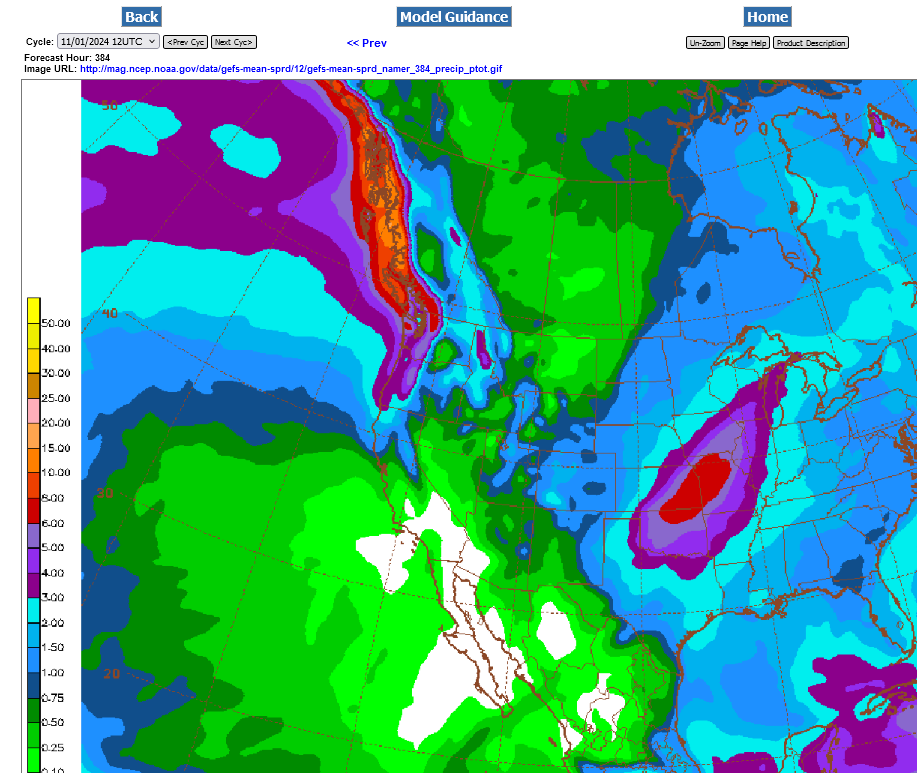
Total rains from the just out 18z GEFS for the next 2 weeks.
This is great and will make a small dent in the Midwest drought but the wetter pattern looks transient and after these rains, we go back to dry-ish in mid November.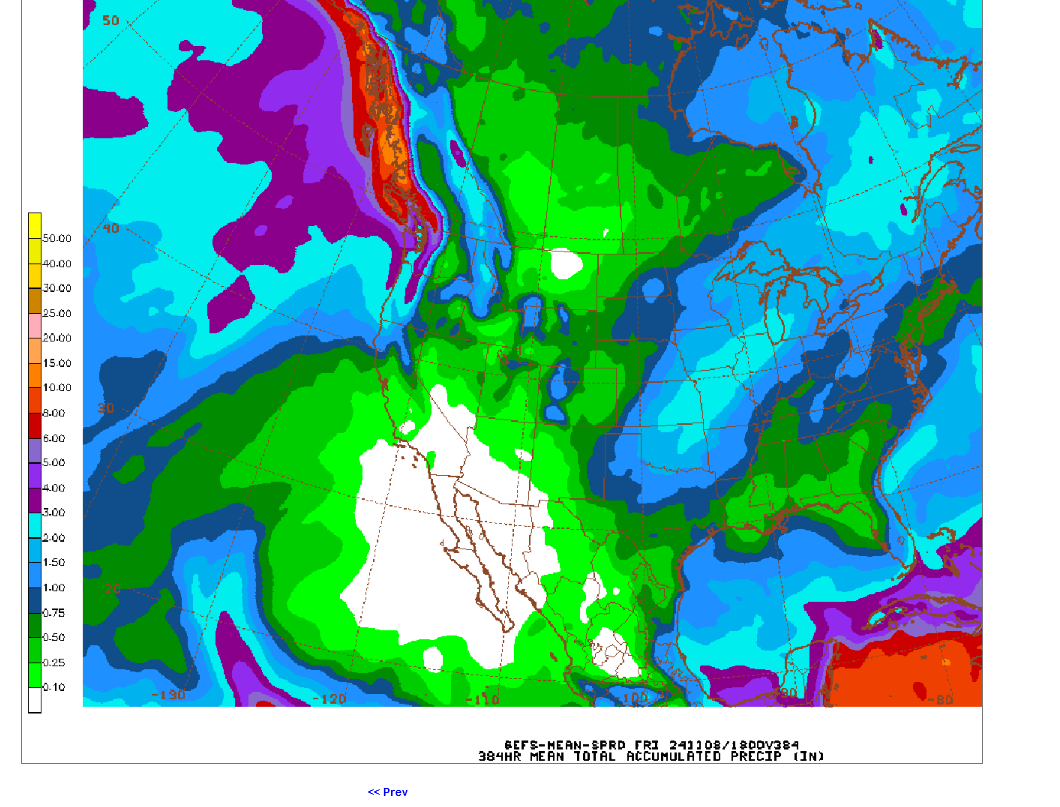
Rain amounts have gone way up the last several days. Yippeee! 2 week rains on the last GEFS run below:
However, after a couple of nice rain events, we go back to dry in mid November
For Evansville, IN:
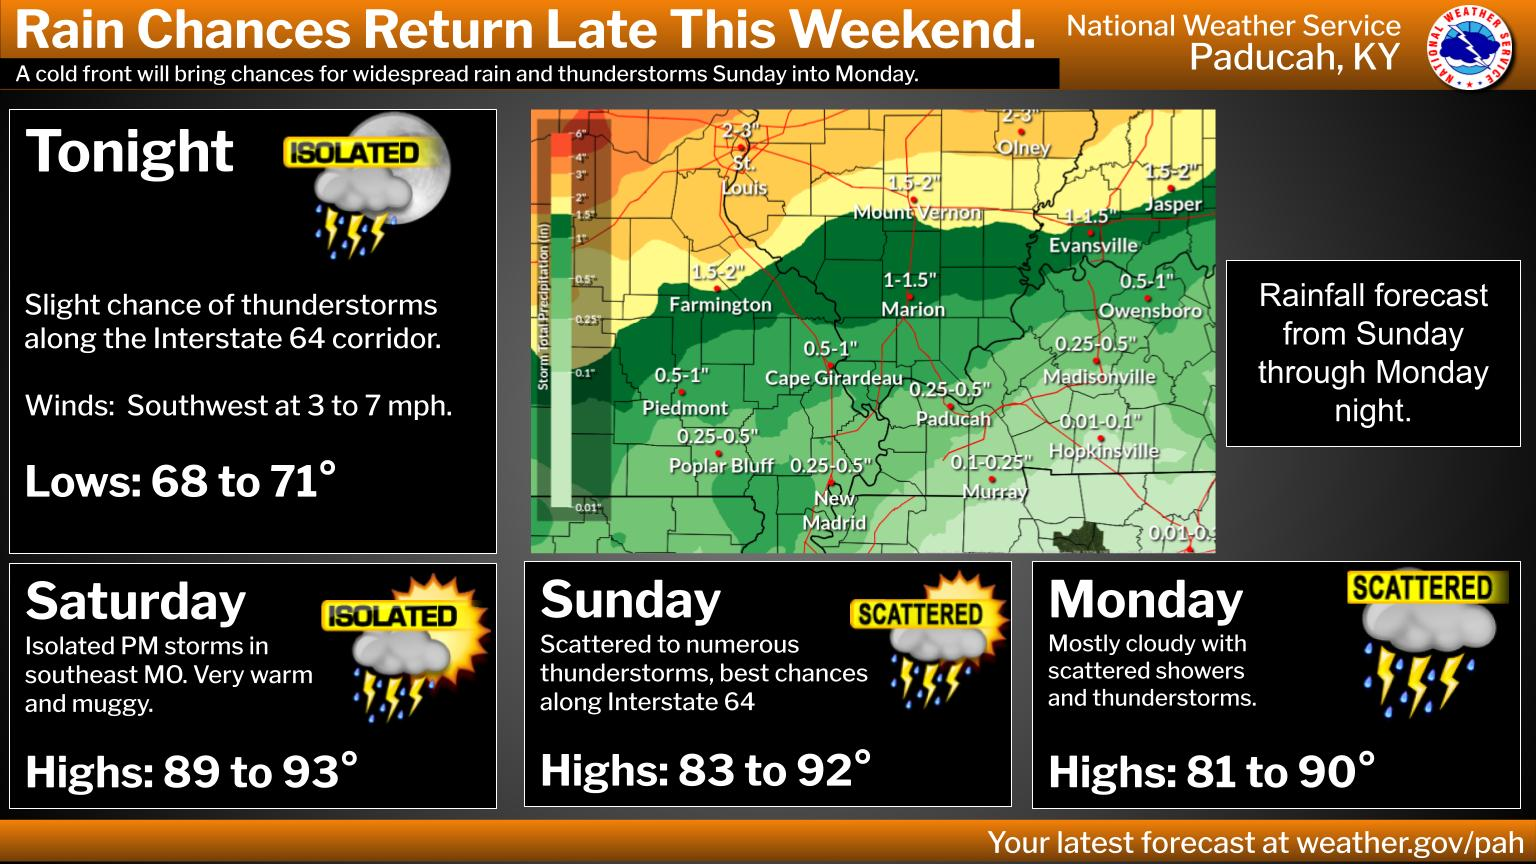
After no rain all month, we FINALLY get some.........on Halloween
The good news is that it looks like the cold front triggering the rains could be thru by late afternoon/early evening. Maybe just in time to have the rains pass to our east to have a couple of dry hours for Trick or Treating.
It's very close and 3 days away.
If it slows down, we're messed up.
If it speeds up, we have it made.
Winds will be breezy and temps dropping to the 50s. Not that cold for Halloween.
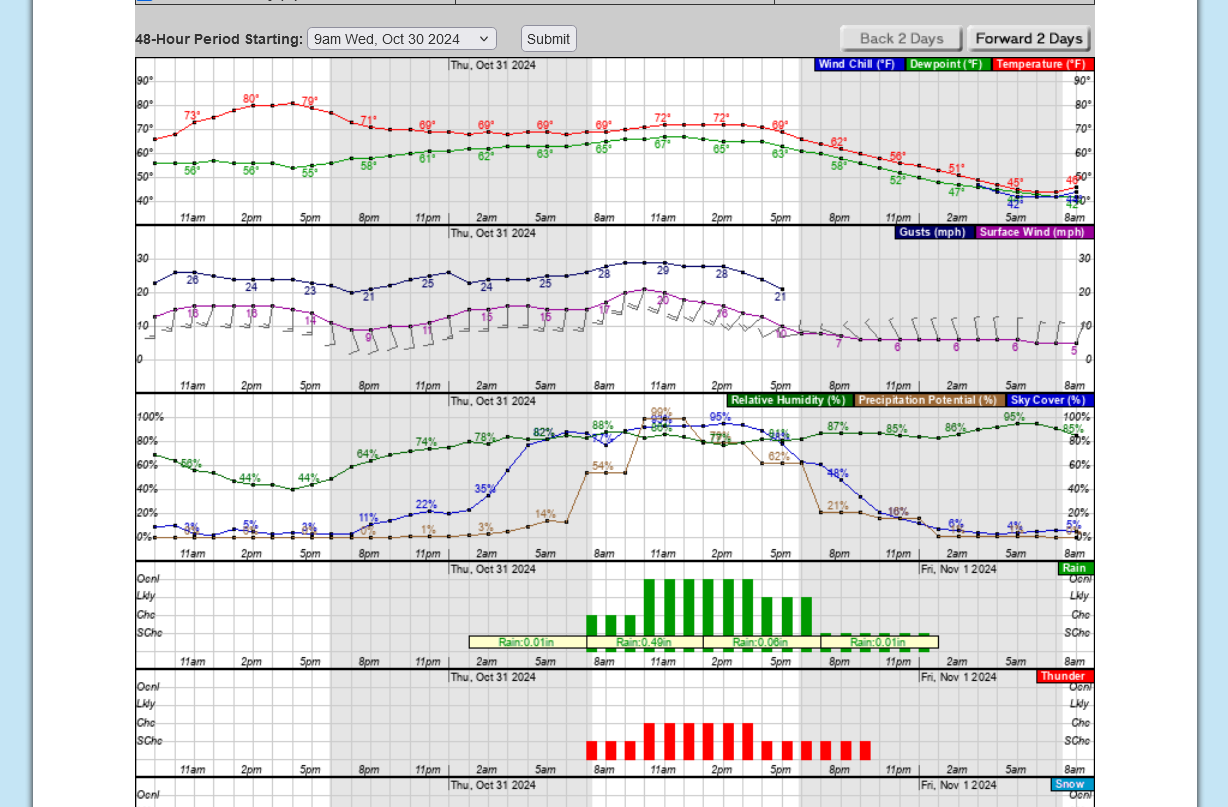
The forecast has slowed the front a tad on Thursday. An early attempt for a pinpoint time frame forecast is that we could have a huge, widespread rain event much of the day Halloween that ends abruptly around 6pm or so.
That MIGHT give us a couple of dry hours to trick or treat AFTERWARDS.
EVANSVILLE SHOULD MOVE THEIR TRICK OR TREATING TO FRIDAY!
OR EVEN SATURDAY?
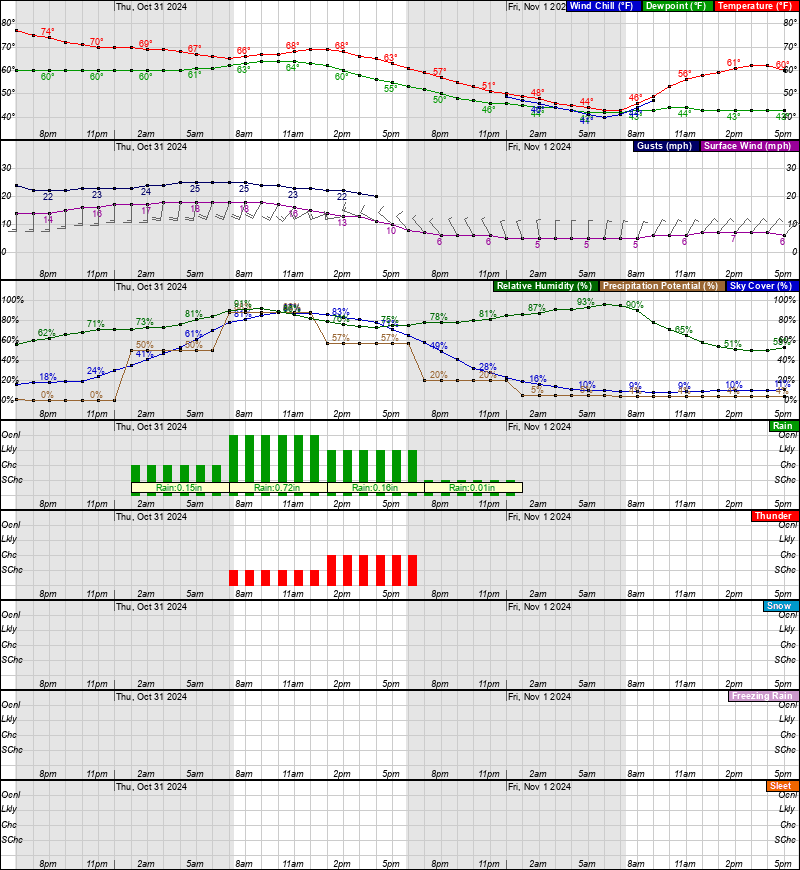
2pm update: The chance of rain drops from 85% to 20% between 6p and 7p on Halloween!!!
We do need the rains though!
Get all the comprehensive weather here:
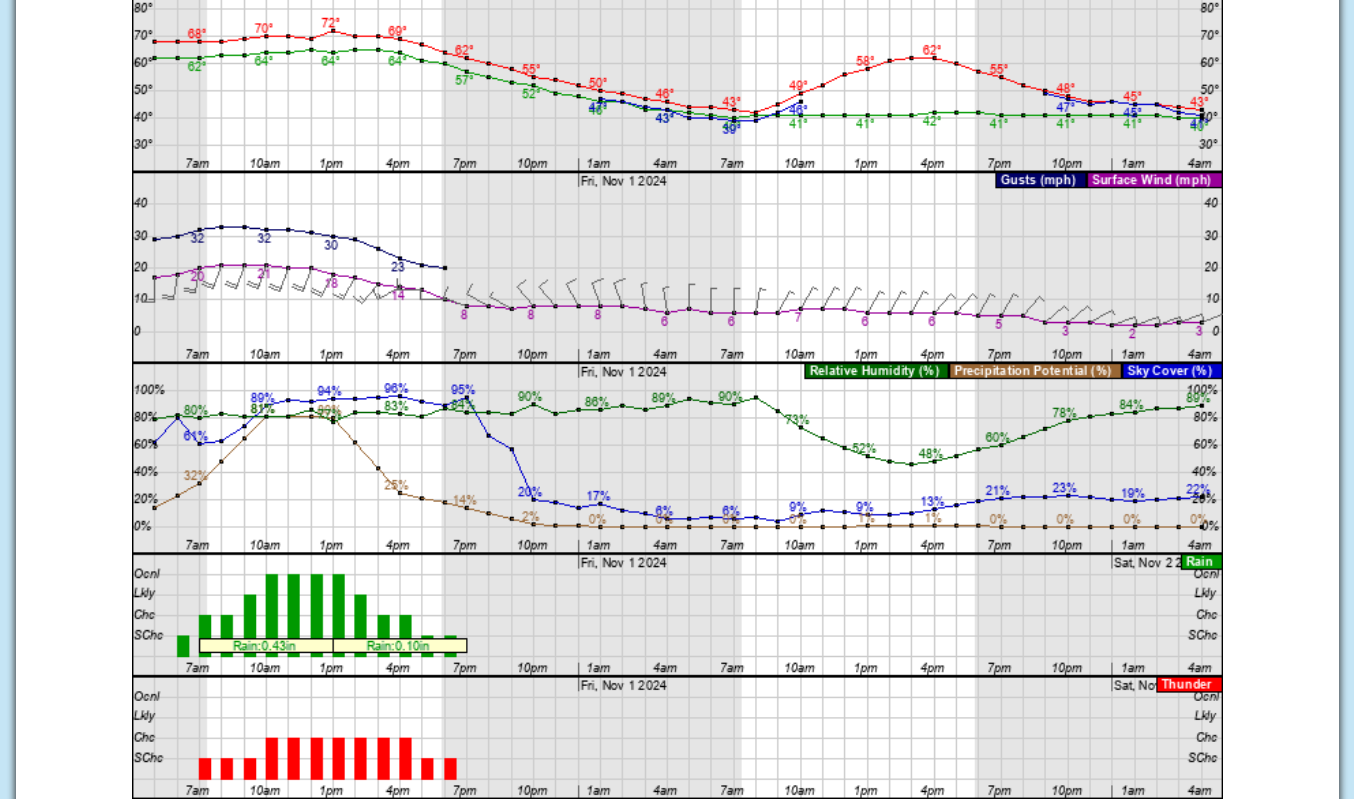
The latest guidance actually speeds things up a tad and stair steps the rain chances lower, late on Halloween afternoon for Evansville, IN.
The cold front will sweep thru just before 6pm. That will shift rain chances east of Evansville. However, there could be a prefrontal band of showers that races ahead of the cold front, with the back edge that pushes thru during the afternoon, a few hours BEFORE the front. with the actual frontal passage going thru dry.
PLEASE SCROLL DOWN FOR THE LATEST UPDATE!
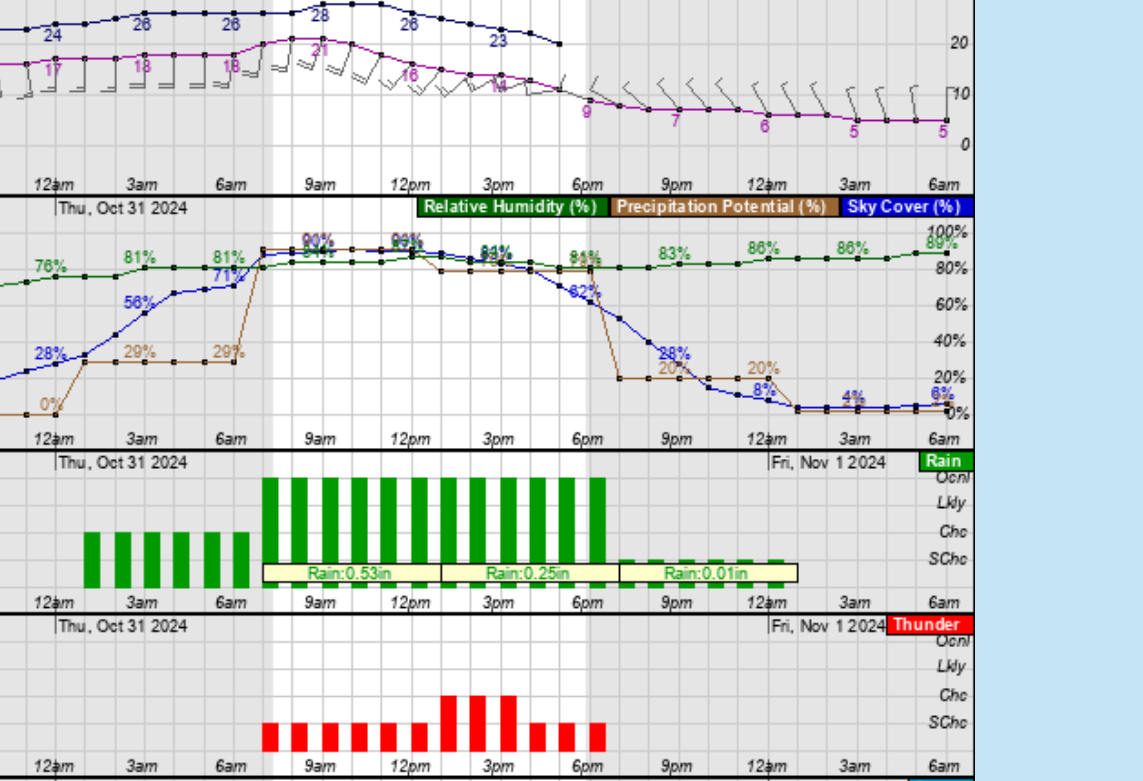
Similar to the previous analysis. Highest chance of rain is late morning to just after noon. Probably from an area of showers that races way out ahead of the cold front by 5-6 hours. After noon, that area moves to the east but the cold front could still trigger showers, like 50% chance. When the cold front is thru after 6pm, rain chances are low ~20%.
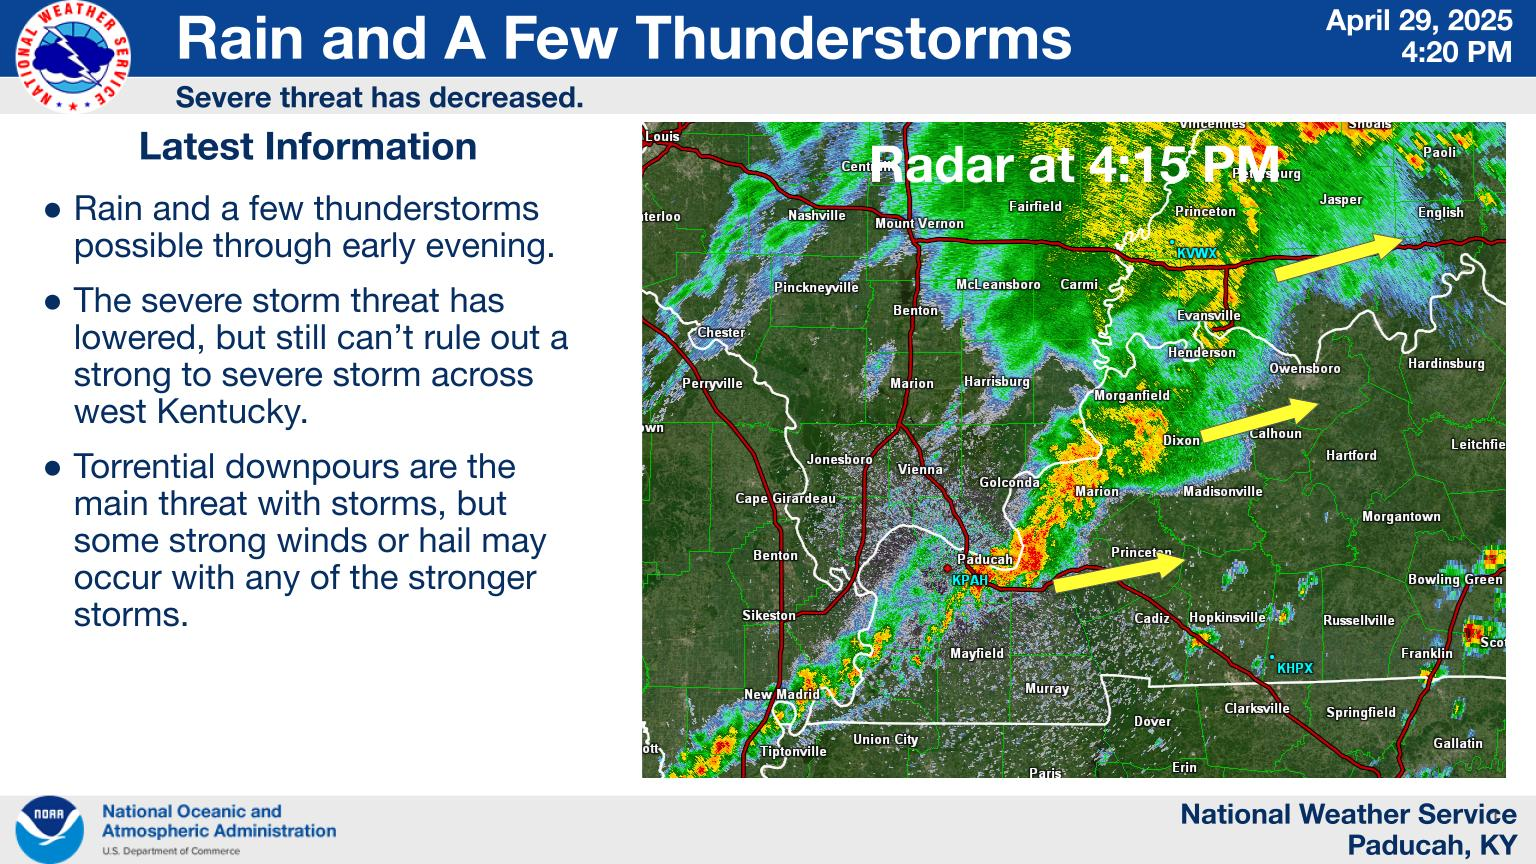
The real world manifestation of the weather forecast is being depicted with radar images that capture realities vs just models guessing at how it will shape up.
https://www.marketforum.com/forum/topic/83844/
As a result, we are getting a more definitive picture, with more confidence of what will happen today. The numerical guidance below, from the last model run has a 99% chance of rain until 1pm(similar to previous runs) THEN, a gradual plunge in rain chances every hour for the following 6 hours, down to 14% chance of rain at 7pm. A continued drop, every hour to 0% at 1am Friday.
This forecast, is MUCH better than the outlook for trick or treating from earlier in the week, with a good chance the MAIN RAIN EVENT will be over after the kids get out of school. HOWEVER, THE COLD FRONT WILL STILL BE APPROACHING UNTIL AROUND 6PM AND THE LIFT FROM THAT COULD STILL TRIGGER A SHWR/T'SHWR
We measured .8" in the front yard...YIPPEE! First real rain in well over 4 weeks!!! The NWS has a bit less than that. Still around 4 hours of mostly light rain to go
On the local radar, we can see an area of enhanced rain in SouthCentral IL associated with a small upper level wave, moving northeast.
When that passes thru AFTER 4-5pm, it should kick the back edge of the rain thru, even though the front is still just barely behind it.
The rain is just ending now in Mt. Vernon IL.
Just monitor the back edge of the rain on this radar image and you can be a "meteorologist" for Halloween
https://radar.weather.gov/station/kvwx/standard
Rains will end abruptly just after 4pm!
Yippee!
After .9" of extremely welcome, glorious rain!!!
Rains have continued to increase in drought areas which will almost wipe out the drought in some spots. Just what the vegetation/crop doctor ordered.
Heaviest rains will be WEST of Indiana.
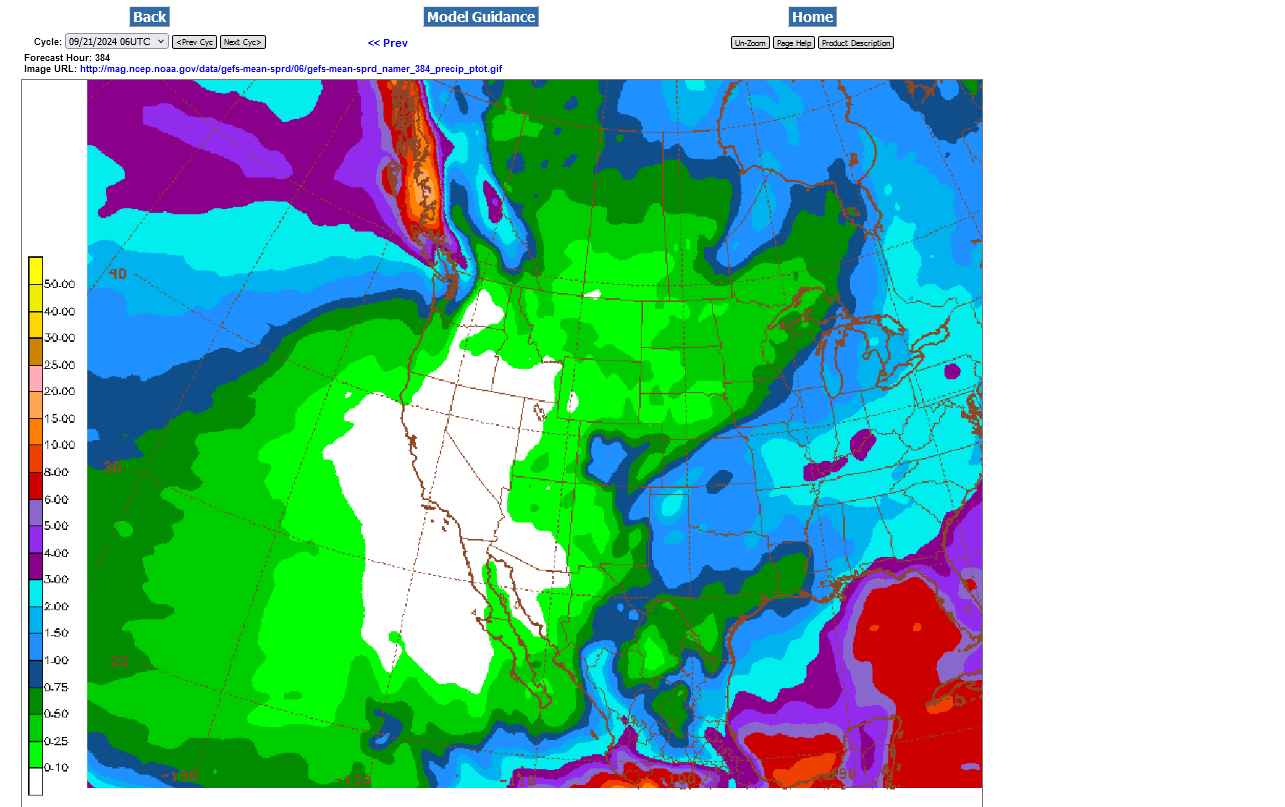
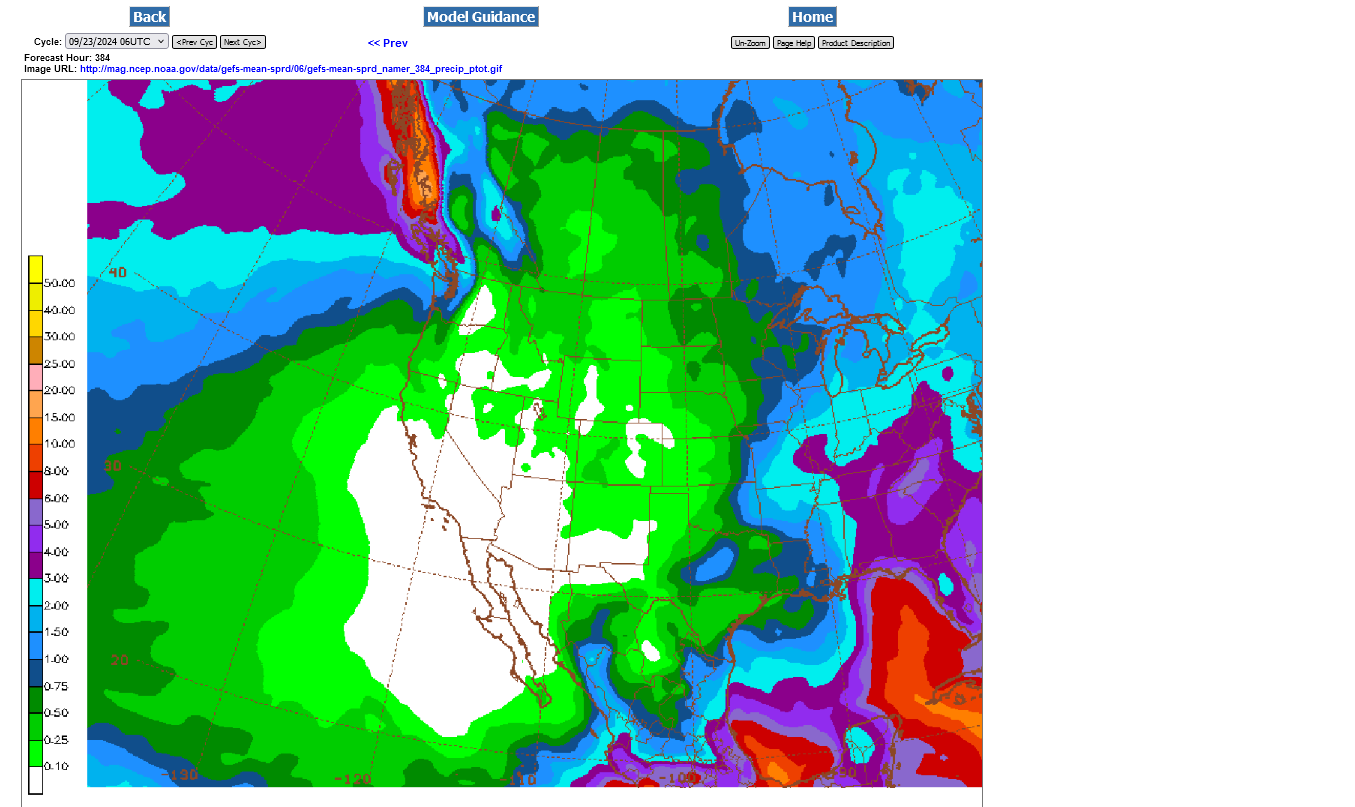
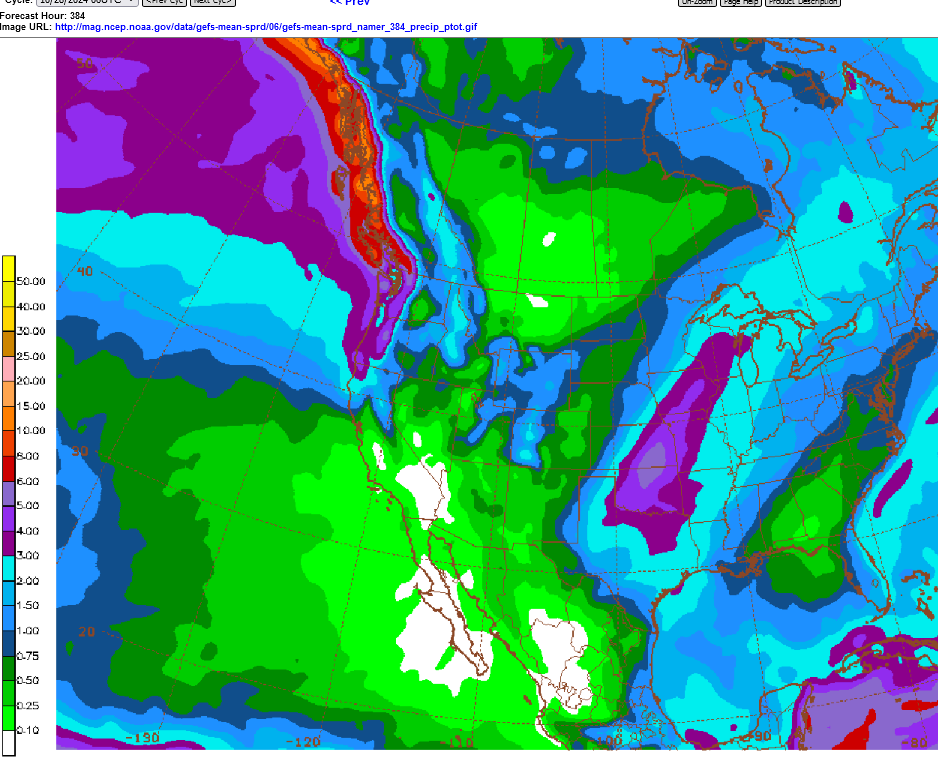
Total 16 day amounts on this last 6Z GEFS. WOW! This is NOT like most La Nina's!
yes after nearly a weeks promise of an all day soaker our south farms got 2/10ths and the northern ones got 4/10ths
Sorry you missed most of this last one, mcfarm.
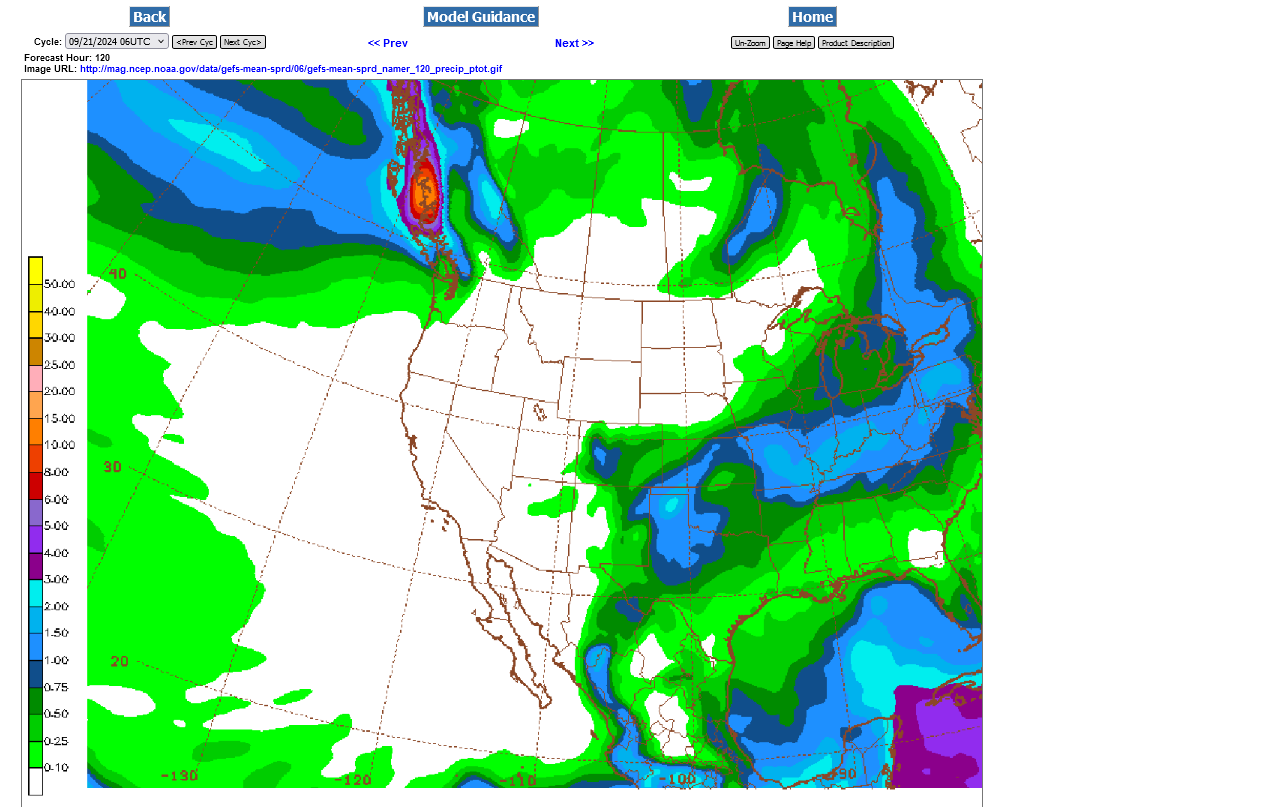
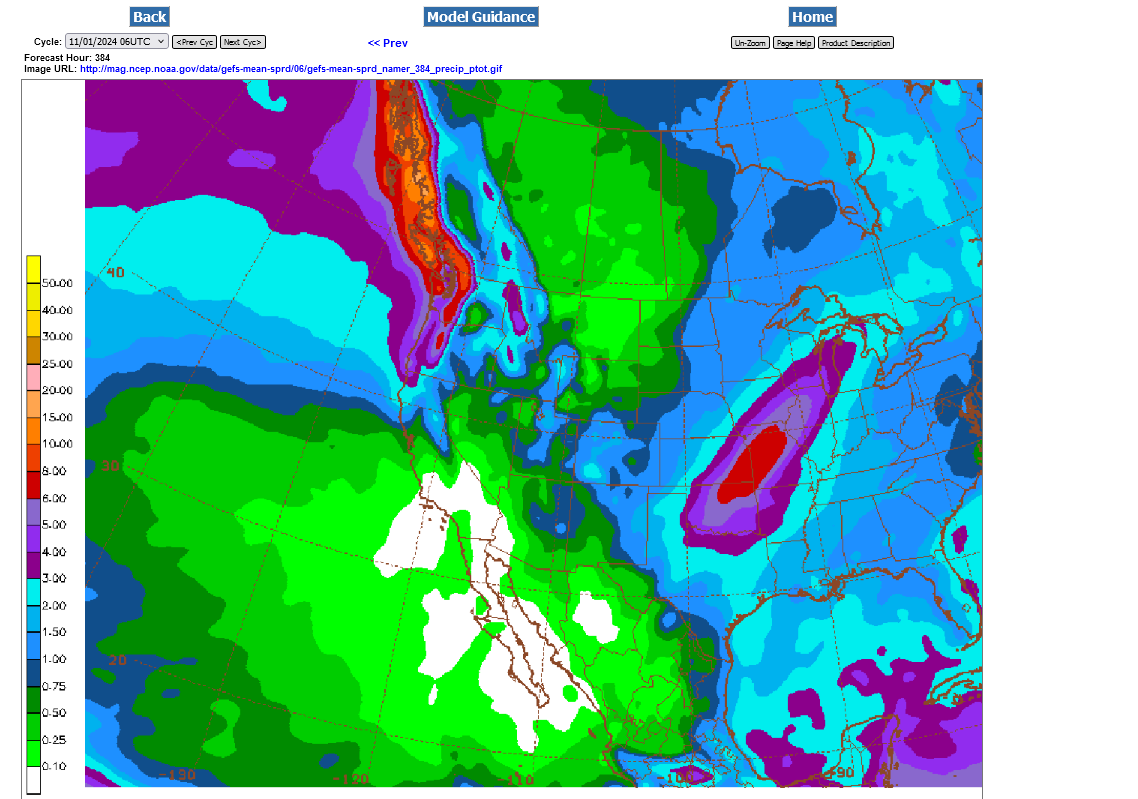
Hopefully, some of the extremely heavy rains to our southwest will work in here.
Prospects are decent for around 2 inches, which is the light blue below. ....but the rain chances won't arrive until the middle of next week.
384 hour total rains on the last 121z GEFS run:
 Weather Map