https://www.cbsnews.com/news/north-carolina-record-rainfall-once-every-1000-years/

https://www.cbsnews.com/news/north-carolina-record-rainfall-once-every-1000-years/
++++++++++++++++
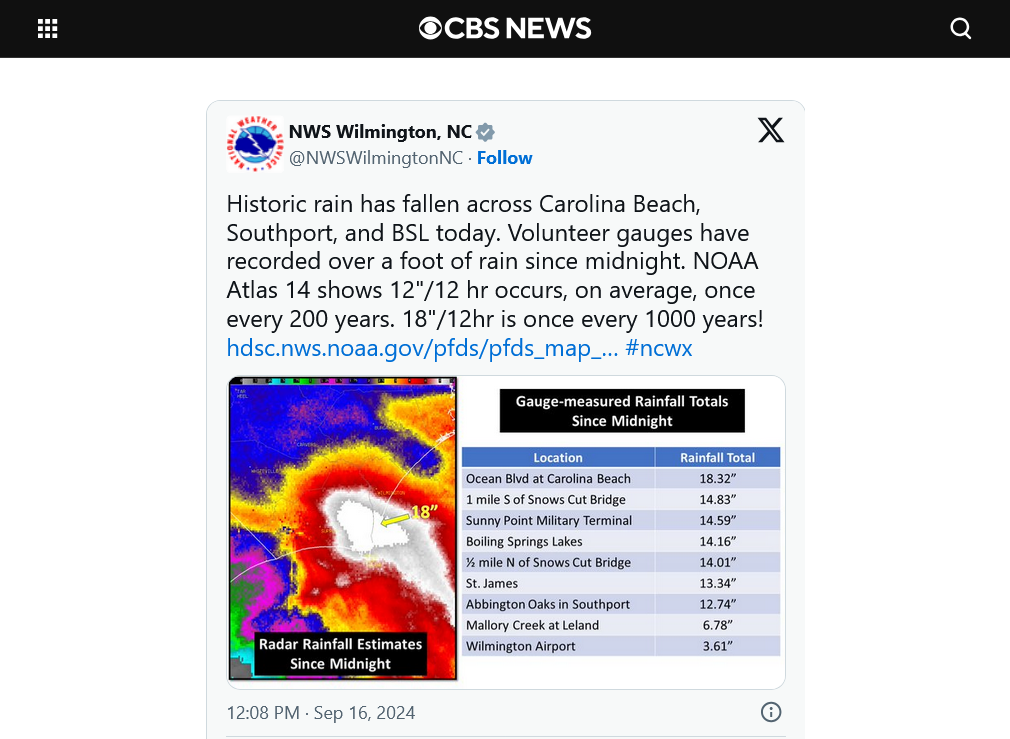
1. No question that a 1 deg. warmer atmosphere and ocean, all things being equal can contribute an additional ~7% moisture. In the slightly cooler climate of a century ago, that would still mean ~17 inches of rain instead of 18.32" at the isolated spot that got 4 inches more than the other places nearby. 17 inches would still be a 1 in 1,000 rainfall.
2. This is still the MAIN reason for 93% of the rain:
It really boils down to this, once again(Cliff Mass can be counted on as an elite source for using objective, authentic science)
https://cliffmass.blogspot.com/2016/03/the-golden-rule-of-climate-extremes.html
The GoldenRule
Considering the substantial confusion in the media about this critical issue, let me provide the GOLDENRULE OF CLIMATE EXTREMES. Here it is:
The more extreme a climate or weather record is, the greater the contribution of natural variability.
Or to put it a different way, the larger or more unusual an extreme, the higher proportion of the extreme is due to natural variability.
3. When we are calling events like this 1 in 1,000 year events with such frequency, we might want to re evaluate what a 1 in 1,000 year event is. That term is very misleading because it applies to odds at 1 isolated spot. The reality, is that natural variation of extreme weather ALWAYS causes 1 in 1,000 year events at many different places Every year.
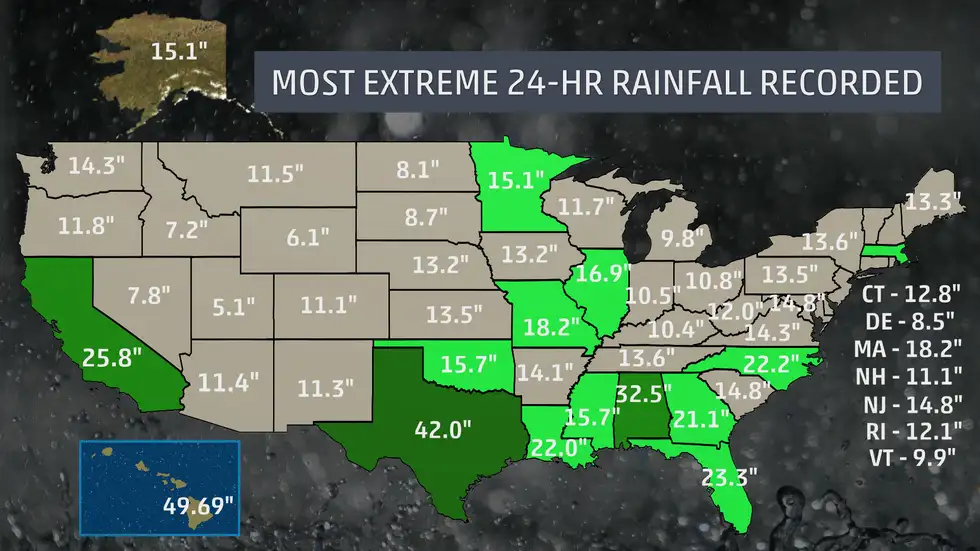
4. This did NOT even break the 24 hour rainfall record for the state of NC. You will note on the map below, that NC juts out into the Atlantic in a way that no other East Coast state does which CAUSES these extreme rains from the geography that includes higher elevations going inland adding to lift/convergence.
https://weather.com/news/climate/news/extreme-rainfall-precipitation-recorded-50-states
The record rainfall for NC was 8+ inches greater, set 25 years ago.
The vast majority of these rainfall records were set well before climate change could have had an impact.
https://www.wunderground.com/cat6/Summary-US-State-Historical-Precipitation-Extremes

US Rainfall Records
The map/link below shows rainfall records for the US for total rains, going from a time frame of 1 minute up to a time frame of 1 year. If you go to the link, you will see this better. It shows the date of occurrence for each of these 20 events. The surprise is that all of them occurred BEFORE 1983 and before man made global warming and climate change would have been a factor. I can't completely explain this as I had recently done a study on our local region going back 120 years that did show heavier rain events over the last 30 years with an especially big increase in the last 15 years..
I think that we have in fact had at least a slight increase in the # of extreme rain events, however, this shows that regardless of humans the really extreme events have always happened and will continue to happen.
http://www.nws.noaa.gov/oh/hdsc/record_precip/record_precip_us.html
| USA Records-HDSC/OWP www.nws.noaa.gov Disclaimers: Some data are estimates. Not all data have been verified. "*" indicates questionable veracity. Coordinates are approximate. |
Duration Amount (in) Location Start date
1-min 1.23 Unionville, MD 4 Jul 1956
5-min 2.03 Alamogordo Creek, NM 5 Jun 1960
12-min 2.30 Embarrass, WI 28 May 1881
15-min 3.95 Galveston, TX 4 Jun 1871
30-min 7.00 Cambridge, OH 16 Jul 1914 42-min 12.0 Holt, MO 22 Jun 1947
13.8* Burnsville 6 WNW, WV 4 Aug 1943
60-min 12.0 Holt, MO 22 Jun 1947
12.0 305 Kilauea Sugar Plantation, Kauai, HI 24 Jan 1956
90-min 14.6 Burnsville 6 WNW, WV 4 Aug 1943
2-hr 15.0 Woodward Ranch (D'Hanis), TX 31 May 1935
2.17-hr 19.0 Rockport, WV 18 Jul 1889
2.75-hr 22.0 Woodward Ranch (D'Hanis), TX 31 May 1935
3-hr 28.5 Smethport, PA 18 Jul 1942
4.5-hr 30.7 Smethport, PA 18 Jul 1942
12-hr 34.3 Smethport, PA 17 Jul 1942
18-hr 36.4 Thrall, TX 9 Sep 1921
24-hr 43.0 Alvin, TX 29.42 -95.24 25 Jul 1979
3,4,5 4-day 62.0 Kukaiau, Hamakua, HI 27 Feb 1902
8-day 82.0 Kukaiau, Hamakua, HI 28 Feb 1902
1-month 149 Mt. Waialeale, Kauai, HI 1 Mar 1982
12-month 739 Kukui, Maui, HI 1 Dec 1981
++++++++++++++++
However, there were a number of individual STATE rain records broken in 2018/19. with a 1 year anomaly/spike higher.
Since 1970, the US has been wetter, as seen on the graph below.
https://www.wunderground.com/cat6/Summary-US-State-Historical-Precipitation-Extremes

https://rogerpielkejr.substack.com/p/what-is-a-1000-year-flood
+++++++++++++
The Collapse of Climate-Related Deaths: Deaths have ‘fallen over 90% since 1920’

https://www.ranker.com/list/worst-floods-in-history/eric-vega?page=4
1. August 1931 Yangtze River, China 3,700,000 killed
2. September 1887 Yellow River, China 2,000,000 deaths
3. June 1938 Yellow River, China 800,000 deaths
4. August 1975 Banqiao, China 230,000 dead
5. 1935 Yangtze River 145,000 dead
6. November 1530 St. Felix Flood, Holy Roman Empire/Europe 100,000+ killed
7. August 1971, Hanoi/Red Rivers, North Vietnam 100,000 dead
8. May 1911 Jiangsu-Anhui, China 100,000 dead
9. December 1287 Holy Roman Empire/Europe 50,000+ dead
10. September 1949 Guatemala 40,000 dead
11. June 1954 Yangtze River, China 30,000 dead
12. June 1974 Bangladesh 28,700 dead
13. January 1362 St. Marcellus Flood-Ireland/Britain/N.Germany 25,000+ dead
14. November 1570 All Saints Flood Netherlands 20,000+ killed
15. December 1999 Vargas mudslides Venezuela 20,000 dead
How many of these events took place in the last 40 years?
Answer= 1
How many were caused by climate change =0
How many were 5% worse because of climate change(1999) =1
You want a REAL climate CRISIS?
This is what it looks like:
Can you imagine if this below happened today? It's less likely because climate change and the current climate OPTIMUM is helping to PROTECT US!
The planet had a REAL climate crisis between 1876 and 1878.
50 million people died. 3% of the global population died from that real climate crisis!
https://news.climate.columbia.edu/2017/12/15/causes-great-famine-drought/

https://ui.adsabs.harvard.edu/abs/2017AGUFMGC51F..04S/abstract
The 1876-1878 Great Famine impacted multiple regions across the globe including parts of Asia, Nordeste Brazil, and northern and southern Africa, with total human fatalities exceeding 50 million people, arguably the worst environmental disaster to befall humanity.
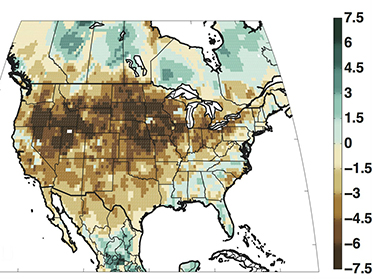
NASA EXPLAINS THE DUST BOWL DROUGHT
https://www.nasa.gov/centers/goddard/news/topstory/2004/0319dustbowl.html
A brief history of U.S. #corn yield growth since the 1860s Notable growth in yields was seen after the adoption of modern fertilizers in the 1940s, which made drought years esp. in the 1980s stand out more than before (compare with 1930s Dust Bowl for example).
++++++++++++++++++++++++++++
And the current climate crisis is somehow worse than the 1930's NATURAL climate crisis(an entire decade called the Dust Bowl)?
https://www.marketforum.com/forum/topic/56668/#56673

https://www.marketforum.com/forum/topic/67004/

https://www.marketforum.com/forum/topic/87422/#87425

Death by Greening:
https://www.marketforum.com/forum/topic/69258/