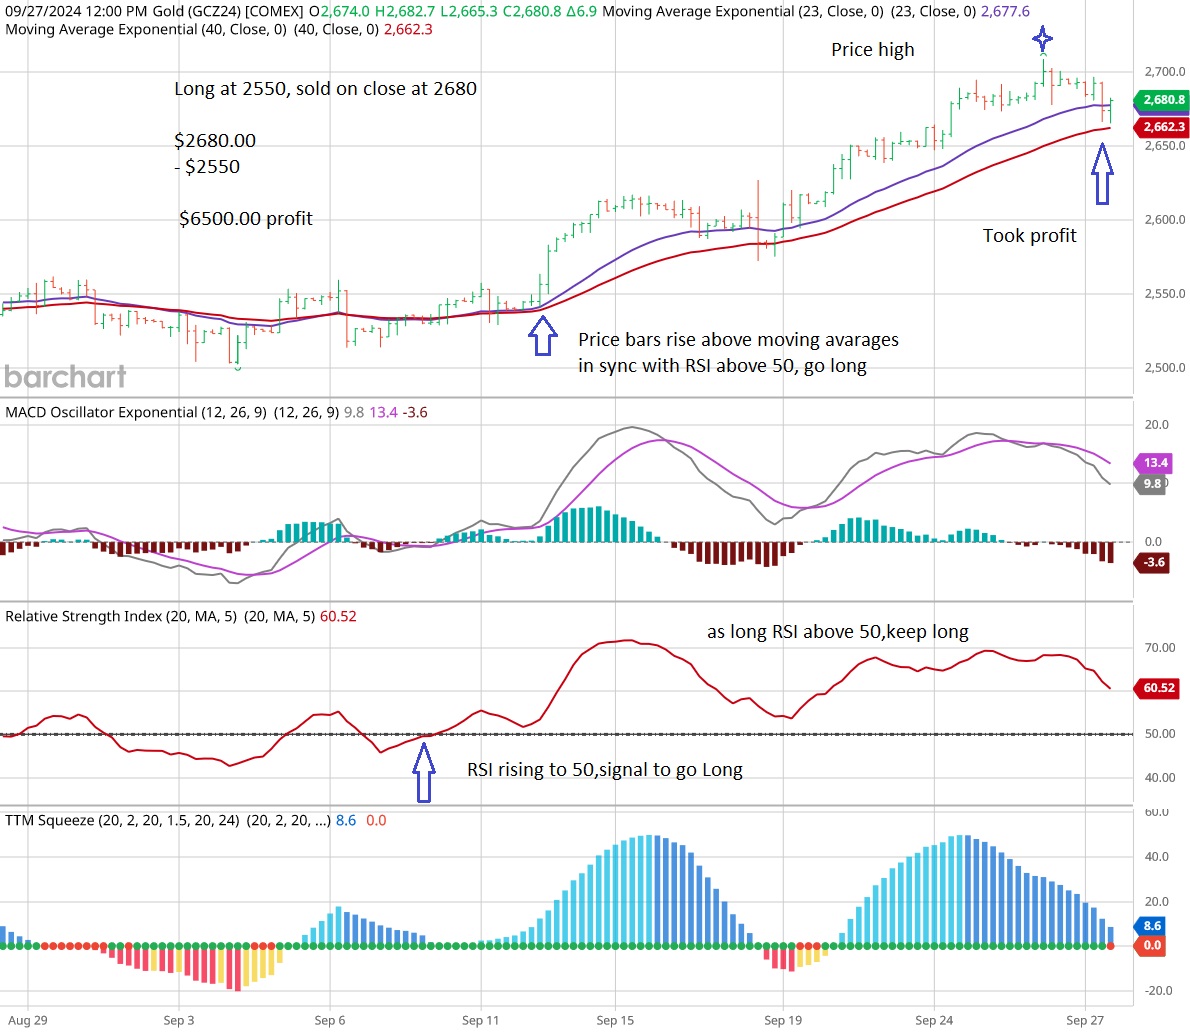
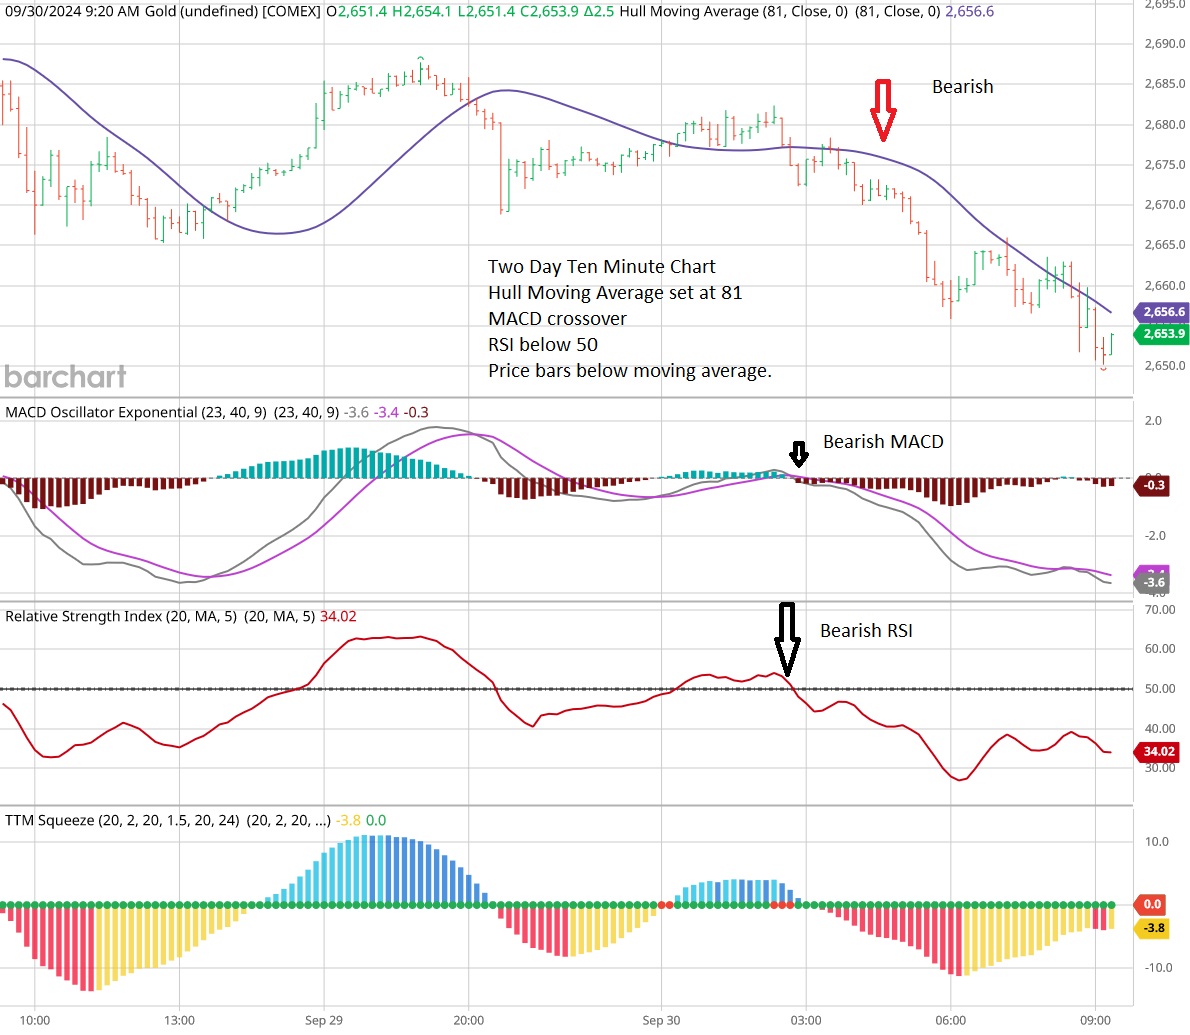
I shorted Gold this morning at 2673 for a scalp. usuing a 10 minute chart and Hull moving avaerage st at 81.
Thanks much, Mike! Just got back from Detroit.
Please keep us posted!
Previous thread:
Gold Trading Range
25 responses |
Started by mikempt - Aug. 4, 2024, 8:29 a.m.
https://www.marketforum.com/forum/topic/106400/
+++++++++++++++++++++++++
https://tradingeconomics.com/commodity/gold
1. 1 week
2. 1 month
3. 1 year
4. 10 years
5. 55 years


Potential topping formation??
Failure to test the previous highs on this last bounce up.
A close below 2626-ish would look pretty bearish. However shorting gold and picking the top in gold in recent times has been a recipe for losses in many cases.
What do you think?
https://tradingeconomics.com/commodity/gold

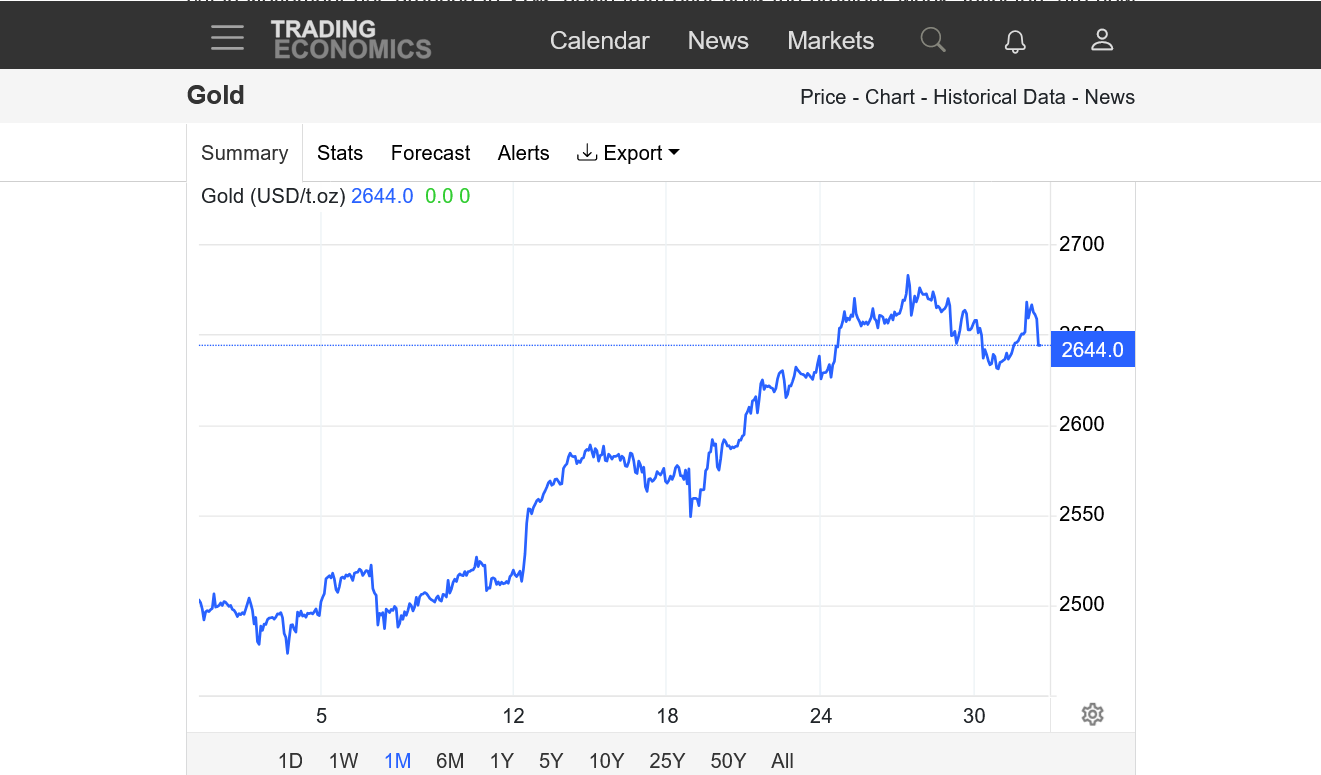
After surging up the last 2 weeks and smashing all time highs, gold reversed down today.
https://tradingeconomics.com/commodity/gold
1. 1 week
2. 1 month
3. 1 year
4. 10 years
5. 50+ years
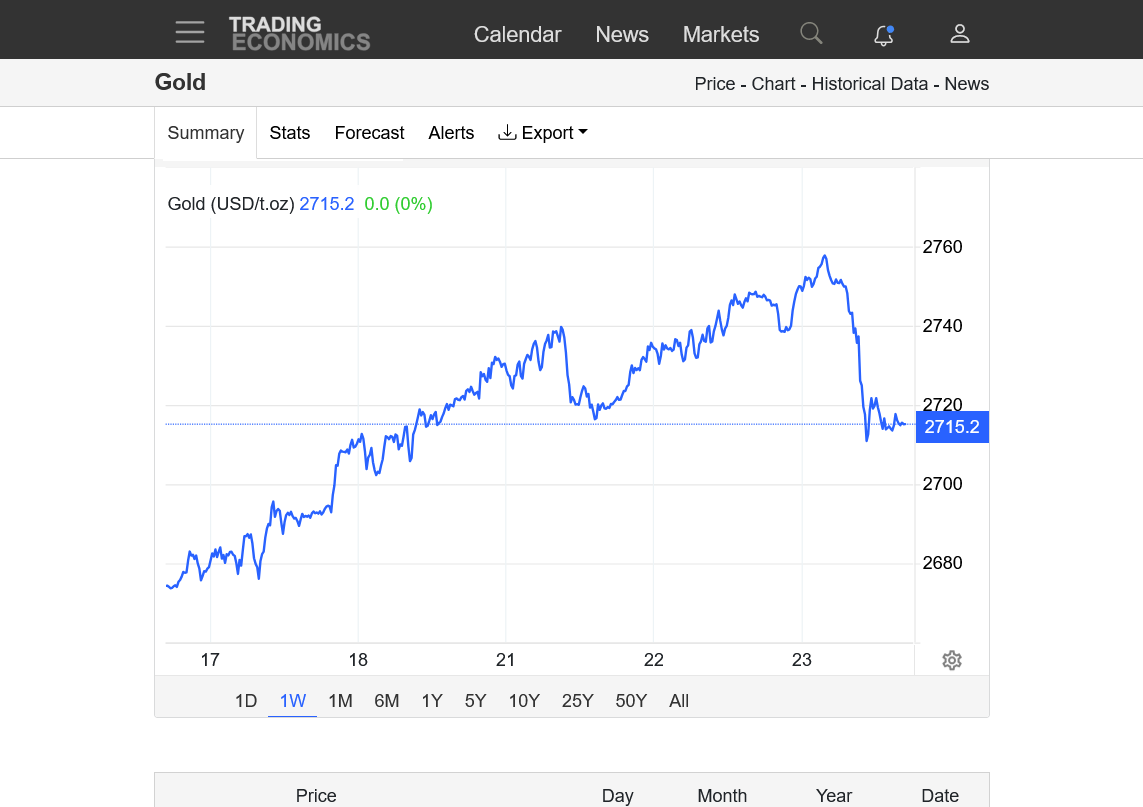


BUT WAS IT INTO SUPPORT??
Scared out weak longs, OR did it top?
Bought a call!
thanks, tjc,
Some of this may be tied to the uncertainty of the election. I am wondering after that uncertainty is cleared up, if gold could react strongly and give up tons of risk premium. I never traded gold.
2708 GOING TO BE make or break till 2780/2808 termination point -=2722. is weekly open and previous weekly high
this is support price should base below for bearish continuation=2708 close on week going lower again= next week could be wild for stox indices --4122/5940 correction or new high --b4 >>5741--5600--4960?? coming b4 dec mid?

Gold making new all time highs again this week!
https://tradingeconomics.com/commodity/gold
1 year chart below. Breaking out to the upside.......again.
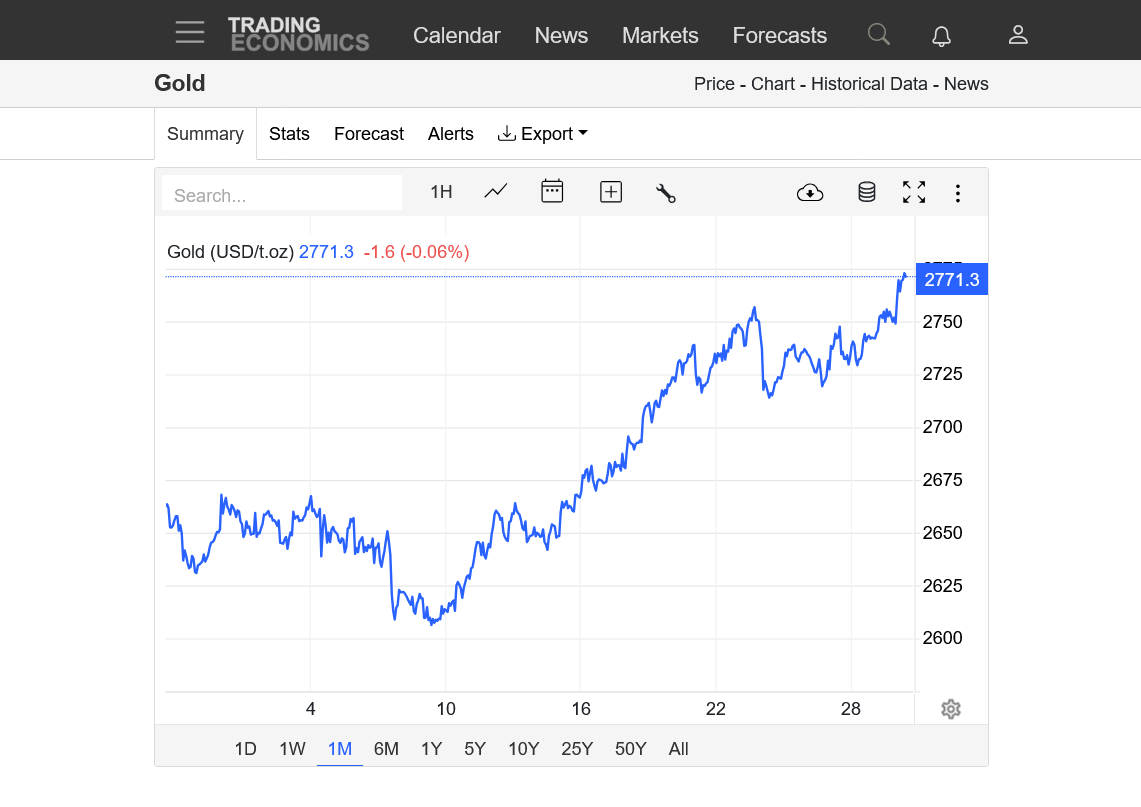
2827/45 ish can be top out projection!! next trump--wins-Bearish Gold!!?? BTC>>> bullish---t
Thanks, fays!
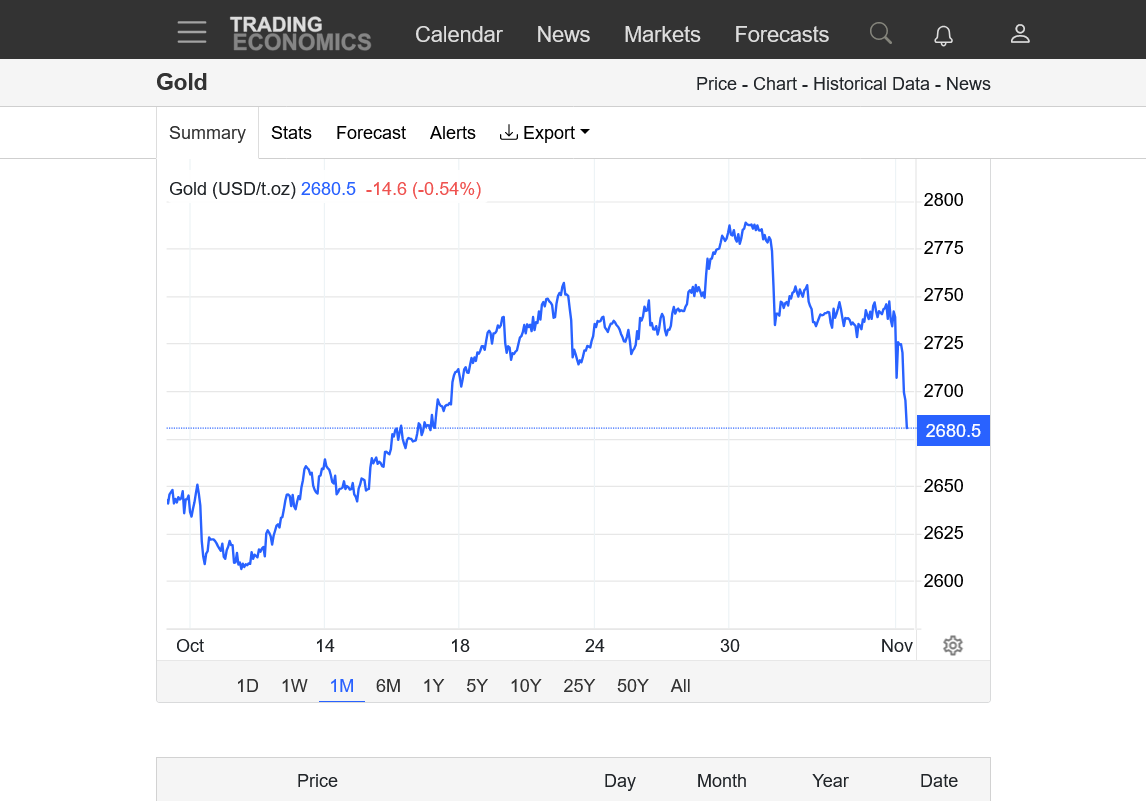
Gold saw a huge spike down at exactly 7am, which strongly suggests some sort of (economic?) news.
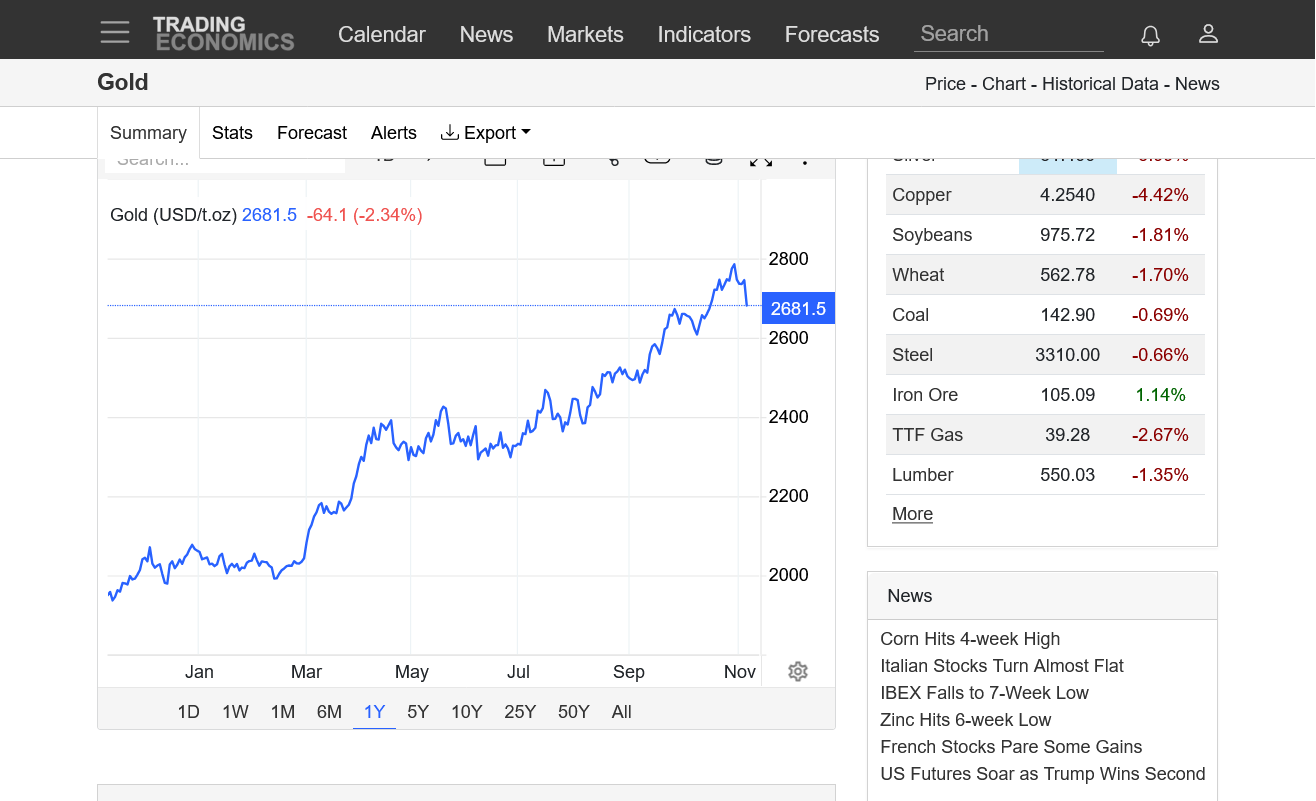
https://tradingeconomics.com/commodity/gold
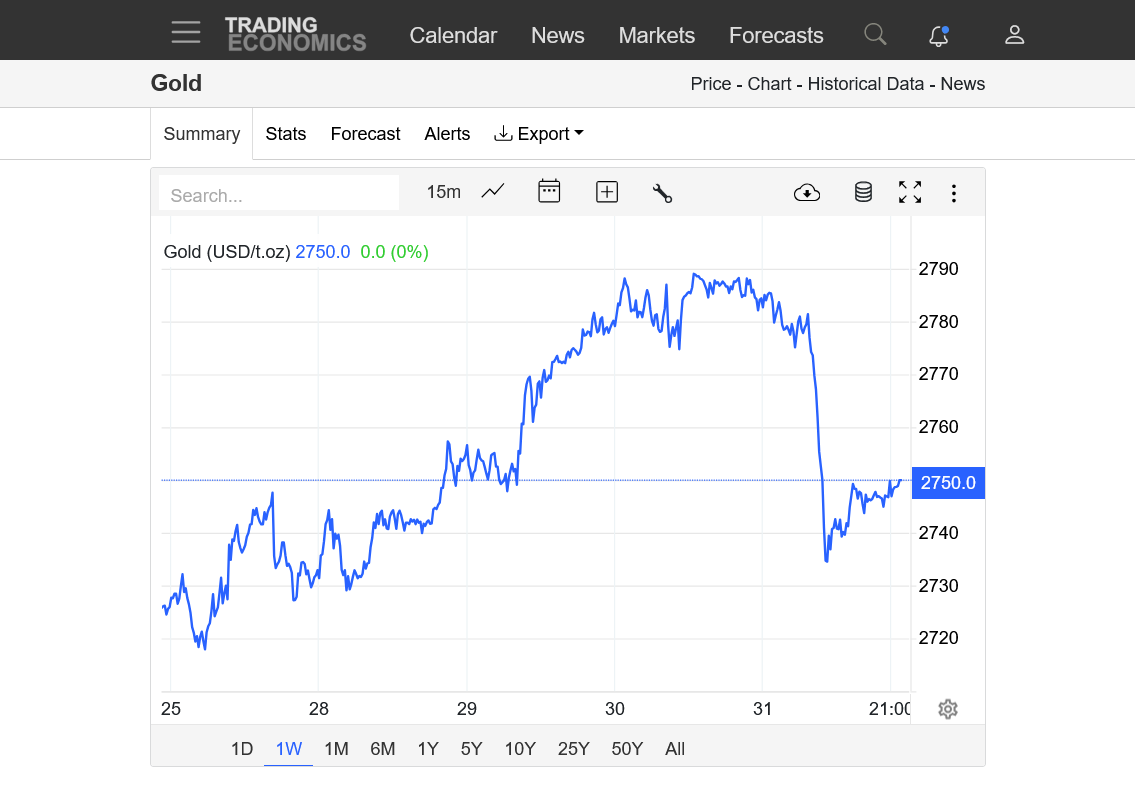
Gold is getting crushed here with tons of risk premium for uncertainty of the election being eliminated
Re: Re: Re: Gold 4 Hour Chart $$$ To Inter day Trade
By metmike - Oct. 23, 2024, 7:52 p.m.
https://tradingeconomics.com/commodity/gold
1. 1 week
2. 1 month
3. 1 year
4. 50+ years

Gold Bearish and BTC higher --- for now !!
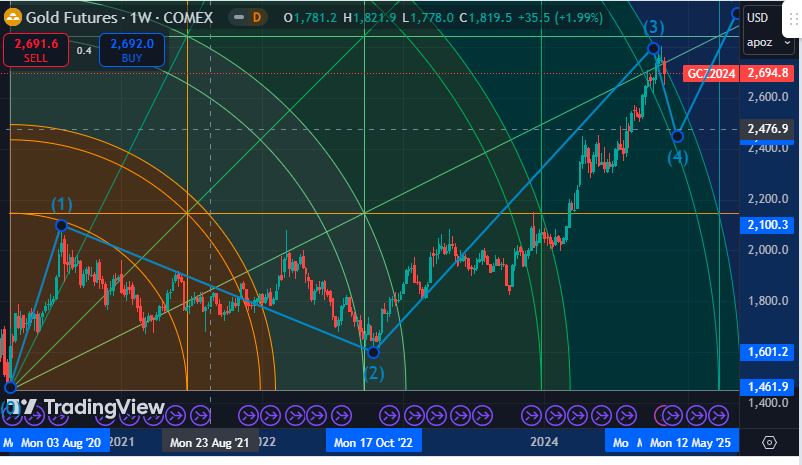
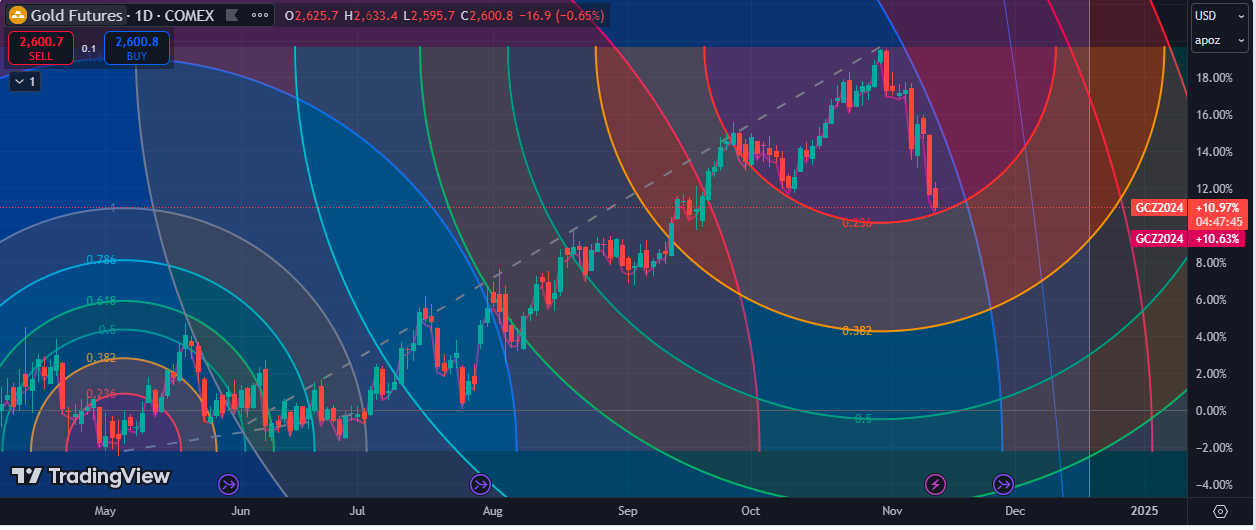
https://tradingeconomics.com/commodity/gold
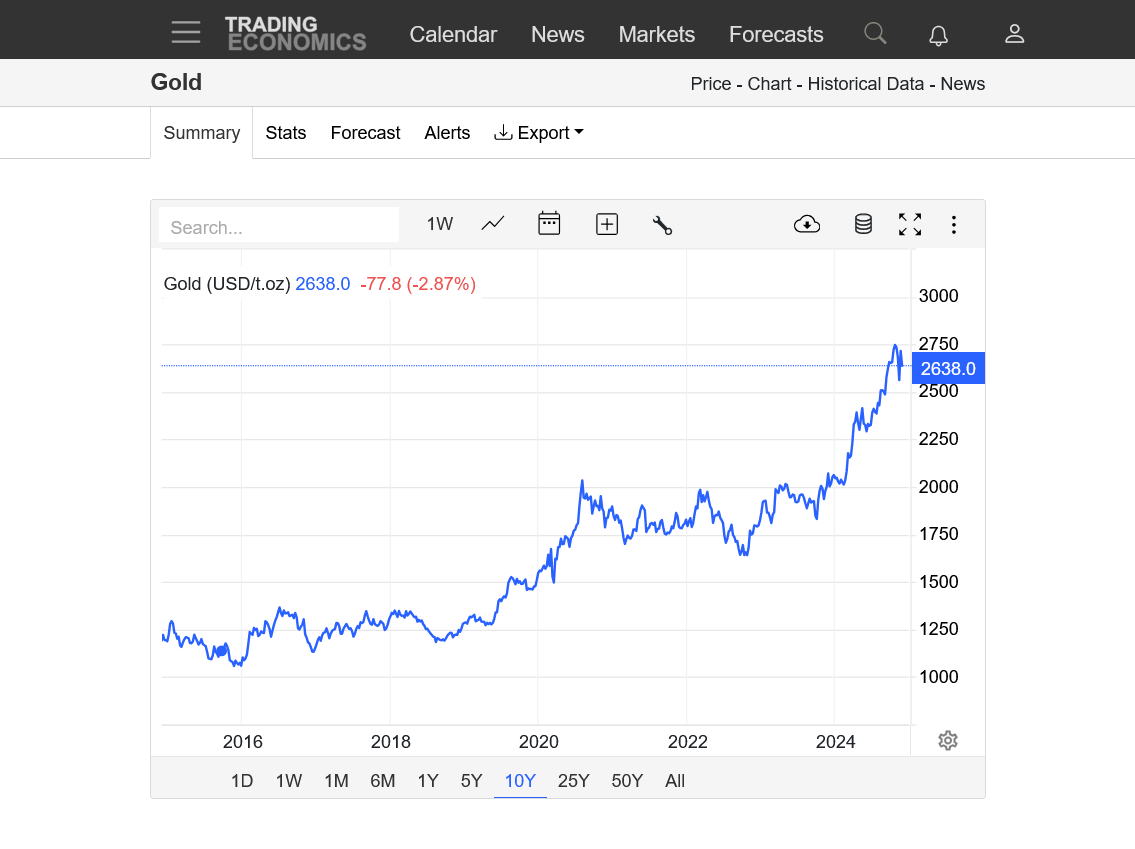
1. 1 year-broken short term trend
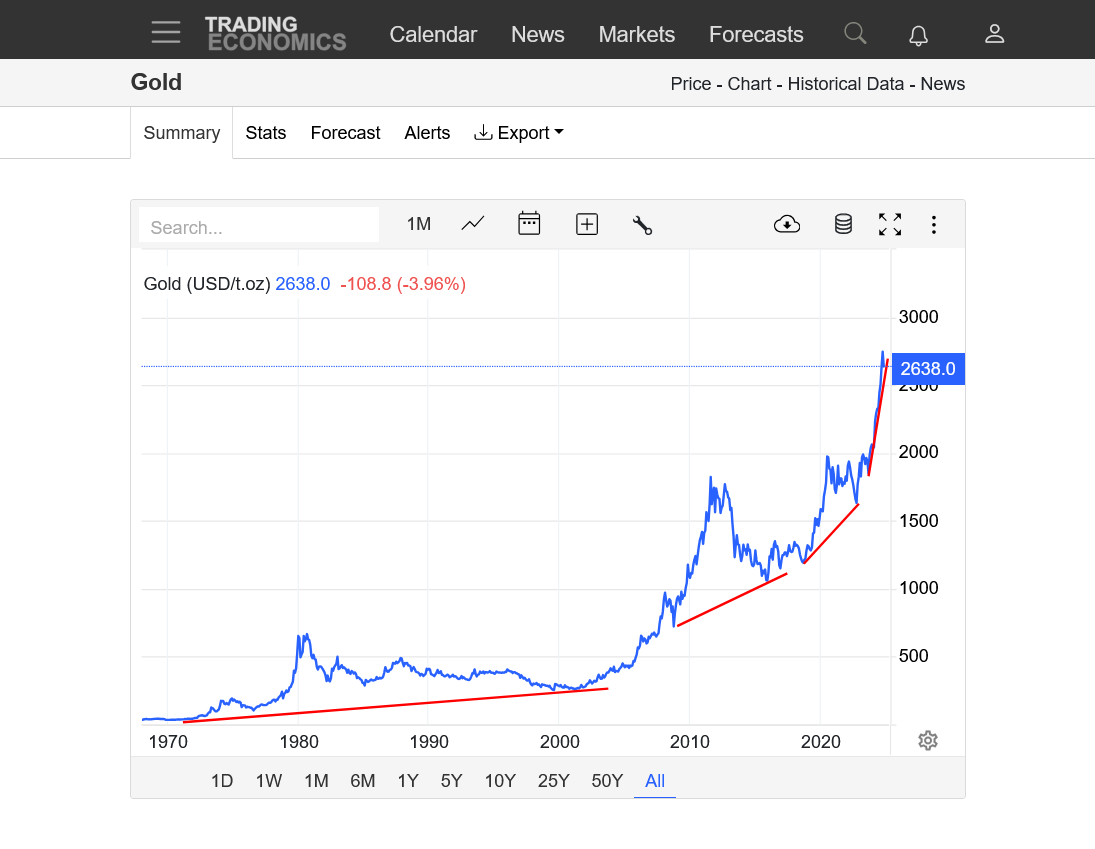
2. 10 years-Parabolic curve
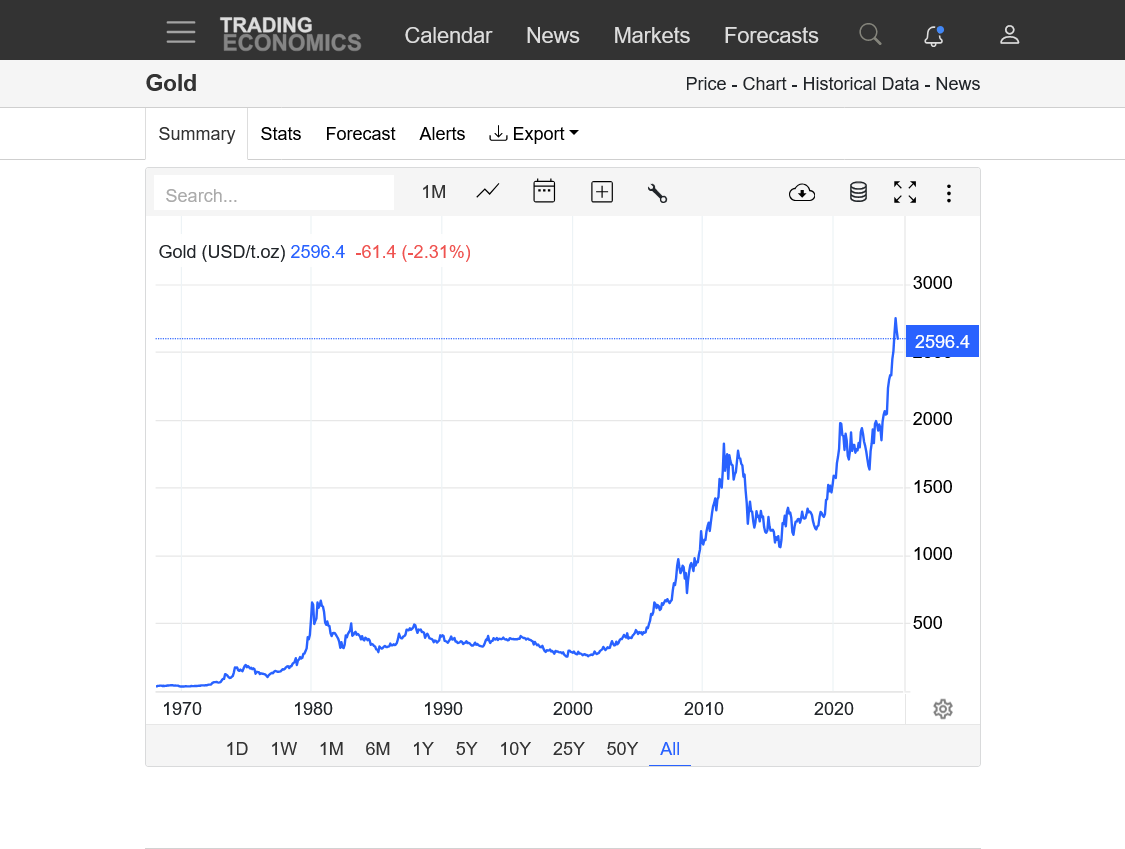
3. 50+ years Parabolic curve- up trendline continues to get steeper and steeper and steeper-UNSUSTAINABLE!

+++++++++++++
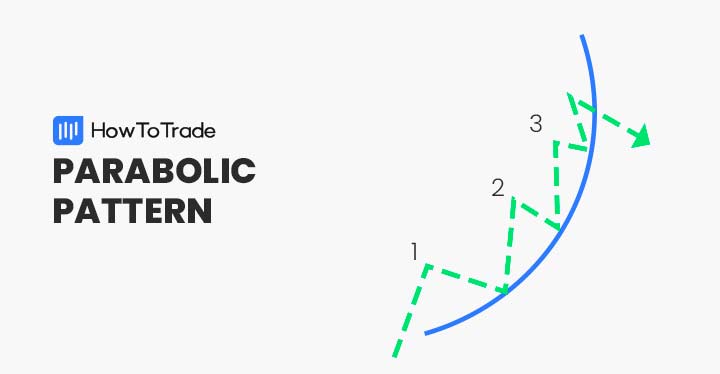
What Is a Parabolic Arc Pattern, and How Can You Trade It?
https://fxopen.com/blog/en/what-is-a-parabolic-arc-pattern-and-how-can-you-trade-it/

https://howtotrade.com/chart-patterns/parabolic-pattern/
Was this THE top or is it just another bear flag??
https://tradingeconomics.com/commodity/gold
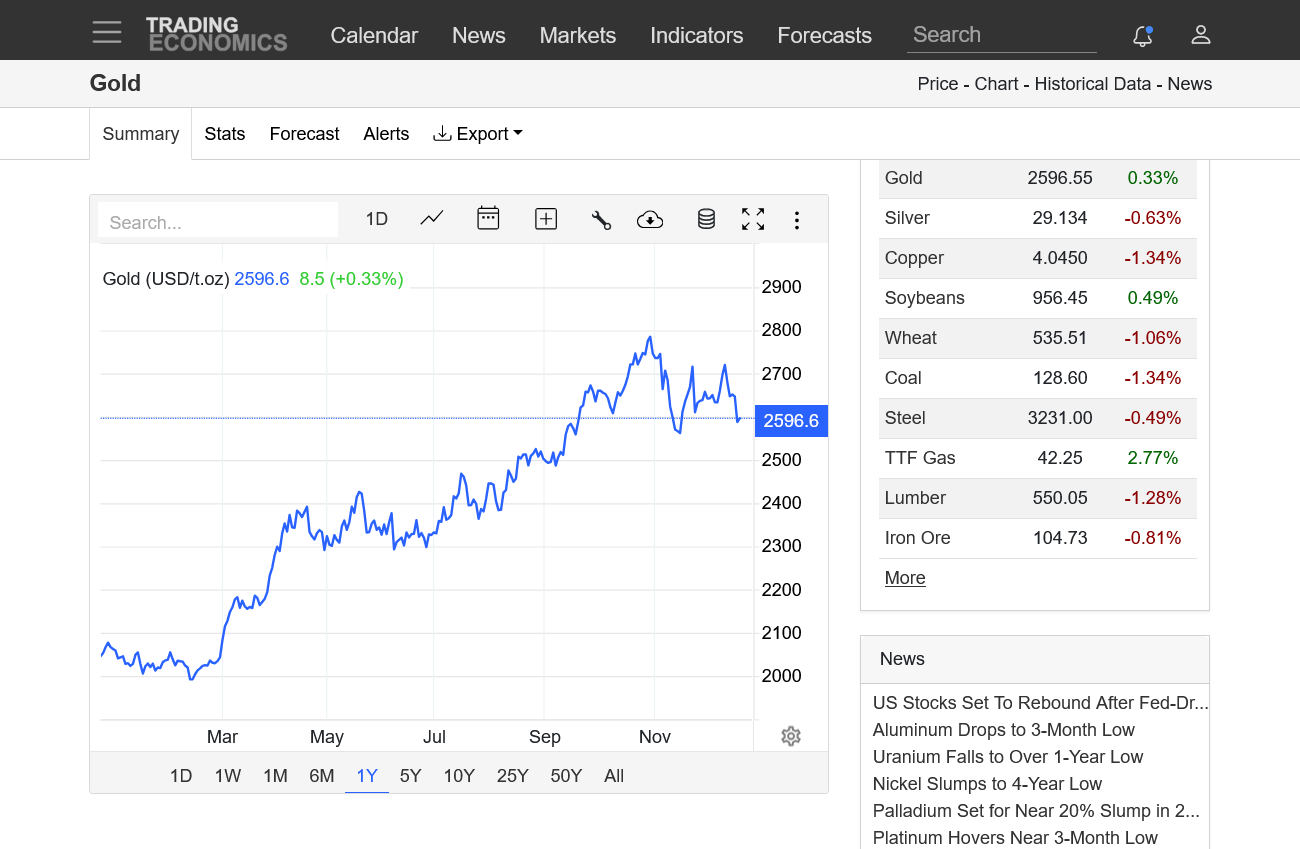
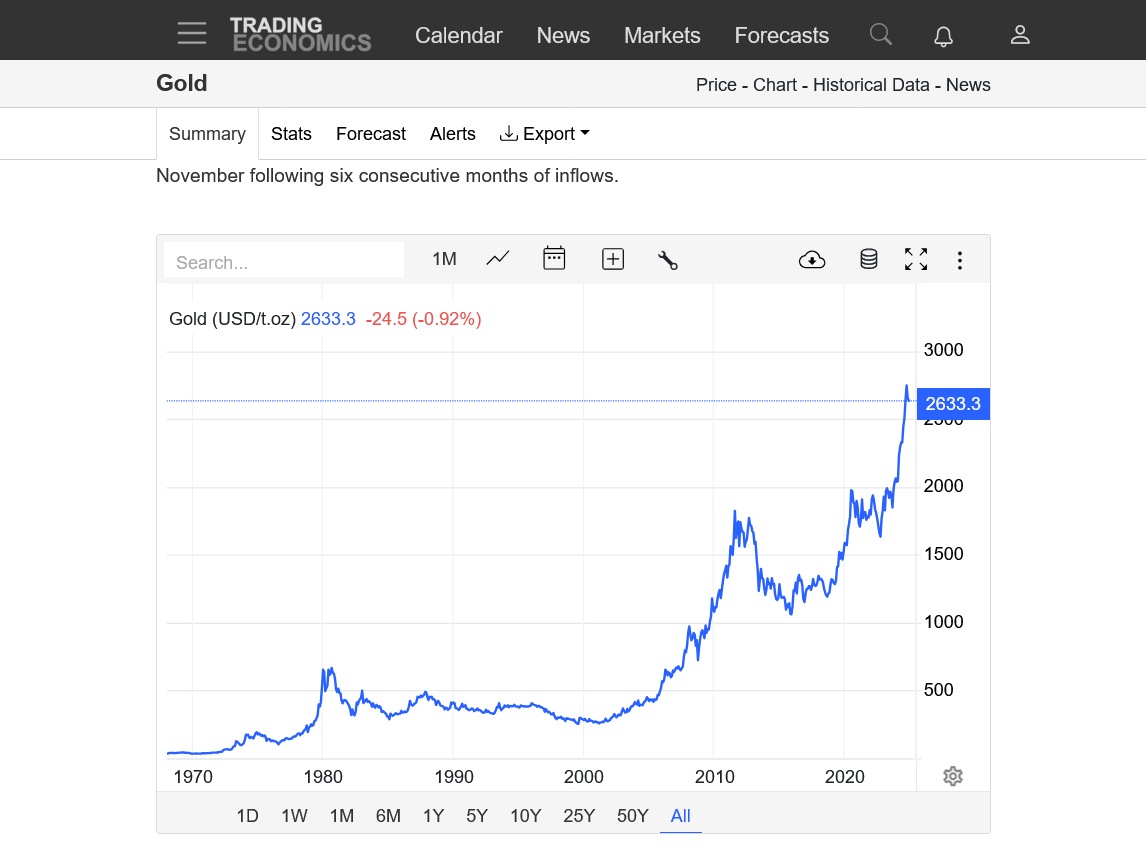
1. 1 year-TOP? or bear flag/pennant? Odds slightly favor new highs because "the trend is your friend" and we haven't violated any significant support levels.......which are impossible to identify definitively in an unprecedented market like this.
2. 10 years-correction barely shows up
3. 50+ years-still parabolic


THE top is likely in!!!
At least for awhile
https://tradingeconomics.com/commodity/gold
1. 1 month
2. 1 year
3. 10 years
4. 60 years

