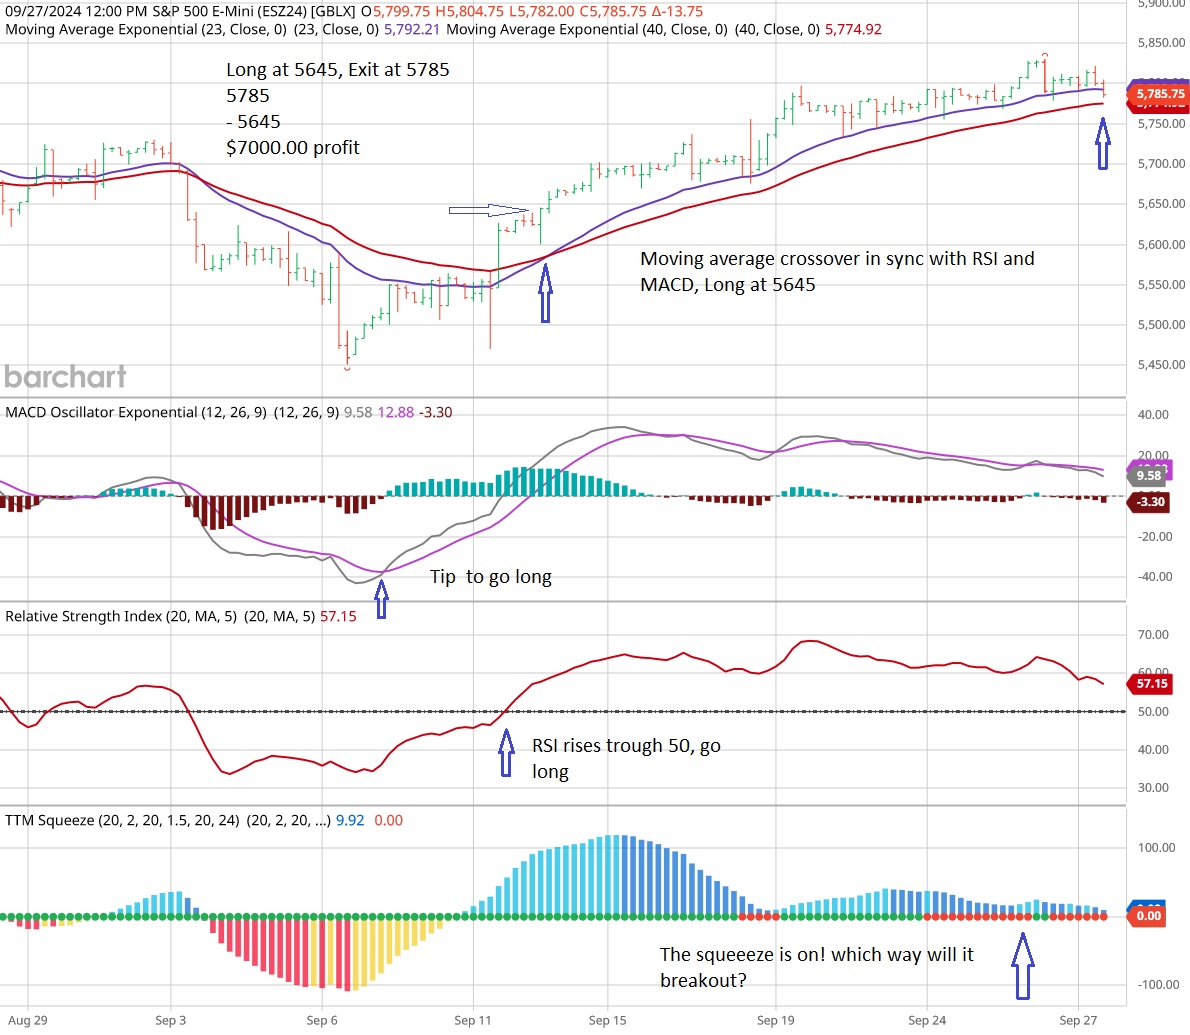

Nice chart!
Please, what is your trade recommendation based upon your use of this data?
With the price bar in between the moving averages, i'm on the side lines!
I guess this is as good a thread to put this as any since it regards equities:
New record highs today for Dow, S&P, and Invidia! Apple and Nasdaq not too far from records, themselves.
Trade the chart!
Thanks!!
https://www.cbsnews.com/news/stocks-up-all-time-high-10-14-2024/
As stocks continue to rise, analysts at VitalKnowldge warn of a market that could do more than "move sideways" into the election.
"In addition to our complaints about valuation (the [S&P 500 Index] is approaching 22x the top-down [earnings per share] consensus for 2025 of $268), we're growing increasingly worried that rather than being a bullish cathartic moment, the election could instead spur a sell-the-news response (especially if this rally continues into 11/5) as investors quickly turn their attention to the massive fiscal challenges facing Washington in 2025," Adam Crisafulli of Vital Knowledge said in a note to investors.
+++++++++++++
https://www.gurufocus.com/economic_indicators/57/sp-500-pe-ratio

I have no skill at predicting the stock market and am not suggesting a trade/position/investment. just having fun sharing some analysis with friends!
I have no idea when the rich persons bubble will run out of steam. What we can say from looking at the above chart is that we've only had PE ratios higher than this for brief periods in history, with the only exception being the late 90's to early 2000's when the budget was having a surplus and the economic conditions were supporting it.
Maybe everything is different today and markets can be manipulated/managed for many years without paying consequences like in the past.
However, the National Debt is already hurting and unless something is done in the next several years. the increasing burden will overwhelm our ability to manage it at some point and it will be too late to stop a cascading implosion.
Chance of that happening eventually on our current path?
Near 100%!
Dangerous expert
Started by metmike - Oct. 7, 2024, 8:22 p.m.
Previous thread:
Sp 500 diamonds for ever--
60 responses |
Started by fays - June 7, 2024, 2:27 p.m.
https://tradingeconomics.com/united-states/stock-market
1. 1 month-breaking out to new highs
2. 1 year-breaking out to new highs
3. 10 years-Increasingly parabolic slope which is not sustainable but can move up fast
4. 25 years-Increasingly parabolic slope which is not sustainable but can move up fast
5. 100 years-Before 2000, I don't think we can apply dynamics to that period


https://www.e-wavecharts.com/parabolicbubble/stock_market_bubble.htm
https://fxopen.com/blog/en/what-is-a-parabolic-arc-pattern-and-how-can-you-trade-it/

How Can You Make Money With a Curved Line Pattern?
Trading strategies using the Parabolic Curve pattern are quite simple. No complicated calculations or combinations of indicators are needed to improve the accuracy of trading signals.
The emphasis of the accuracy of trading signals on the Parabolic Curve pattern lies in the trader's skills in identifying market dynamics through price action charts. Following are the practical steps:
Look for currency pairs or other assets whose trend movements are strong; note the price movements in the pair whose price movements have a slope of more than or equal to 45 degrees to one direction and tiered like a ladder.
Use the trading tool to draw curve lines; some trading platforms provide a built-in Parabolic Curve tool, for example tradingview. As for MT4, you can still use the help of an ellipse curved line pattern instead of the curve.
Pay attention to price movements through candlesticks; if the body of the candlestick appears to break the curved line pattern, the price will have the potential to reverse direction from the previous trend.
Open Position with Money Management. After the trading signal appears to open a position, use the basic money management rules such as the percentage of capital and the Risk / Reward Ratio so that the risk of each position can be controlled.
You can make fast money by riding on Parabolic Curve but you must know when to get out.

Thanks, fays!!
The stock market's parabolic move higher could go for awhile longer or it could crash really hard at any time! I have no skill at predicting this market.