
Previous thread:
Nat. Gas
65 responses |
Started by baker - Aug. 11, 2024, 11:38 p.m.
More very mild weather as far as the maps can see, reducing residential heating demand..BEARISH!
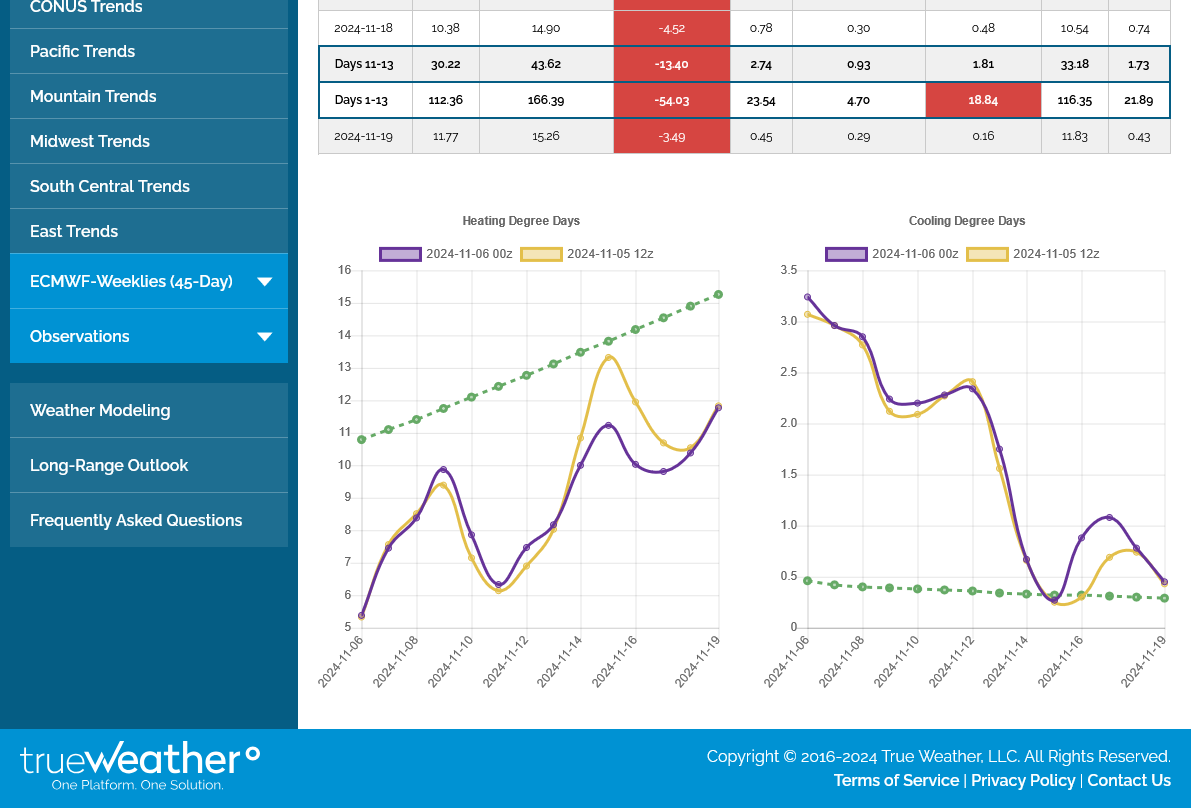
-4 HDDs on this last European model Ensemble solution. Purple/left line. Green is the rapidly increasing historical average.
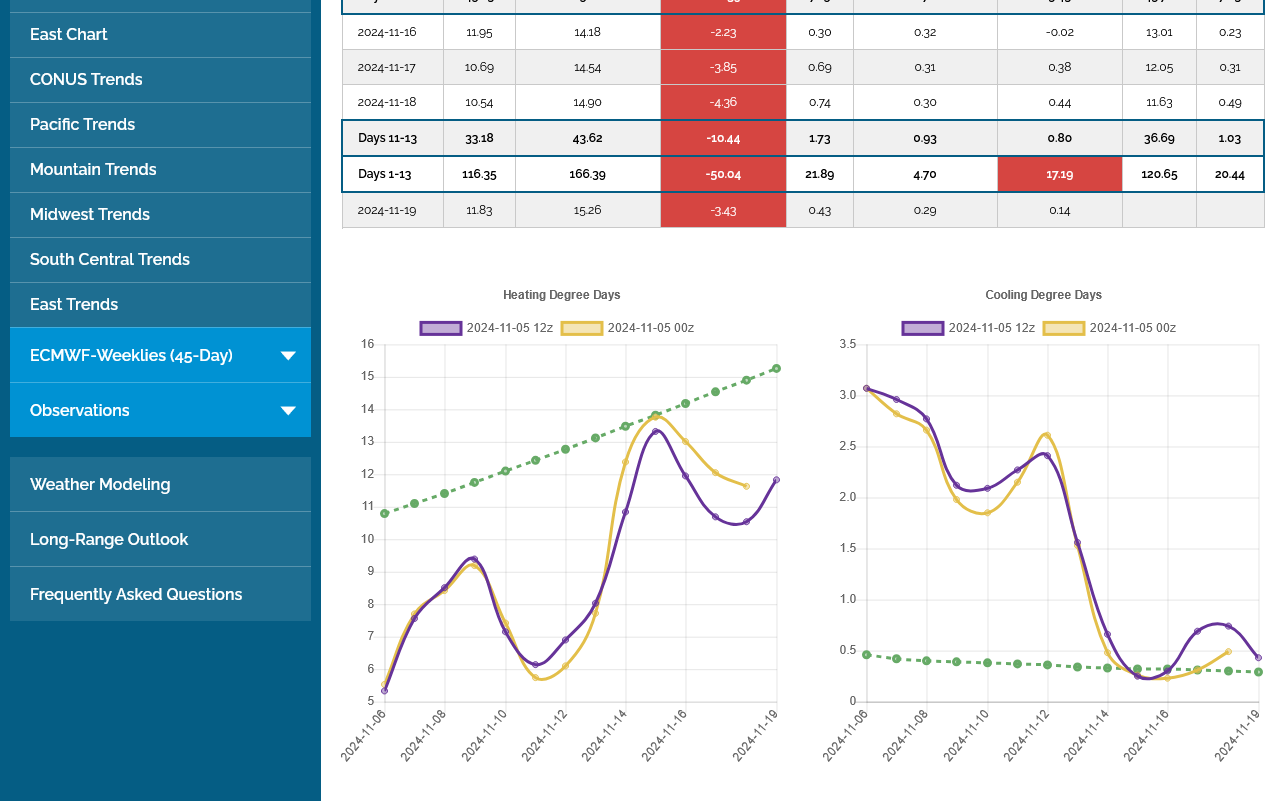
European model was -4 HDDs but natural gas is UP anyways because Trump won.
Former President Trump reclaimed the White House in Tuesday’s election, defeating incumbent Democrat Vice President Harris and triggering early bullish sentiment this morning across U.S. stock futures and supporting some commodity markets, including natural gas.
Thursday's EIA: Another very robust injection for late October, continuing to temporarily reverse the shrinking storage surplus.
https://www.cpc.ncep.noaa.gov/products/tanal/temp_analyses.phphttps://
+7 HDDs bullish on the last 12z EE but no impact on prices. Mainly because it's just cooler on a bunch of individual days WITH THE SAME VERY BEARISH WEATHER PATTERN.

https://ir.eia.gov/ngs/ngs.html
+69 Bcf
Current storage(blue line below) is now +215 Bcf compared to +178 Bcf on the 5 year average a week ago. A +37 Bcf gain in the storage surplus compared to recent years. Note the blue line approaching a record for this time of year.
for week ending November 1, 2024 | Released: November 7, 2024 at 10:30 a.m. | Next Release: November 14, 2024
| Working gas in underground storage, Lower 48 states Summary text CSV JSN | |||||||||||||||||||||||||
|---|---|---|---|---|---|---|---|---|---|---|---|---|---|---|---|---|---|---|---|---|---|---|---|---|---|
| Historical Comparisons | |||||||||||||||||||||||||
| Stocks billion cubic feet (Bcf) | Year ago (11/01/23) | 5-year average (2019-23) | |||||||||||||||||||||||
| Region | 11/01/24 | 10/25/24 | net change | implied flow | Bcf | % change | Bcf | % change | |||||||||||||||||
| East | 934 | 919 | 15 | 15 | 924 | 1.1 | 912 | 2.4 | |||||||||||||||||
| Midwest | 1,130 | 1,109 | 21 | 21 | 1,104 | 2.4 | 1,093 | 3.4 | |||||||||||||||||
| Mountain | 290 | 291 | -1 | -1 | 254 | 14.2 | 224 | 29.5 | |||||||||||||||||
| Pacific | 310 | 305 | 5 | 5 | 284 | 9.2 | 280 | 10.7 | |||||||||||||||||
| South Central | 1,267 | 1,240 | 27 | 27 | 1,208 | 4.9 | 1,208 | 4.9 | |||||||||||||||||
| Salt | 341 | 331 | 10 | 10 | 313 | 8.9 | 318 | 7.2 | |||||||||||||||||
| Nonsalt | 926 | 909 | 17 | 17 | 895 | 3.5 | 890 | 4.0 | |||||||||||||||||
| Total | 3,932 | 3,863 | 69 | 69 | 3,775 | 4.2 | 3,717 | 5.8 | |||||||||||||||||
Note: EIA will begin publishing estimates of working natural gas stocks and the net change in working natural gas stocks based on a new sample selection in the Weekly Natural Gas Storage Report (WNGSR) on November 21, 2024, with the report for the week ending November 15, 2024. On Monday, November 18, 2024, EIA will revise eight weeks of previously released estimates to gradually introduce estimates from the new sample. Totals may not equal sum of components because of independent rounding. | |||||||||||||||||||||||||
Working gas in storage was 3,932 Bcf as of Friday, November 1, 2024, according to EIA estimates. This represents a net increase of 69 Bcf from the previous week. Stocks were 157 Bcf higher than last year at this time and 215 Bcf above the five-year average of 3,717 Bcf. At 3,932 Bcf, total working gas is above the five-year historical range.
For information on sampling error in this report, see Estimated Measures of Sampling Variability table below.

Note: The shaded area indicates the range between the historical minimum and maximum values for the weekly series from 2019 through 2023. The dashed vertical lines indicate current and year-ago weekly periods.
+++++++++
The U.S. Energy Information Administration (EIA) on Thursday reported an injection of 69 Bcf natural gas into storage for the week ended Nov. 1. The result, slightly above median expectations, kept futures lower on the day.
NG small gapped higher on the open and continues to build on the gains as weather forecasts are turning less mild. Still above average temps but LESS above average and closer to normal.
This is bullish from a relative standpoint.
8am: This was the last 0z European model run, in purple on the left.

Continuation of the MUCH LESS mild forecast back to average HDDs which is BULLISH compared to MUCH MILDER than average:
The last 0z European model HDDs are on the left in purple. Green is the average which is ramping up in November. Note the purple line catching up to average late in the period.
Natural gas futures were lower early Tuesday as the market latched onto near-term bearish weather outlooks thwarting the arrival of colder weather and ongoing restraint by producers that drove prior-day gains.
++++++++++++++++++++++++++++===
This is one of those times when the so called experts reporting on natural gas.......HAVE NO IDEA WHAT THEY ARE TALKING ABOUT!
NG gapped higher and is even higher now because of the PATTERN CHANGE to MUCH LESS mild weather.
Hey Mike,
I looked at 2m anomaly maps for today’s 12Z Euro ens and compared them to those from the 0Z run. Per my eyeballs, my educated guess is that US pop wted HDD on the 12Z vs 0Z runs did this:
- higher for Nov 21-24
- lower for Nov 25
- full run of 12Z significantly more HDDs
Please tell me if this guess is correct. TIA.
Hi Larry!
I've been with my Dad much of the time the last 4 days and not posting or responding as much.
You must have been looking at something much different because the actual HDDs don't match up well with your description.
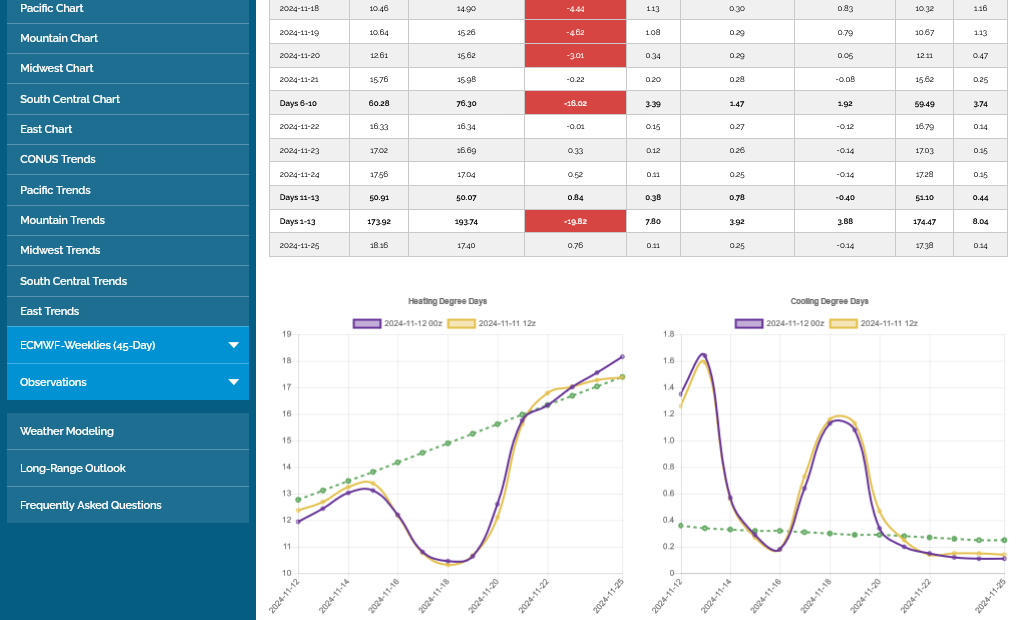
12z run below in purple on the left for HDDs.
Overall they were -4.4 HDDs vs the previous 0z run and not higher.
These were the last 4 runs of the GEFS. The coldest was last nights 0z run. The warmest was todays 12z run.
We can see HDDS are actually a bit ABOVE average late in the period because of a negative NAO|AO.

Larry,
Your observations of the pattern being colder than the modeled HDDs, although leading to a wrong guess on the HDDs it could mean that you are actually better, more skilled than the modeled HDDs.
im dead serious.
This skill at pattern recognition is what makes for the best meteorologists.
Any Tom, dick or Larry can regurgitate numerical output from a model with no skill other than being able to add and subtract as well as an elementary school aged child.
however, the models ALL have crystal clear bias.with certain patterns, like a —NAO OR —-AO in the Winter, the models will not be cold enough.
The most astute forecasters and traders use that to OUTPERFORM THE MODELS.
Ive commented,on your elite observation and analytical skills here over a dozen times. I’m also looking at this same pattern AND SO IS THE MARKET.
WE SHOULD NOTE THE GAP HIGHER OPEN ON SUNDAY NIGHT is MUCH GREATER THAN WHAT ONE WOULD THINK LOOKING AT THE FORECAST.
I attribute at least part of that as astute traders with your skills to out predict the models by looking at the pattern.
The pattern can change can go back to milder of course and you, me and the market reaction can all be wrong because of the amount of chaos and change in weather forecasting but I’m weighting part of the disparity between your guess and the models numerical HDDs is your edge/insight that sees patterns with skill,
.
This last EE was +2,4 HDDS VS the previous one.
i consider the rapidly dropping NAO and AO along with building heights aloft in Canada and dropping off the Northeast coast to be a teleconnection/couplet which is favorable for cold in high latitudes to be transported south to the middle latitudes…..more than models can forecast accurately.
This is the complete opposite of the long lived very mild recent,pattern which has repeatedly not been warm nough in the forecast.
I'll illustrate this with the NAO index graphed. Usually, the more negative that NAO is, the colder the Midwest and East are in the Winter. A week ago, the NAO was not predicted to be this negative. The result of this unexpected drop has equated to the MUCH greater HDDs than the models thought.
The rapidly falling NAO usually comes first, then the models catch up to the magnitude of chilly weather. Right now, the index is predicted to go back up towards 0 at the end of the period, so it would be a transient/temporary --NAO(2 standard deviations below average) . At the end of the period, all the solutions/members of the model(in red) really increase the NAO but with a wide range from almost +2 to -2.
https://www.cpc.ncep.noaa.gov/products/precip/CWlink/pna/nao.shtml

This was the last 0z EE at +2.4 HDDs vs the previous 12z run. We should note temps for several days are actually colder than average, something that contrasts greatly with the near record warm/mild weather.
The new run comes out in several hours but I will be with my Dad at his assisted living home until late today.

The last 0z EE was -5 HDDs vs the previous 12z run.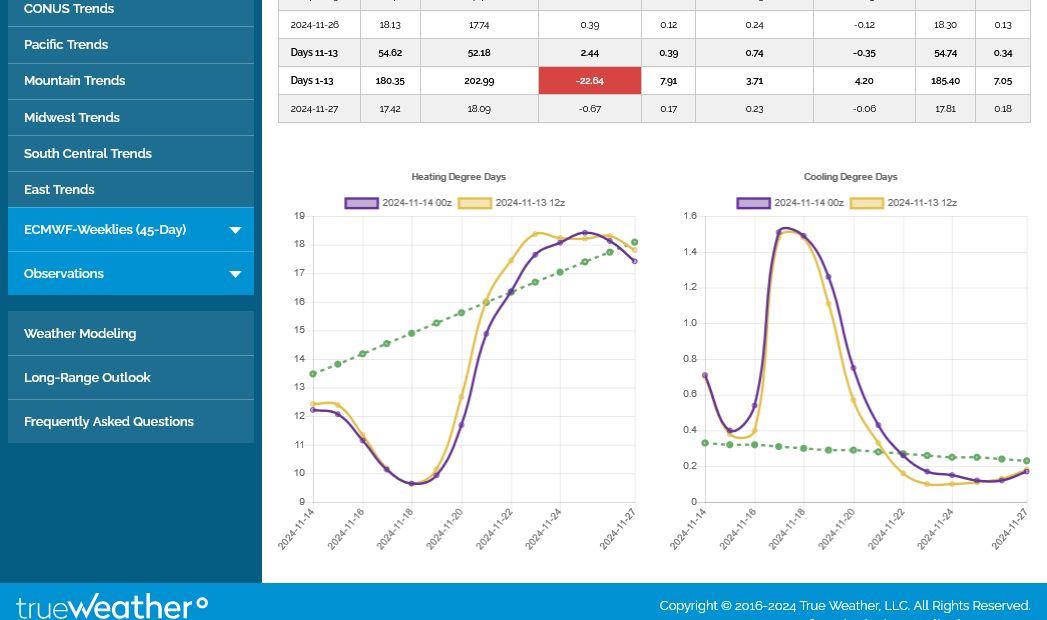
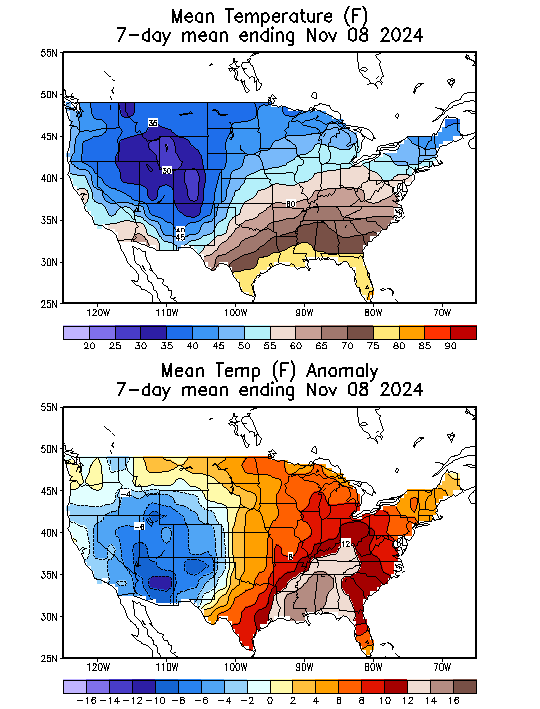
Extremely mild/bearish weather last week for many key, high population, residential demand areas(to burn natural gas for heating their homes).
So the EIA should be an unusually large injection for November(which starts the withdrawal season)
https://www.cpc.ncep.noaa.gov/products/tanal/temp_analyses.php
+++++++++++
metmike: Another gain in storage vs the 5 year average from mild weather. The blue line is +228 Bcf above the average(+13 Bcf compared to last week) and now, once again is HIGHER than the 5 year range. Higher than any of the last 5 years and near record levels at the end of the injection season.
for week ending November 8, 2024 | Released: November 14, 2024 at 10:30 a.m. | Next Release: November 21, 2024
| Working gas in underground storage, Lower 48 states Summary text CSV JSN | |||||||||||||||||||||||||
|---|---|---|---|---|---|---|---|---|---|---|---|---|---|---|---|---|---|---|---|---|---|---|---|---|---|
| Historical Comparisons | |||||||||||||||||||||||||
| Stocks billion cubic feet (Bcf) | Year ago (11/08/23) | 5-year average (2019-23) | |||||||||||||||||||||||
| Region | 11/08/24 | 11/01/24 | net change | implied flow | Bcf | % change | Bcf | % change | |||||||||||||||||
| East | 942 | 934 | 8 | 8 | 929 | 1.4 | 916 | 2.8 | |||||||||||||||||
| Midwest | 1,143 | 1,130 | 13 | 13 | 1,113 | 2.7 | 1,101 | 3.8 | |||||||||||||||||
| Mountain | 290 | 290 | 0 | 0 | 255 | 13.7 | 225 | 28.9 | |||||||||||||||||
| Pacific | 312 | 310 | 2 | 2 | 290 | 7.6 | 281 | 11.0 | |||||||||||||||||
| South Central | 1,286 | 1,267 | 19 | 19 | 1,229 | 4.6 | 1,223 | 5.2 | |||||||||||||||||
| Salt | 349 | 341 | 8 | 8 | 327 | 6.7 | 327 | 6.7 | |||||||||||||||||
| Nonsalt | 937 | 926 | 11 | 11 | 902 | 3.9 | 897 | 4.5 | |||||||||||||||||
| Total | 3,974 | 3,932 | 42 | 42 | 3,816 | 4.1 | 3,746 | 6.1 | |||||||||||||||||
Note: This report, for the week ending November 8, 2024, will be the last report EIA publishes using the current sample. As previously announced, on Monday, November 18, 2024, at 3:00 p.m., EIA will revise estimates for the eight weeks covering September 20, 2024, through November 8, 2024, to gradually phase in the estimates from the new sample. For additional information, please see the notice of changes to the WNGSR. Totals may not equal sum of components because of independent rounding. | |||||||||||||||||||||||||
Working gas in storage was 3,974 Bcf as of Friday, November 8, 2024, according to EIA estimates. This represents a net increase of 42 Bcf from the previous week. Stocks were 158 Bcf higher than last year at this time and 228 Bcf above the five-year average of 3,746 Bcf. At 3,974 Bcf, total working gas is above the five-year historical range.
For information on sampling error in this report, see Estimated Measures of Sampling Variability table below.

Note: The shaded area indicates the range between the historical minimum and maximum values for the weekly series from 2019 through 2023. The dashed vertical lines indicate current and year-ago weekly periods.
Natural gas is getting crushed today, especially after the bearish EIA report but this is NOT a bearish weather model solution......the 12z Canadian model.
There is some cross polar flow feeding air from Siberia into Canada, so air masses coming out of Canada will be COLD.
https://weather.gc.ca/ensemble/charts_e.html?Hour=384&Day=0&RunTime=12&Type=gz
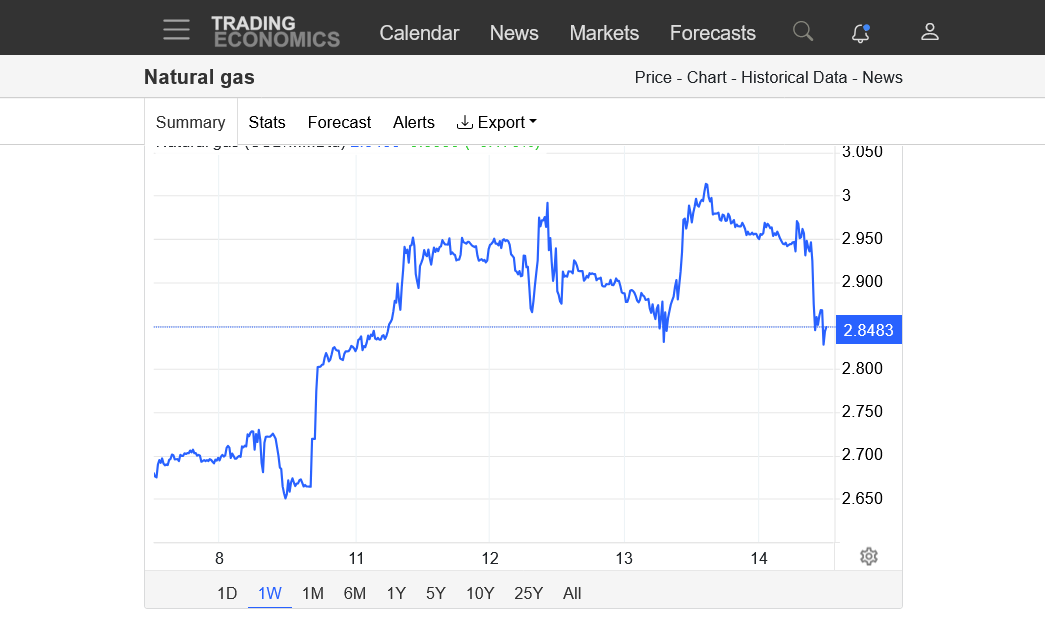
The bullish gap higher on Sunday Night from this colder weather pattern change remains wide open but we are getting close to the top of the gap and lows for the week, which is just above 2.8
MAKE THAT 2.77
https://tradingeconomics.com/commodity/natural-gas
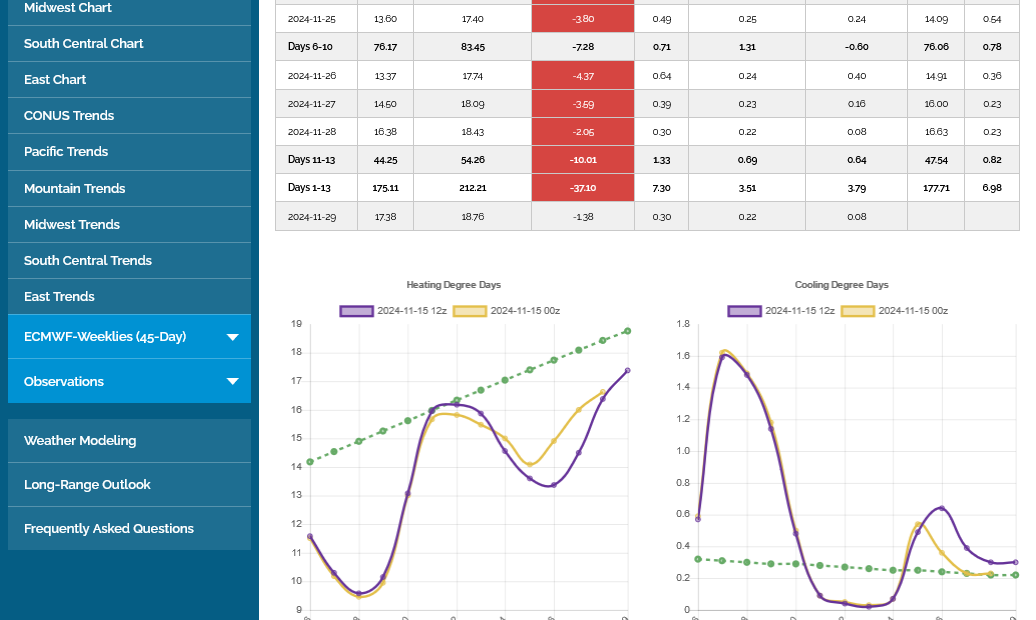
This last 12z GEFS in purple on the left, was a whopping -8 HDDs vs the previous run.

The last EE was also much milder so prices are continuing to be under pressure.
11pm: we are getting close to filling the gap higher on Sunday night.
NG was at last check up slightly (1%) vs 1:30PM CST close yesterday but only after a 6% drop yesterday largely it appears due to the warmer late week 2 on the 12Z model runs. I’m not seeing anything colder today late in the runs. Late week 2 still looks pretty bearish to my eyeballs with zonal flow after the chill of ~11/21-26. So, the ~1% rise looks to me to be dead-cattish unless some of the earlier days are a little colder?
Mike, what say you?
Edit 11:54AM CT: then late in 15 day Euro op, which has virtually no credibility, a new Canadian high comes down and at least seemingly to me lead to a further bounce of NG.
Hi Larry,
been with dad all day and I Look forward to checking on this tonight.
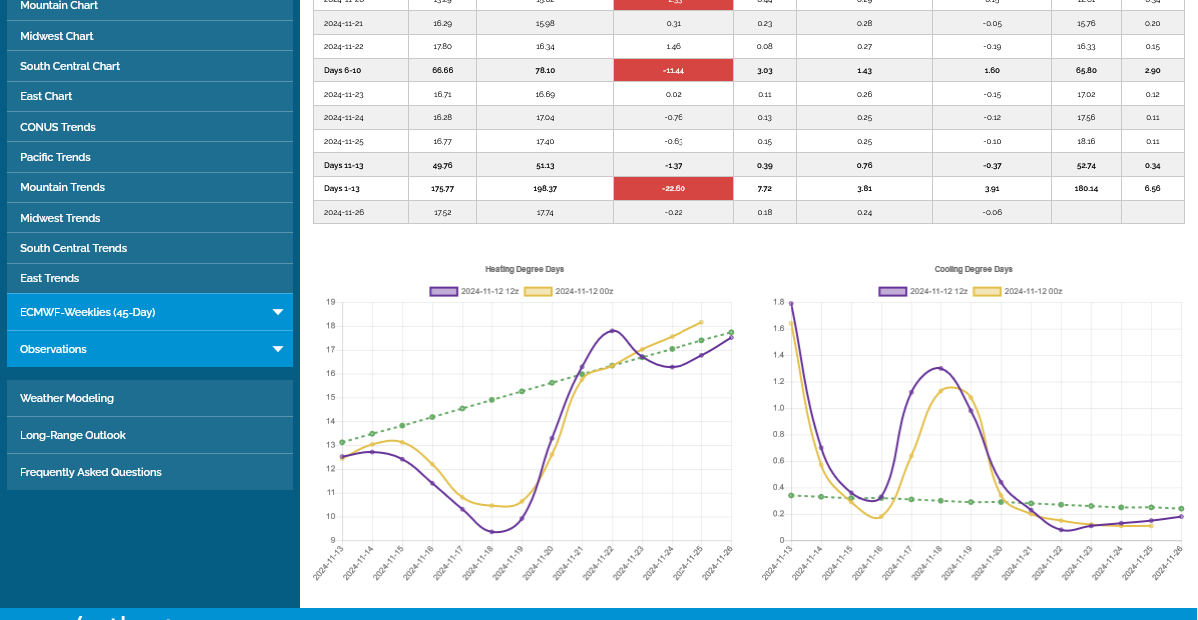
Larry, the 12z EE in purple on the left was -2.6 HDDs vs the previous 0z EE and bearish.
++++++++++++
The tricky thing about this MILD ZONAL upper level/jet stream flow is that colder air masses at the surface coming down from Canada will be UNDERCUTTING the upper levels and tracking into the US.
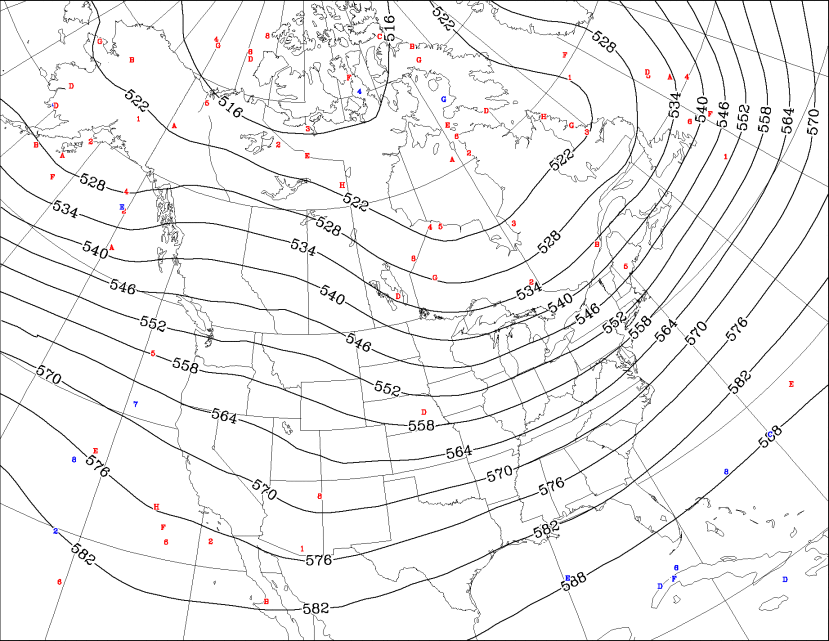
Note the flow coming from the 510, 516, 522, 528 height levels is actually originating in Siberia and tracking across the Arctic then dumping the cold into Canada!
https://weather.gc.ca/ensemble/charts_e.html?Hour=384&Day=0&RunTime=00&Type=gz

Cold Arctic surface highs like we see below will be pushing from Northwest Canada southward into the Midwest:
https://weather.gc.ca/ensemble/charts_e.html?Hour=384&Day=0&RunTime=00&Type=gz

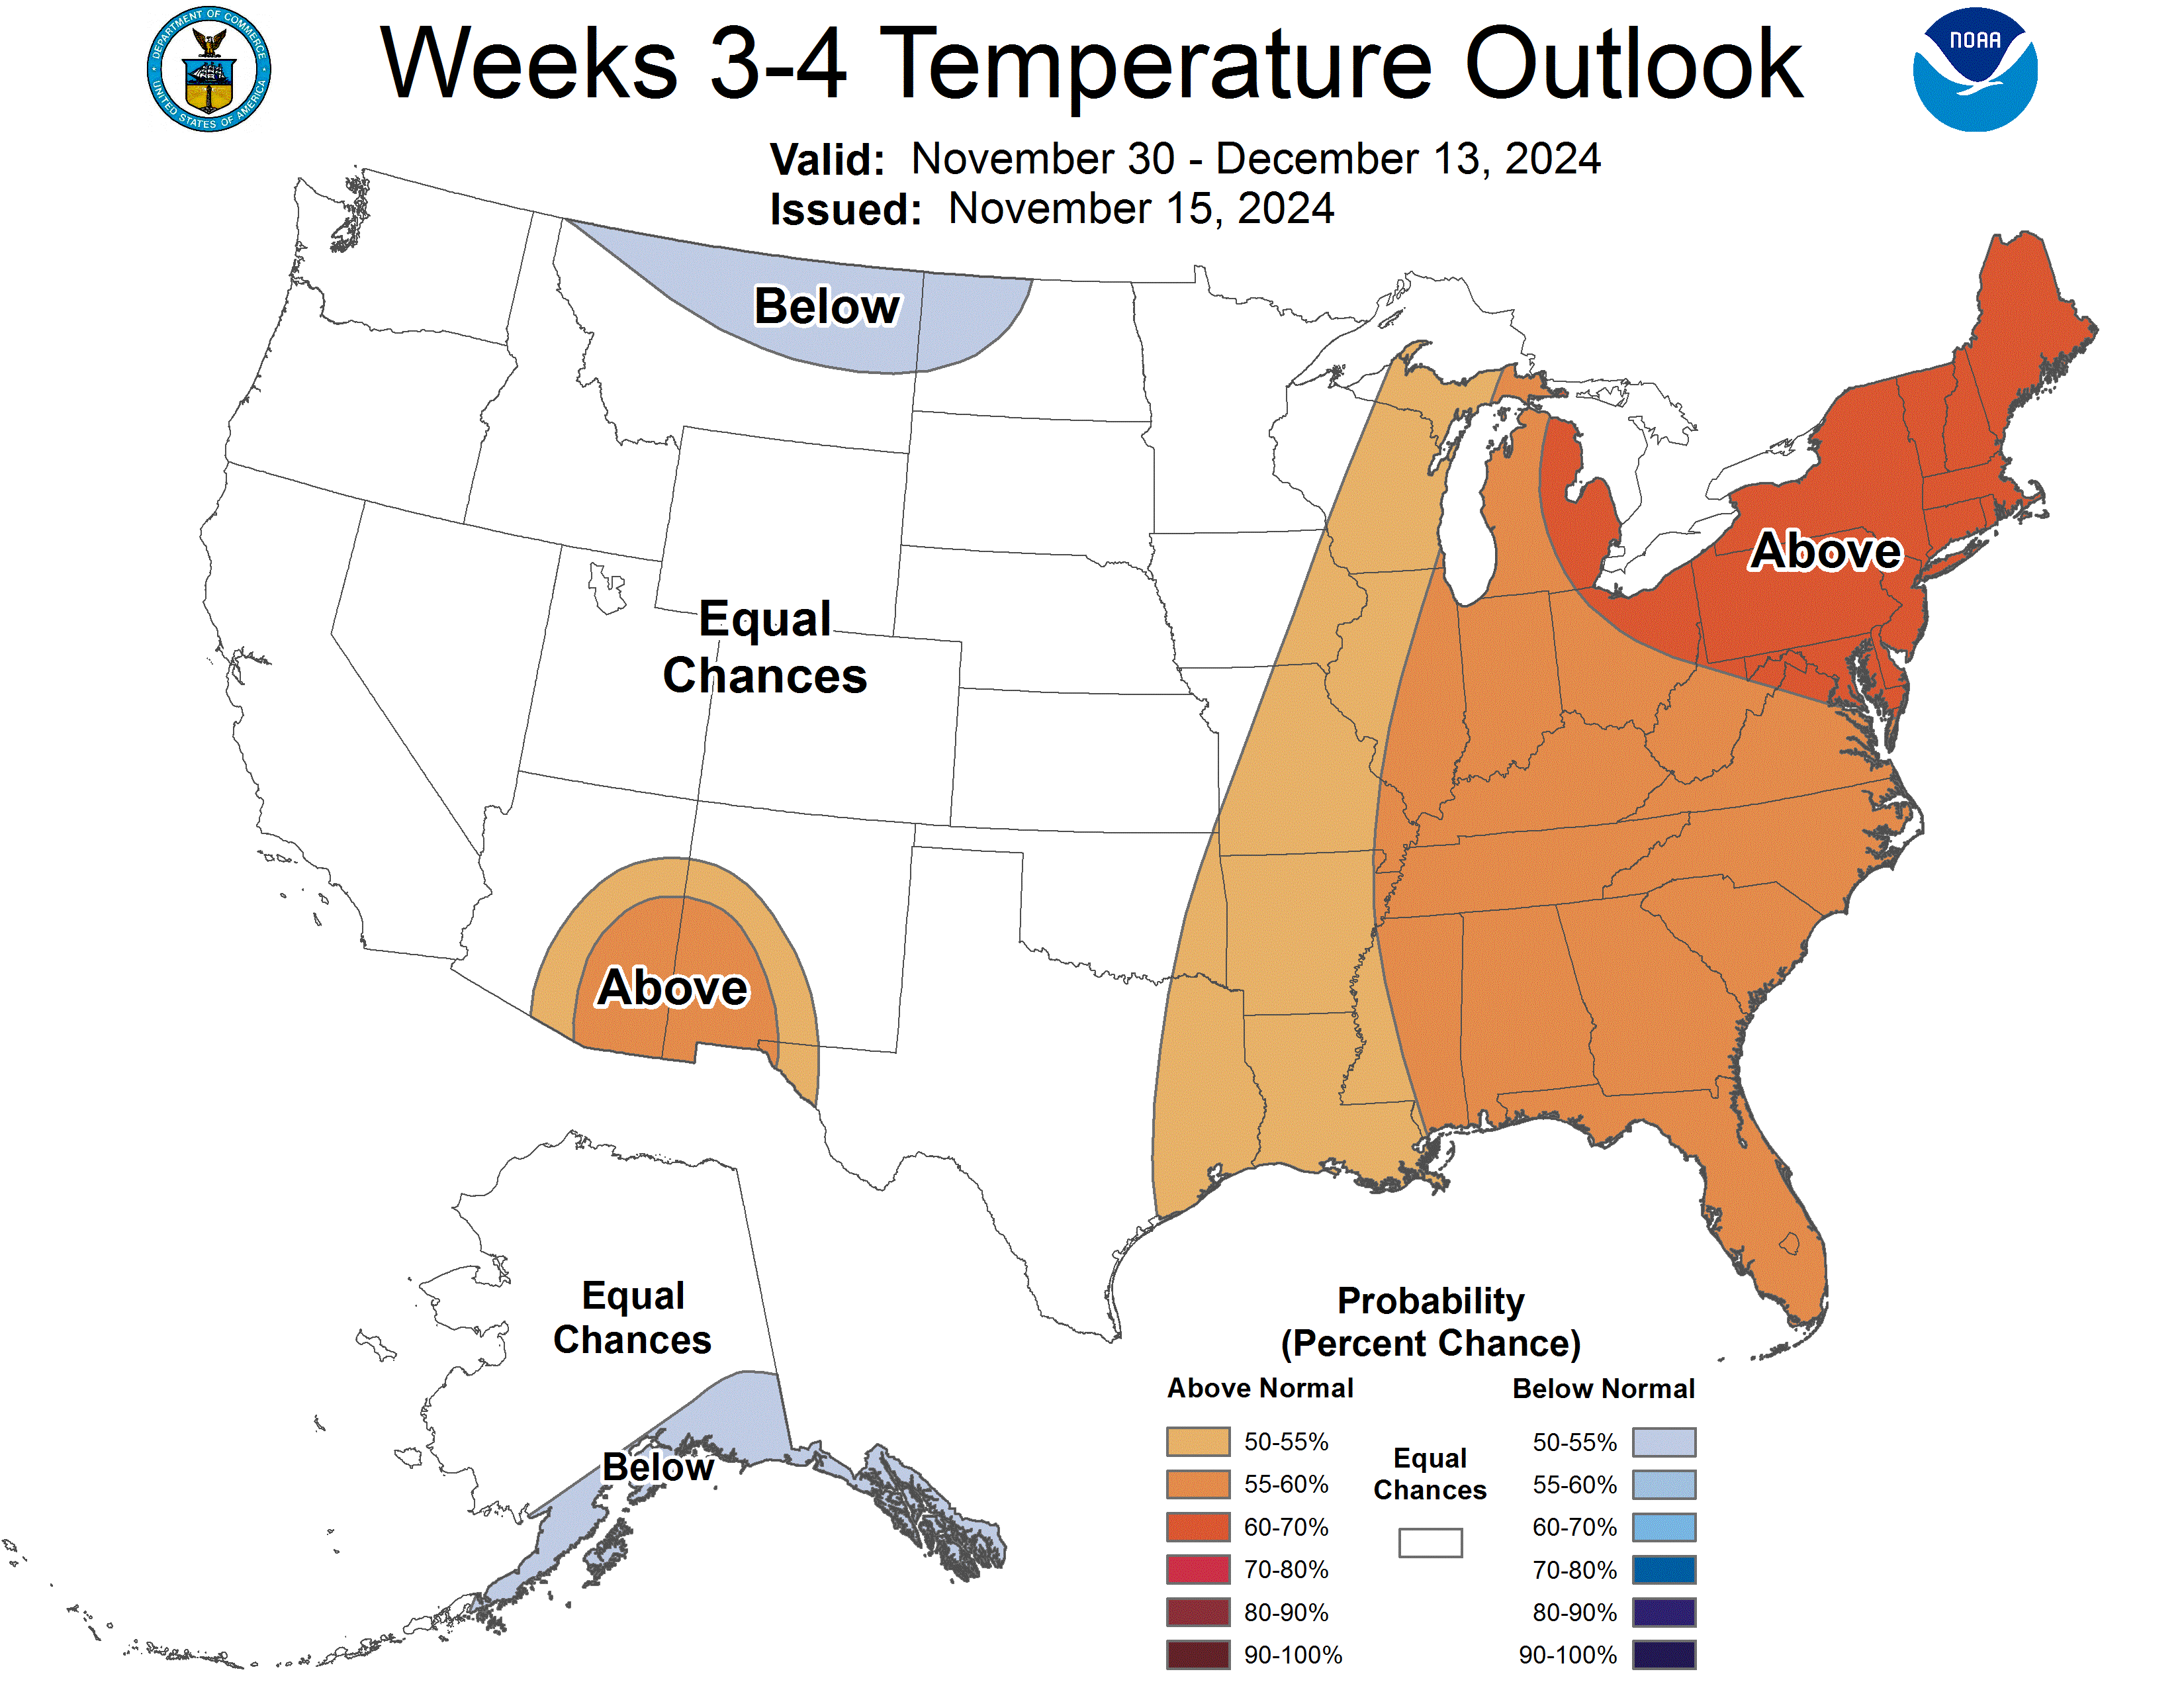
Low skilled weeks 3-4. Bearishly mild in many of the high population centers so that demand for residential heating via burning natural gas will be lower than average.
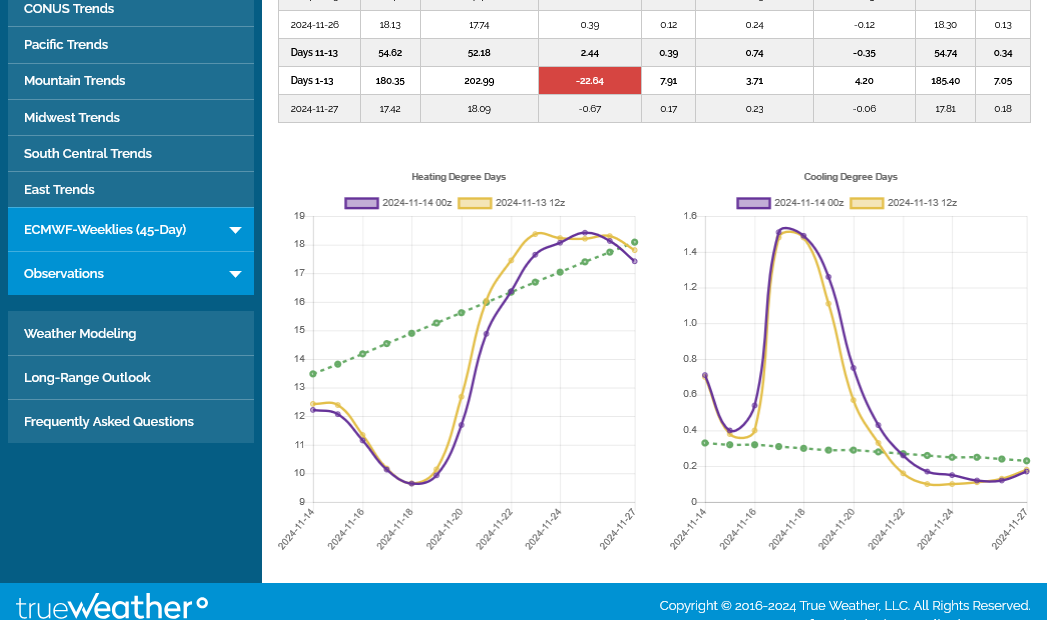
Hey Mike,
Wow, the EE HDDs for 11/23-7 dropped a lot between 0Z of 11/14 run and 12Z of 11/15 run:
11/14 0Z: all were 17.4+ and total was 89.5
11/15 12Z: all were sub 16 with 11/26 being lowest at 13.4 after that day had 18.1 just 3 runs prior! Total dropped from 89.5 (avg of 0.5 AN/day) to 72.1, a drop of 3.5/day to avg of 3.0 BN/day! Thus it’s surprising NG was up slightly today even with the 6% drop yesterday:
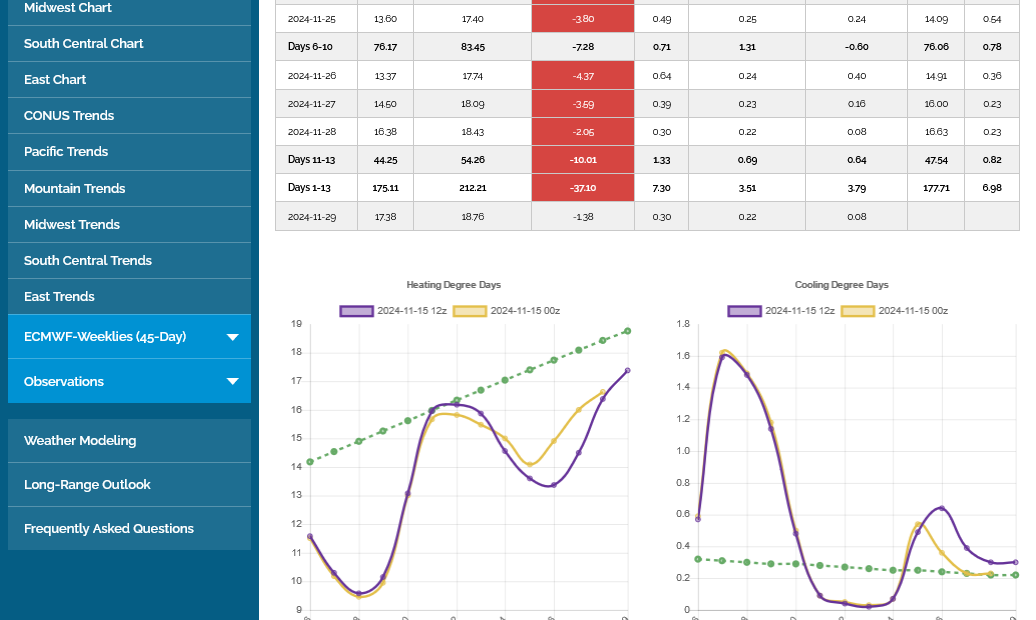
***Edit: Mike, would you please post the 0Z/12Z EE HDD? I’m curious especially about 11/23-27 after how drastically they warmed. I want to see if that’s going to be a pattern this winter, similar to other recent winters (i.e. cold bias that is revealed as one gets closer). TIA
You got it, Larry when I get back from dads later today.
No rush. Just whenever you’re able to get to it, if you can post the then latest EE showing the daily forecasted HDD I’d appreciate it. I’m especially harping on 11/23-7 because it had already fallen so much. I’m concerned about a continued cold bias from models that has been pretty dominant over the last 7-8+ years in the E US. TIA
Sorry it was a bit later than promised, Larry! Was tied up trying to do chess sign up stuff at Dad's last night and forgot.
You sound like somebody that's short natural gas!
The last EE was +5.5 HDDs 
There are some indices and teleconnections that suggest a COLDER outcome than the current forecasts, especially in light of the weak La Nina mode of the atmosphere, with the northern stream having some impact.
But its not very definitive and Pacific flow could be stronger than expected and spread milder air in instead.
https://www.marketforum.com/forum/topic/83844/#83856
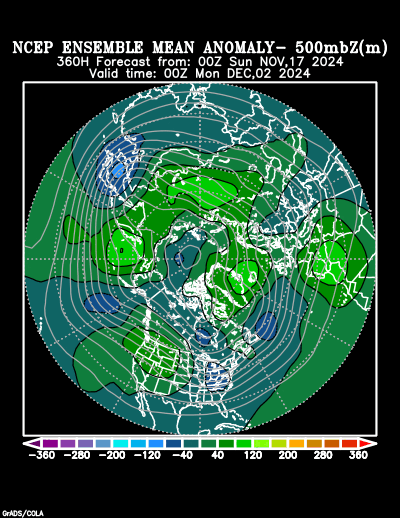
Ridge West/trough East?
Potential Greenland block?
Again, that's NOT my forecast but just the potential COLDER solutions.
Technically, we closed the gap higher from Sunday night and than some lower, marking a bearish, gap and crap buying exhaustion formation on the charts but came roaring back on Friday to close just above the gap.
this negated the gap and crap formation.
So tje bulls and bears are having quite a battle here.
Thanks, Mike! No worries of course as Dad always should come first by a mile!
I sound like it but I actually haven’t traded any commodity in several years. I just think it’s important to follow the bias of the wx forecasting models, especially with the pronounced cold bias of many years. The Canadian ens has actually had the largest and most consistent cold bias by a good margin, but the EE and GEFS have themselves had a significant cold bias. But I realize these cold biases are only based on averages and are far from the case for all runs. Many more runs have verified too cold vs too warm but obviously they sometimes do verify too warm.
To recap, the Fri 11/15 12Z EE had 72.1 HDD for 11/23-7, which was a drop from the 89.5 HDD of the Thu 11/14 0Z EE.
Per what you just posted:
-Sat 11/16 12Z EE had ~72.6, about same as Fri 11/15 12Z.
-11/17 0Z EE rose back some with ~75.3 though that’s still much lower than the 89.5 of the Thu 11/14 0Z run.
I appreciate that information, Larry because I didn't know this. Had no idea, in fact.
This last 12z Canadian model (1st to be updated) looks pretty mild.
https://weather.gc.ca/ensemble/charts_e.html?Hour=384&Day=0&RunTime=12&Type=gz
I learned a lot of this from when I was a client of an energy usage wx forecasting firm which often did analyses that clearly showed ensemble mean biases.
NG is up ~4%. I’m assuming this is due to the GEFS and EE having BN in the E US late unlike how they looked on Friday at 12Z.
Mike, what say you?
A couple of things, Larry.
This was the last EE. -4 HDDs vs the previous run. Bearish because of milder wx for individual days in week 2. However, look at the direction of the lines on the left in week 2. UPWARDS! The pattern is getting COLDER on all the runs. On the last run, actually getting colder than average on the last day.
This very much relates to 3 items that I've mention in the last several days.
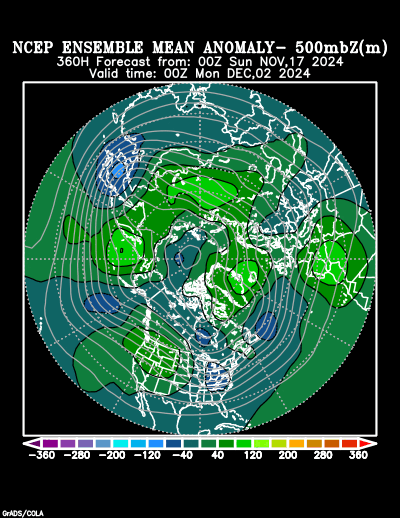
Here's the last 18z GEFS 500mb chart to illustrate those things:
1. Cross polar flow from Siberia on the other side of the northern hemisphere, across the Arctic into northwest Canada. This is going to dumps loads of frigid air into Canada and cold fronts coming from Canada and crossing into the US will be very cold.
2. Ridging West and troughing East teleconnection or couplet
3. This one isn't as obvious but a Greenland block potential, with upper level positive anomalies around Greenland above upper level negative anomalies in eastern North America.

This shows #3 much better:

Thanks, Mike.
I just posted this elsewhere (at a wx rather than trading site):
Here’s a better illustration of a main reason why NG has been up this evening, which is interesting: it’s because the 12Z 11/17 EPS (purple) is coldest at the end, Dec 1st, with 20.4 HDD & rising. However, keep in mind that 11/23-7 total HDD are down to only 71 vs 89.5 on the Thu 11/14 0Z run, when NG was about where it has been this evening. Check out 11/26: it’s only at 12 on the 11/17 12Z, which is a whopping 6 BN and the normal for 11/10, 16 days earlier. On the 11/14 0Z, it was way up at 18.1 or near normal!
This is the nature of these cold biases. They’ll often be too cold late in week 2 and then get back to reality and warm up as those days get closer. Back on 11/14, 11/23-27 were out 9-13 days. Now that these days are only out 6-10, they’ve warmed substantially. They don’t always do that, of course. But they tend to do that more than the opposite (nature of cold bias).
If I were a betting man, I’d bet based on the cold bias that Dec 1st will end up verifying lower than 20 HDD. Of course it may not but the odds favor that (due to cold bias). Also, even though I’m not trading commodities, I’m guessing that NG will be lower than it is now by morning. That’s partially because 11/23-7 are so much warmer than they were as of 3 days ago. But that’s just a guess. If the overnight GEFS/EPS runs turn out cold enough especially late, NG probably wouldn’t turn down in the morning and may even rise further.

Here’s what my eyeballing the 2m temperature anomalies tell me:
-0Z EE overall likely significantly fewer HDD vs prior run although still hitting highest point at the end
-0Z GEFS: likely higher HDDs many of earlier days but also likely significantly fewer late days; could be a near wash for total vs 18Z; still tries to approach a max at end though not sure it gets there
-Because forecasted 2 week HDDs will probably be lower in the morning forecasts based on these models vs late last week and with NG currently still up 3% (though was +4% earlier), I’m wild guessing that NG will be lower than it is now (2.91) within ~6 hours. But this is NOT a trade recommendation and I’m not even trading.
Looking at TT EE at H5 and 2M: one can see the huge difference between the 0Z 11/14 run and the 12Z 11/17 run on 11/26:
1) a) 0Z 11/14 EE for 11/26 at H5: conducive H5 flow allowing CDN air to dominate E US
1) b) 0Z 11/14 EE for 11/26 at 2m: BN dominates east resulting in 18 US HDD:
Now compare those to the 11/17 12Z EE
2) a) 12Z 11/17 EE for 11/26 @H5: sig. SE ridge
2) b) 12Z 11/17 EE for 11/26 @2m: AN instead of BN dominates east resulting in only 12 US HDD, which is normal for way back on 11/10:
Thanks much, larry!
Like you demonstrated......AND NG IS LOWER SINCE THIS CAME OUT LIKE YOU PREDICTED.
Definitely milder on the 0z EE IN PURPLE vs the previous 12z EE based on almost every day being a tad milder and adding up to -9.4 HDDs for the period. But the same colder pattern is evolving late in the period.
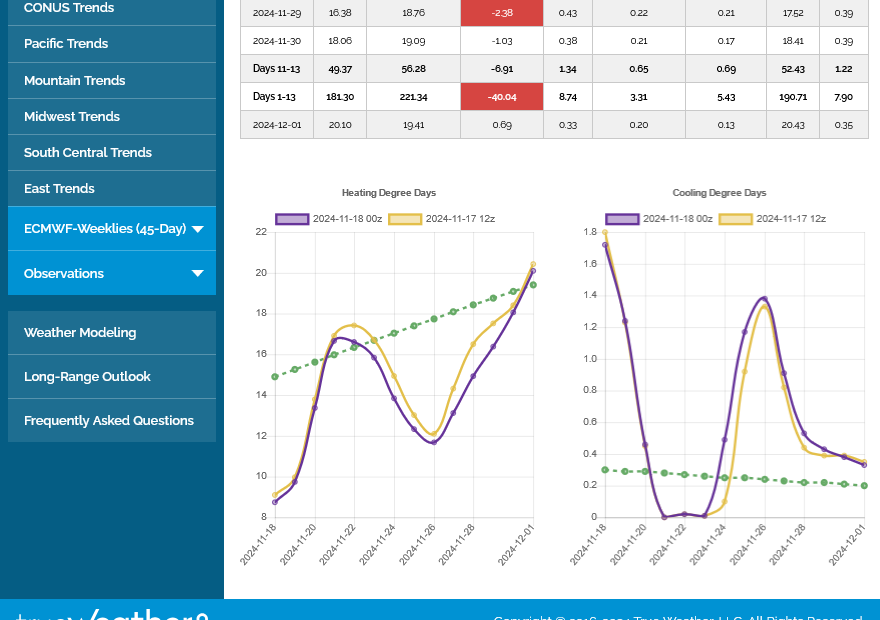
The last 360 hour 0z EE solution for 500mb below,

This last 6z GEFS in purple is actually +3 HDDs vs the previous run and +5 HDDs vs the 12z run with COLDER individual days. So its the opposite as the EE, while they both show a pattern morphing to colder late in the period:
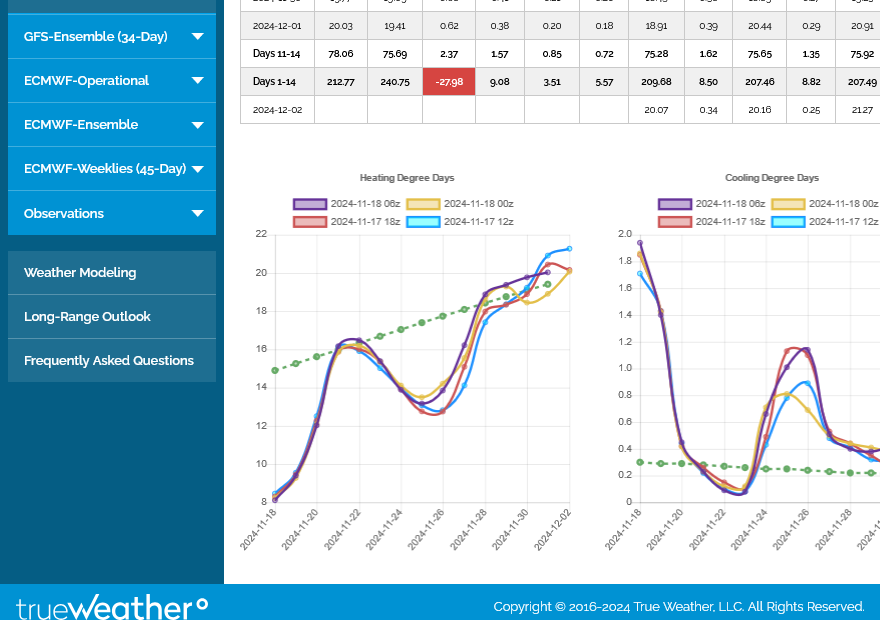
This is a pretty cold PATTERN below because of the cross polar flow dumping cold into Canada, so cold fronts coming into the US have a source region with very cold air:
500mb below for Dec 1

850 temps for Dec 1 below on the last 6z GEFS. Note the tightly packed isotherms dropping into the eastern half of the US with some very cold air.
So far, we haven't been able to completely fill the large gap higher on the Sunday night open compared to the Friday pm close. Looks like its around 2.84 and the low has been 2.857. We are just over 1,000/contract LOWER than the highs on Sunday evening....ok, bouncing a bit higher from that and holding the gap because of the COLDER overall pattern.
https://tradingeconomics.com/commodity/natural-gas

7:15 am update:
We're back close to the price from when the milder EE was released because of the colder PATTERN. We held the gap SO FAR. so its serving as an upside break away bullish gap higher until its filled. Supplies are near a record which is bearish but the weather forecast is KING!
IF/WHEN we fill the gap, then it becomes a bearish,gap and crap buying exhaustion signature on the price charts.
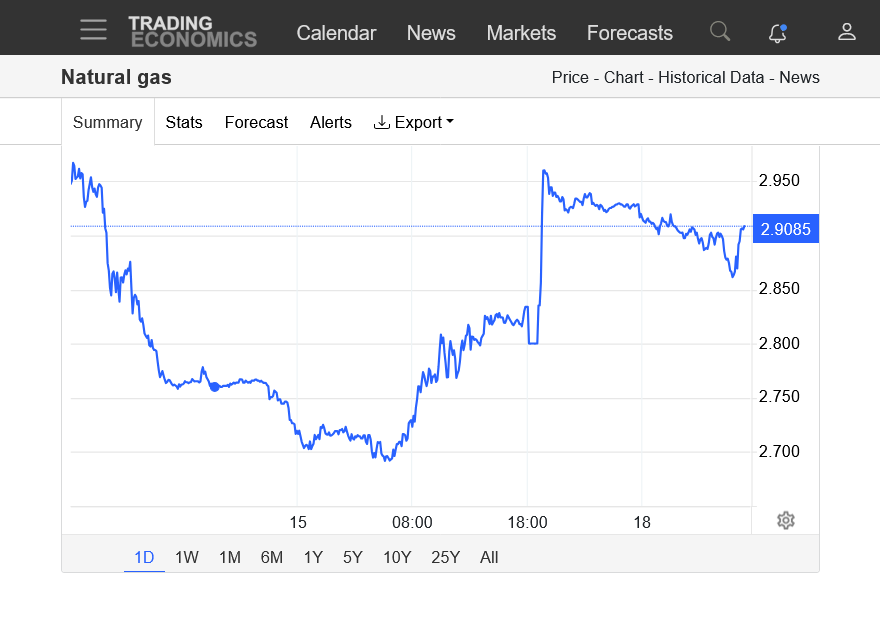
8am: we just spiked down and filled the gap. Can we hold here? or was that a gap and crap buying exhaustion gap? WX forecasts will decide that. I'll be at Dads nursing home the rest of the day.
NG pricing appears to show a battle between the bulls focusing on the cold ends of the ensembles and the bears focusing on the warmer intermediate days/totals. As usual the 12Z ensembles will likely be the next price mover.
Hey Mike,
Looking at anomalies, it appears to me that the 10 HDD warmer 0Z EE was largely reversed, if not more, with today’s 12Z EE. NG responded bullishly. How much did the HDD rise on the 12Z?
Yes, you are correct, Larry! +6 HDDs on the 12z run vs the 0z run. It's like I've been saying, the upcoming pattern in week 2 is COLDER, regardless of changes in individual days from new models. 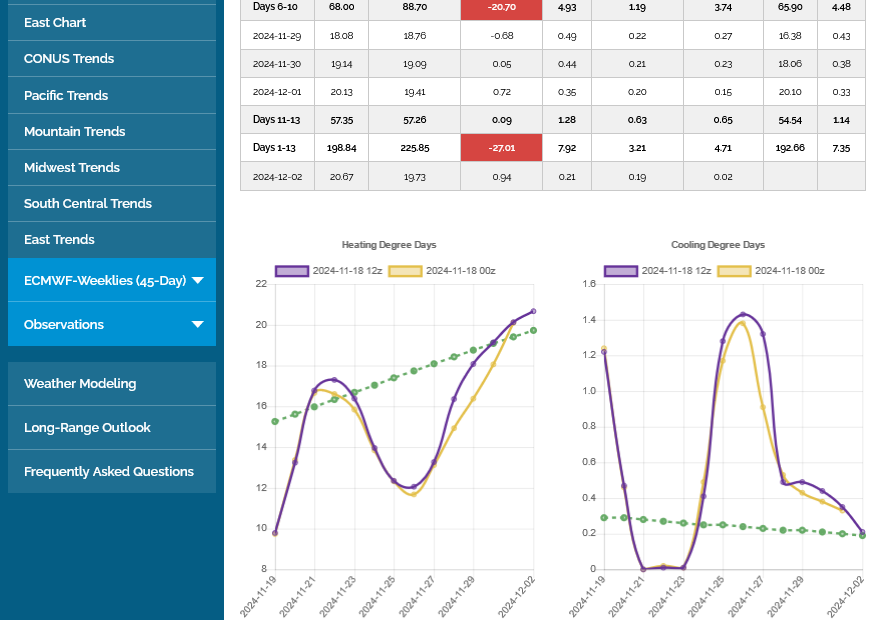
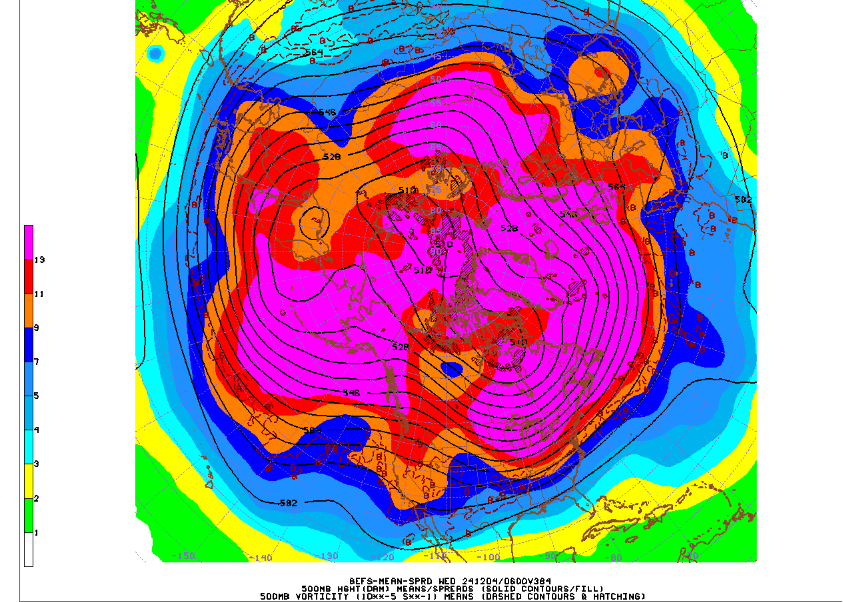
This was the 500 mb map on the last 18z GEFS.
1. Ridge West/trough East couplet. Bullish
2. Cross polar flow into Canada. Bullish
3. Active northern stream from Canada into the US. Bullish
Thanks, Mike!
I just posted this response at a wx bb after another poster posted this tweet by Raleigh pro met. Allan Huffman:
https://twitter.com/RaleighWx/status/1858606441759650001?
——————-
My response:
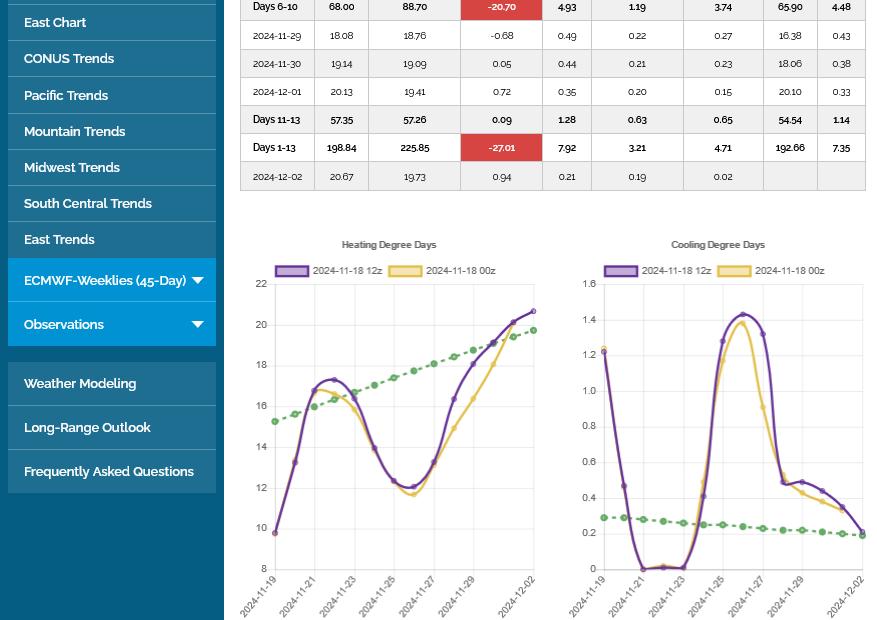
The left side of the image below shows the cooling of the 12Z EPS (purple) vs 0Z (yellow) by 6 HDD along with the coldest days being at the end, which helped NG to close in the higher portion of its session range (its lowest of session was before the 12Z models were released thanks largely to the then 10 HDD cooler Mon 0Z EPS vs Sun’s 12Z run).
Again, it will be interesting to see as said by Huffman above whether this next progged cold period gets muted like was the case with late 11/24-7 as a new SE ridge appeared seemingly out of nowhere. This underplaying of the SE ridge has been a forecast problem for years coincident with the very warm W Pac.
To reiterate: the 11/14 0Z EPS had 11/23-7 with 89 HDD. This 11/18 12Z run despite being cold at the end had only 68 HDD during 11/23-7, a whopping 4 degrees warmer per day (AN) vs the 11/14 0Z run’s BN! Will this later period eventually have the same fate? I hope not. Stay tuned!
**Edit 10:18AM CST:
Through the 0Z/6Z EPS/GEFS the colder late solutions are continuing. NG is up near multi-session highs as a result.
Update: PLEASE NOTE THESE MAPS ARE UPDATED DAILY. THE DESCRIPTION BELOW WAS FROM 11-19-24.
HERE ON 11-20-24 the maps already look much different.
++++++++++
Potential for EXTREMELY COLD pattern change for the reasons mentioned previously.
High latitude positive anomalies(Siberia/ Greenland) mid latitude negative anomalies. The NG market knows it which is why it won't go down/keeps going higher.
Ideal couplet for flushing cold from high latitudes to low latitudes.
GFS ensemble mean anomalies at 2 weeks.
https://www.psl.noaa.gov/map/images/ens/z500anom_nh_alltimes.html 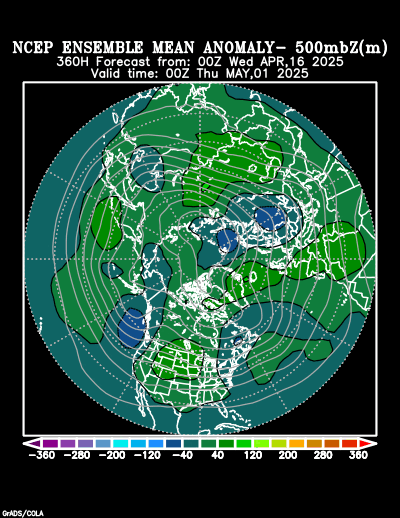
2 week 850 temp for ensemble mean anomaly
https://www.psl.noaa.gov/map/images/ens/t850anom_nh_alltimes.html
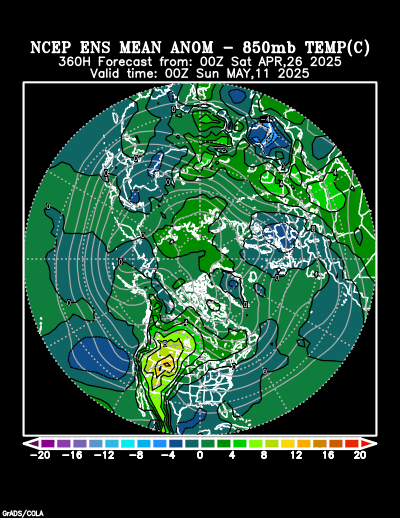
12Z GEFS/EE appear to my eyeballs to probably have little change in total HDDs vs their respective prior runs.
Thanks, Larry,
actually the 12z GEFS was +5HDDs and the EE was +3 HDDS.
However, NG SOLD OFF AFTER THAT. maybe buy the rumor sell the fact? above $3 is lofty pricing with the storage ABOVE the 5 year average and seasonals turning down.
The 11/17 daily EPO of +233 (the latest daily available), which was the highest daily since way back on June 4, will probably end up being the highest for quite awhile. Models are unanimous in dropping it very sharply to at or near the lowest daily of 2024 on 11/21 or 11/22 (~-250)! The consensus then has it remaining negative the rest of Nov fwiw. When combining the low point and duration of this upcoming -EPO, it could end up the most impressive since way back in Oct of 2023!
https://downloads.psl.noaa.gov/Public/map/teleconnections/epo.reanalysis.t10trunc.1948-present.txt
With the 0Z EE being colder in the E US overall vs the 12Z run on days 7-15, NG is up to session highs. The coldest in late in the run (early Dec) when it is much BN with a hard freeze implied in much of the E US on 1-2 mornings. It looks to me like there was quite a sizable increase in HDDs per my eyeballs.
This cold is being driven by a solid -EPO/-WPO.
Thanks much, Larry!
0z GEFS was actually -2HDDs and bearish. NG was on its lows for the session after that.
0z EE as you mentioned was colder. +10 HDDs bullish. NG spiked 1,000/contract in less than an hour while that was coming out.
Canadian model looks like the colder EE but individual solutions of each models ensemble members have an extremely wide spread.
They range from the Siberian express to Greenland blocking with high latitude positive anomalies to mid latitude negative anomalies=very cold, to mild, zonal Pacific flow.
wish I had more time To post. Spending most of it praying and singing hymns in my 99 year old dad’s room. He’s getting close to the end. He’s been an extremely devout Catholic his entire life.
A Quick Guide to Important Drivers of US Winter Weather Patterns
https://frontierweather.dtn.com/WinterClimateDrivers.pdf
++++++++++++++++++++
https://www.daculaweather.com/4_epo_index.php
 +++++++++++++++++==
https://www.worldclimateservice.com/2021/10/04/western-pacific-oscillation/
https://www.worldclimateservice.com/2021/10/04/western-pacific-oscillation/
During the negative phase of the WPO in wintertime, most of the lower 48 states are usually colder than normal. The exception is the Southwest which where winters are often warmer than normal (Figure 10).
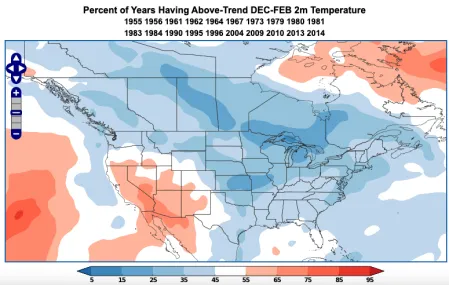
Thanks Mike!
NG is noting the overall colder GEFS/EPS so far today with it up a whopping 7%! Today’s high is the highest since way back in January per investing.com data!
0Z GFS has FIVE Canadian highs bring cold air down into the E US! That’s a relative rarity even for the GFS.
NYC gets not just one but two measurable snowfalls fwiw.
0Z: GEFS is even colder, quite possibly the coldest run yet. GFS/Euro are cold. Next up is EE.
NG up to session highs/up over 1% to highest since Jan!
Edit: EE is very cold, perhaps the coldest yet. NG is up even more to +3%!
6Z GEFS: another overall cold run
NG up 7%! It rose to its highest since Oct of 2023!
Thanks, larry!
Last very bullish 0z EE below.
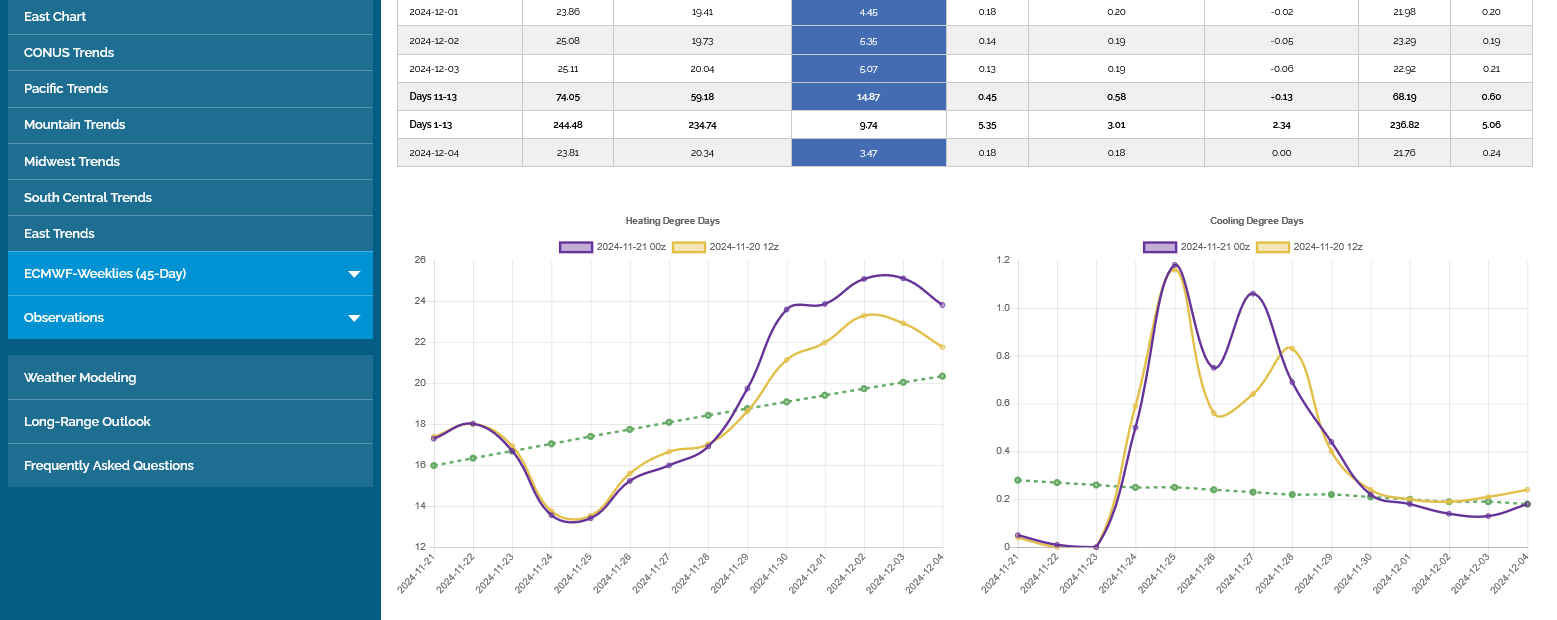
My Dad just passed but I will try to still post.
I spent the last 2 weeks praying with him and singing Catholic hymns to him all day.
Hey Mike,
I’m sorry to hear that your beloved father passed. You have been an amazingly great son and caregiver. It’s hard to imagine anyone greater.
He was blessed not only with a great son but his longevity of 99 years! May his memory be a blessing. May he rest in peace.
Hopefully you’re doing as well as can be expected considering the circumstances. May the Almighty bless your dad, yourself, and the rest of your family.
Continuing to post only when you feel like it and have time would likely be therapeutic for you. It has been for me since my brother passed.
Thanks much, Larry!
if I could have designed the last 2 weeks of his life it would have been exactly like this. Not 1 change.
He was one of the most amazing people God ever created.
ill have a tribute to him when i get the chance. I’m just waiting for the funeral home to get him while praying for him in his room.
i thought the last 2 weeks of crying and grieving, knowing this was coming had prepared me but when i walked into the room this morning, only hours after leaving it last night and saw his lifeless body it was the most traumatic moment in my 68 years.
Thanks again for your caring/understanding thoughts.
He said that what he wanted most at the end was to constantly pray and we did that all day long.
Mike I'm sorry for our loss of your father, God knows the best time for our souls to go to him. I continue to offer my roseries for him and your family.
Thanks, cutworm,
that means a lot. Driving home now. Mote to share soon.
Praying for comfort for you at this difficult time. His love for you was no doubt as strong as your love for him.
Thanks, bowyer!
A tribute to our Dad, Frank Maguire 9-16-1925 to 11-21-2024
10 responses |
Started by metmike - Nov. 22, 2024, 2:04 p.m.