
NG is down~7% from yesterday’s close. I don’t know why it is down sharply. Often that is a sign that the most recent EE/GEFS runs are warmer than prior runs in the E US especially on days 8-16, especially toward the end of the runs. But sometimes that can be due to other factors like lots of profit-taking after a huge runup that had actually occurred through yesterday. Also, yesterday had a weekly inventory report, which could have been bearish.
The latest GEFS/EE are still pretty solidly cold dominated through day 16/15 in the E US with E US troughing. Now are the runs not as cold as yesterday’s while still quite cold? Thats quite possible per my eyeballing some 2M temperature change maps. If that’s true after the huge runup in NG to 13 month highs yesterday, that could easily be all it took for lots of profit-taking, especially if inventory is on the relative high side.
Thanks much, Larry!
Back home for the rest of the month and trying to catch up but am thinking this may have been an extreme, overdone short covering spike higher because, like you stated, there's nothing milder today to justify a big move lower and what is turning out to be a huge REVERSAL DOWN.
More later.
Looking forward to your analysis, Mike!
NG opened up a whopping 7% this evening! With the ensembles still looking cold dominated, with no end yet in sight, and with NG having closed close to 7% off its highs on Fri, that actually isn’t a shock. So, now it is back up to near its Thu evening highs in the 3.50s.
I tried to buy natural gas just before the close on Friday with numerous attempts and market orders that didn't go thru for some odd reason.
I'm thinking that the margins have gone way up and my trading program wouldn't allow me to put on a position to hold over a weekend because of the increased margin requirements for the same number of contracts I can day trade. What a bummer on the open this evening, not being long.
Natural gas in storage is ABOVE the 5 year average. If it turns mild again, the price will crash hard!
https://ir.eia.gov/ngs/ngs.html
for week ending November 15, 2024 | Released: November 21, 2024 at 10:30 a.m. | Next Release: November 27, 2024
| Working gas in underground storage, Lower 48 states Summary text CSV JSN | |||||||||||||||||||||||||
|---|---|---|---|---|---|---|---|---|---|---|---|---|---|---|---|---|---|---|---|---|---|---|---|---|---|
| Historical Comparisons | |||||||||||||||||||||||||
| Stocks billion cubic feet (Bcf) | Year ago (11/15/23) | 5-year average (2019-23) | |||||||||||||||||||||||
| Region | 11/15/24 | 11/08/24 | net change | implied flow | Bcf | % change | Bcf | % change | |||||||||||||||||
| East | 931 | 943 | -12 | -12 | 922 | 1.0 | 909 | 2.4 | |||||||||||||||||
| Midwest | 1,140 | 1,141 | -1 | -1 | 1,117 | 2.1 | 1,094 | 4.2 | |||||||||||||||||
| Mountain | 293 | 291 | 2 | 2 | 255 | 14.9 | 224 | 30.8 | |||||||||||||||||
| Pacific | 313 | 312 | 1 | 1 | 295 | 6.1 | 281 | 11.4 | |||||||||||||||||
| South Central | 1,291 | 1,285 | 6 | 6 | 1,239 | 4.2 | 1,223 | 5.6 | |||||||||||||||||
| Salt | 347 | 346 | 1 | 1 | 331 | 4.8 | 328 | 5.8 | |||||||||||||||||
| Nonsalt | 944 | 939 | 5 | 5 | 908 | 4.0 | 896 | 5.4 | |||||||||||||||||
| Total | 3,969 | 3,972 | -3 | -3 | 3,828 | 3.7 | 3,730 | 6.4 | |||||||||||||||||
| Totals may not equal sum of components because of independent rounding. | |||||||||||||||||||||||||
Working gas in storage was 3,969 Bcf as of Friday, November 15, 2024, according to EIA estimates. This represents a net decrease of 3 Bcf from the previous week. Stocks were 141 Bcf higher than last year at this time and 239 Bcf above the five-year average of 3,730 Bcf. At 3,969 Bcf, total working gas is above the five-year historical range.
For information on sampling error in this report, see Estimated Measures of Sampling Variability table below.

++++++++++++
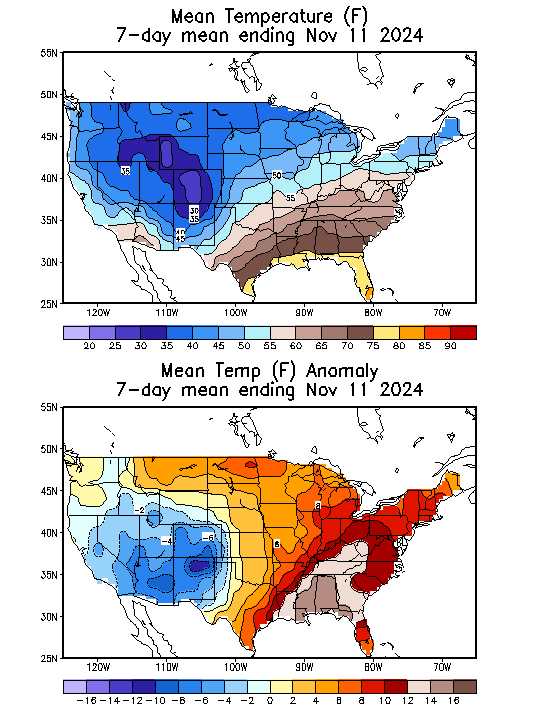
Temps for this Thursday's EIA: EXTREMELY MILD in the high population centers. So LESS demand for burning natural gas for heating homes.
https://www.cpc.ncep.noaa.gov/products/tanal/temp_analyses.php
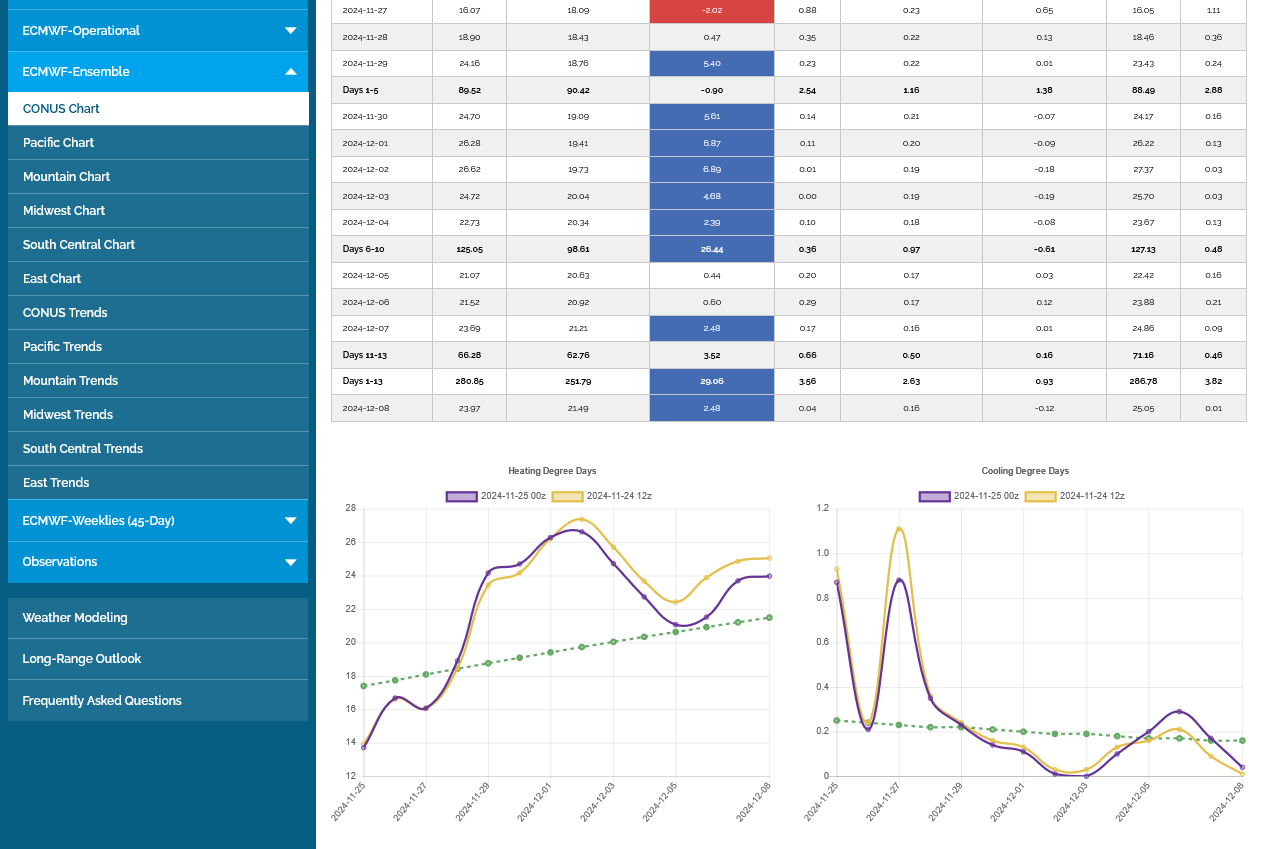
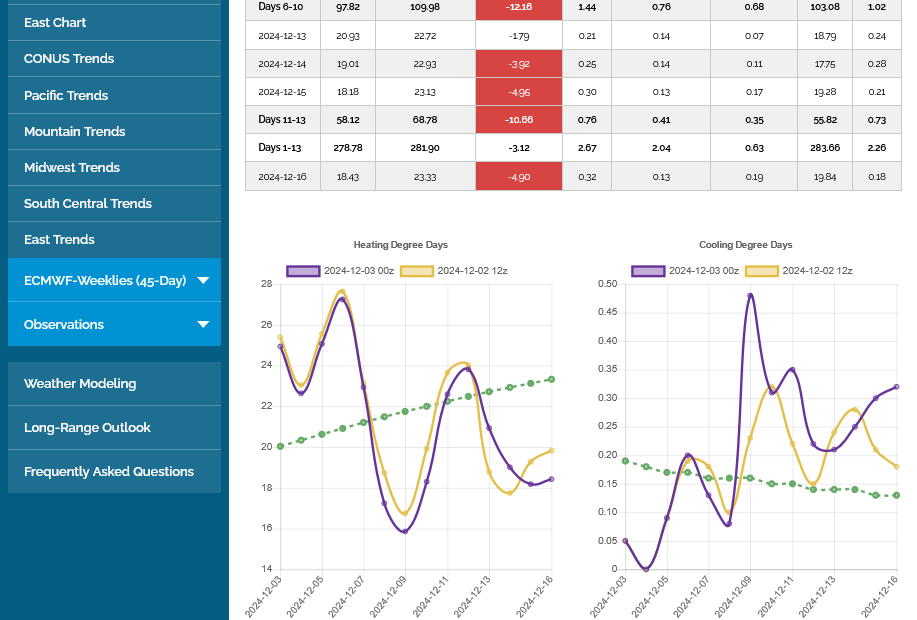
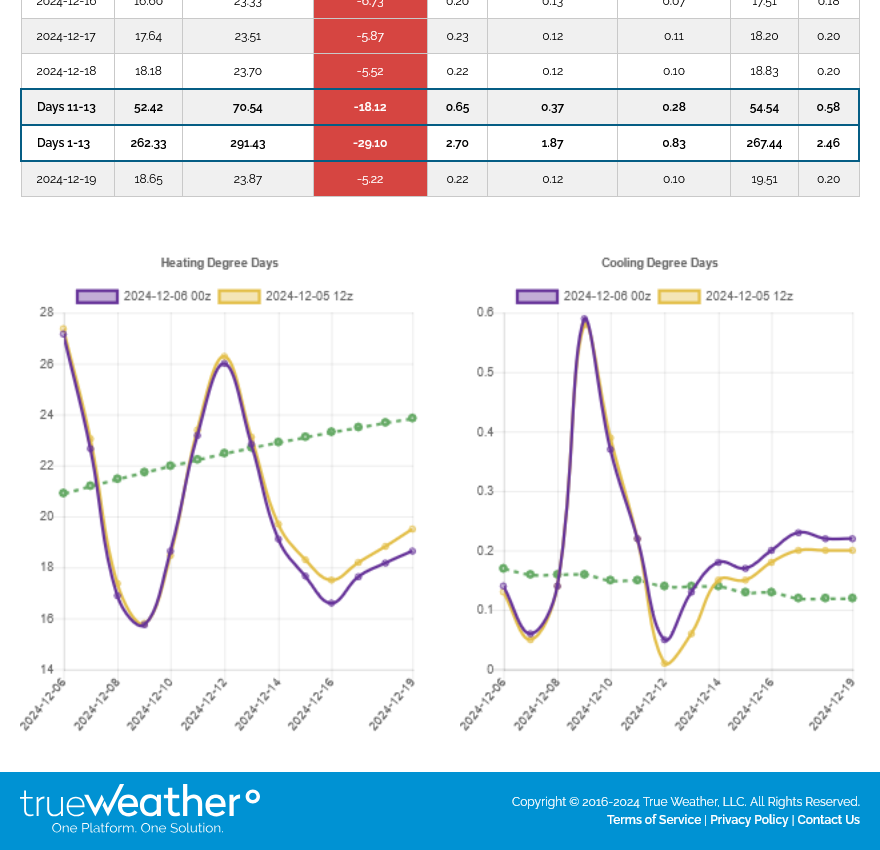
This was the last 0z European Ensemble model. HDDs are on the left in purple. It was -6 HDDs vs the previous run 12 hours earlier.
Huge spike higher from cold later this week. LESS cold later in week 2 as it warms up in the West and Central US and stays cold in the East.
+++++++++++++
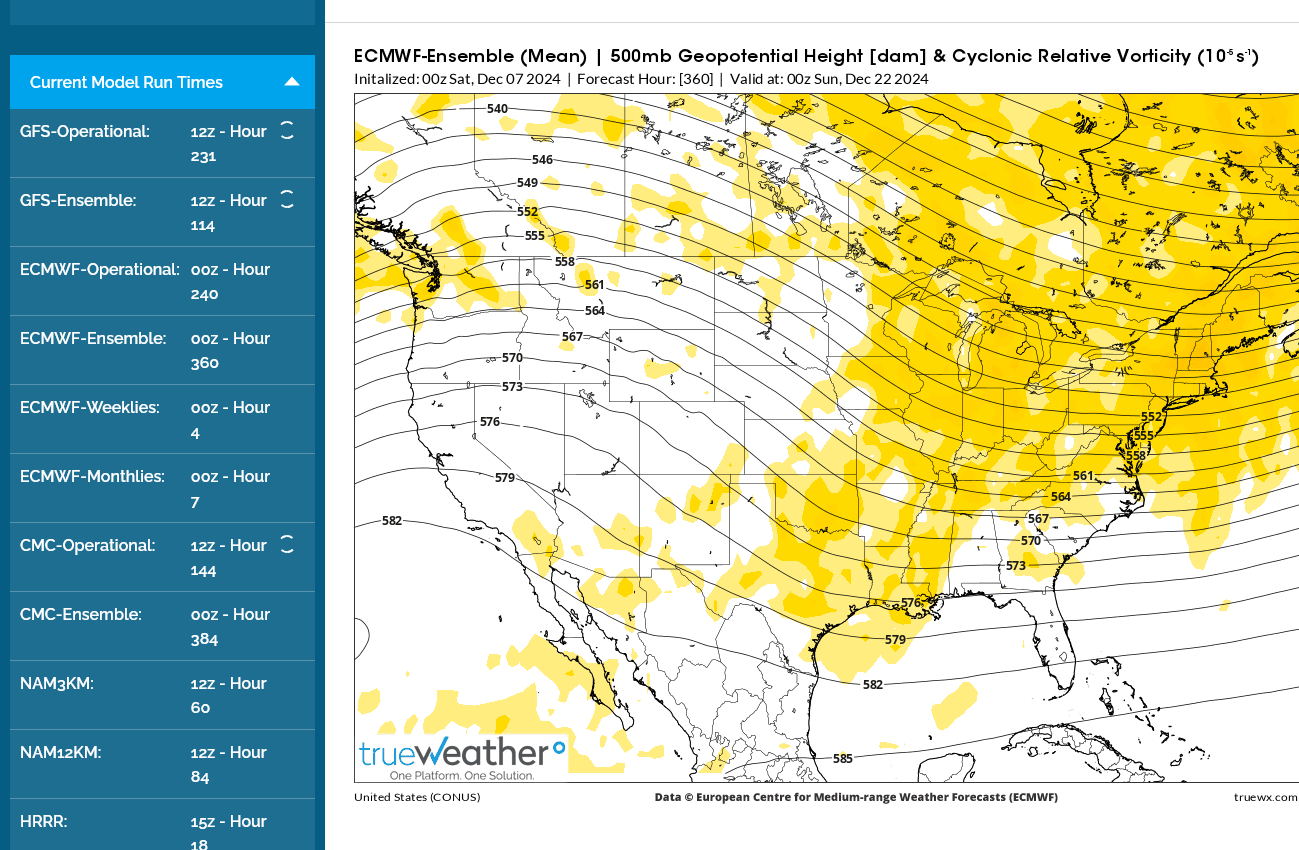
500 mb map for the EE at the end of 2 weeks. Strong ridge/west-trough east (cold) couplet.

I figured out why my buy order wouldn't get accepted minutes before the close on Friday.
The margin requirement was tripled for the expiring front month, in addition to margins being 10+ times higher for a position trade(held overnight vs a day trade).
Not trading and following the markets as much recently because of Dad, I completely forgot that NGZ is close to expiring and was throwing this order in with minutes left to trade for the week.
I could say that it was a good lesson but the circumstances are not going to happen again the rest of my life. Figuring it out, at least verified exactly what my trading limits are which might help in the near future even though my trading has been near zilch recently.
-7 HDDs on this last 12z EE (left-purple) compared to the previous one 12 hours earlier.
Green is the rapidly increasing seasonal HDDs based on Winter cold approaching.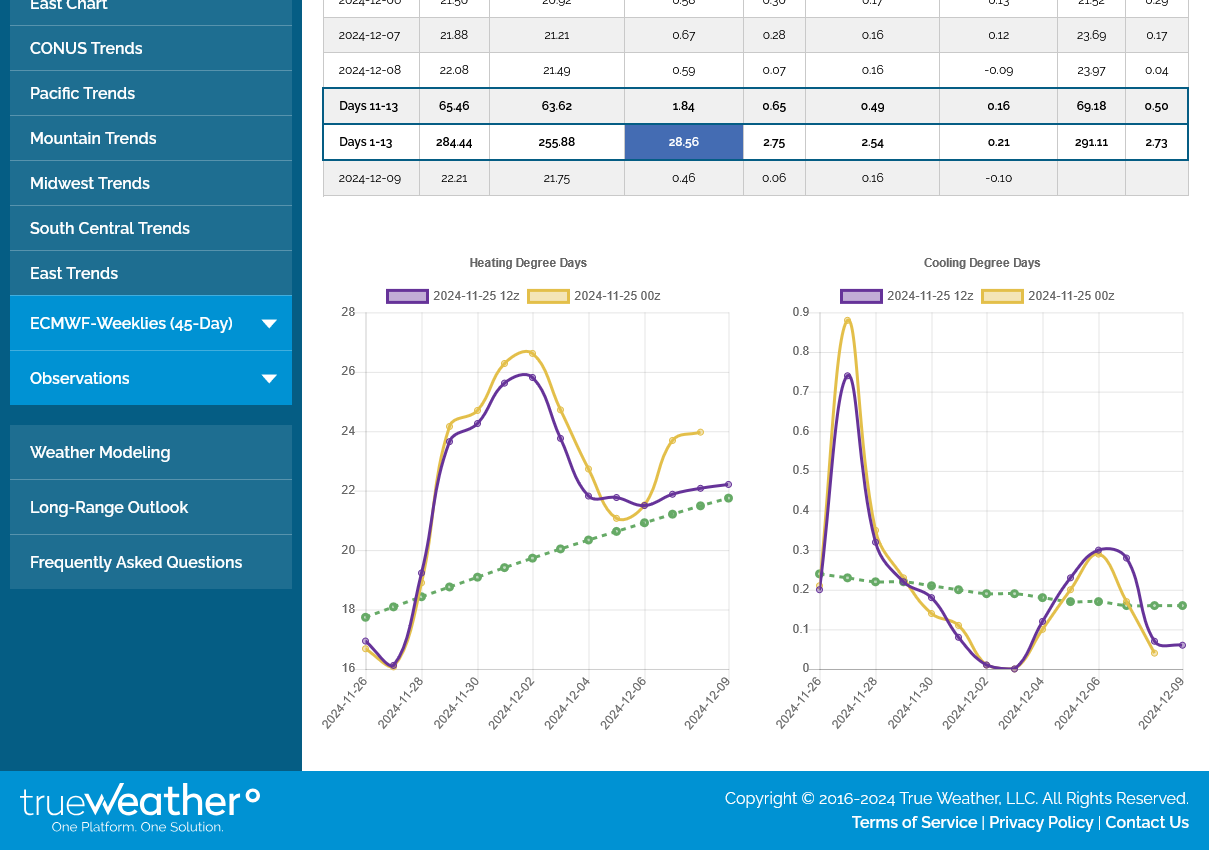
All the latest comprehensive weather here:
NG down 4.5-5% for the last few hours with most of drop from late last evening through early this morning.
Mike, if you’re following, were there any warmer ensemble runs last night?
MUCH warmer overnight, Larry!
The EIA number is coming up a day early because of Thanksgiving and it will be unusually bearish but the market dialed that in before the weather happened.
-10 HDDs on the last 0z EE vs the previous 12z run!
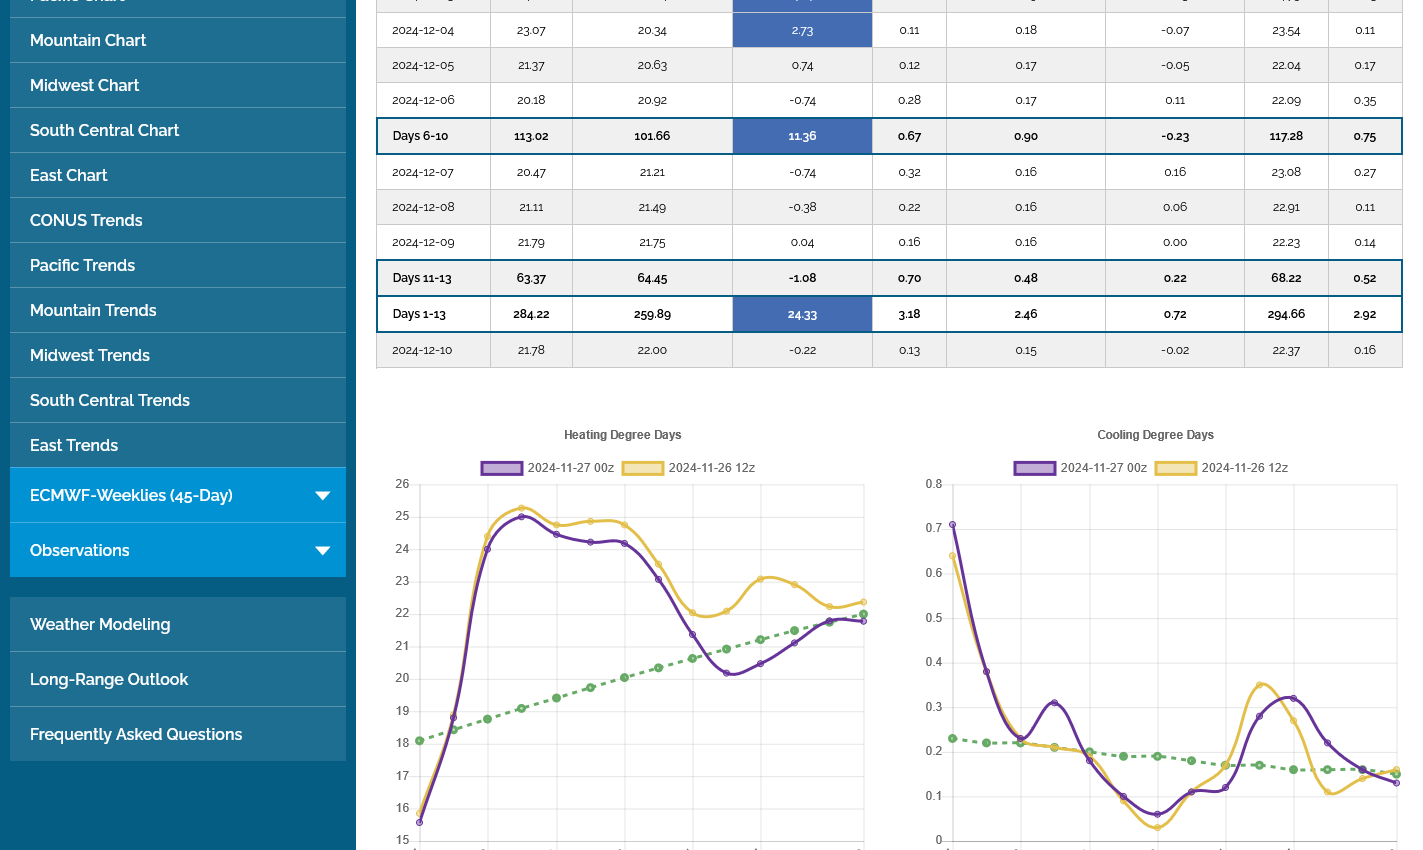
Very bearish for late November. Not sure what was expected.
The blue line on the storage level graph below, continues ABOVE the 5 year range(higher than any of the last 5 years) and near record high levels.
https://ir.eia.gov/ngs/ngs.html
for week ending November 22, 2024 | Released: November 27, 2024 at 12:00 p.m. | Next Release: December 5, 2024
| Working gas in underground storage, Lower 48 states Summary text CSV JSN | |||||||||||||||||||||||||
|---|---|---|---|---|---|---|---|---|---|---|---|---|---|---|---|---|---|---|---|---|---|---|---|---|---|
| Historical Comparisons | |||||||||||||||||||||||||
| Stocks billion cubic feet (Bcf) | Year ago (11/22/23) | 5-year average (2019-23) | |||||||||||||||||||||||
| Region | 11/22/24 | 11/15/24 | net change | implied flow | Bcf | % change | Bcf | % change | |||||||||||||||||
| East | 929 | 931 | -2 | -2 | 916 | 1.4 | 895 | 3.8 | |||||||||||||||||
| Midwest | 1,134 | 1,140 | -6 | -6 | 1,113 | 1.9 | 1,080 | 5.0 | |||||||||||||||||
| Mountain | 292 | 293 | -1 | -1 | 253 | 15.4 | 221 | 32.1 | |||||||||||||||||
| Pacific | 310 | 313 | -3 | -3 | 297 | 4.4 | 280 | 10.7 | |||||||||||||||||
| South Central | 1,301 | 1,291 | 10 | 10 | 1,254 | 3.7 | 1,223 | 6.4 | |||||||||||||||||
| Salt | 353 | 347 | 6 | 6 | 340 | 3.8 | 331 | 6.6 | |||||||||||||||||
| Nonsalt | 948 | 944 | 4 | 4 | 915 | 3.6 | 893 | 6.2 | |||||||||||||||||
| Total | 3,967 | 3,969 | -2 | -2 | 3,833 | 3.5 | 3,700 | 7.2 | |||||||||||||||||
| Totals may not equal sum of components because of independent rounding. | |||||||||||||||||||||||||
Working gas in storage was 3,967 Bcf as of Friday, November 22, 2024, according to EIA estimates. This represents a net decrease of 2 Bcf from the previous week. Stocks were 134 Bcf higher than last year at this time and 267 Bcf above the five-year average of 3,700 Bcf. At 3,967 Bcf, total working gas is above the five-year historical range.
For information on sampling error in this report, see Estimated Measures of Sampling Variability table below.

Note: The shaded area indicates the range between the historical minimum and maximum values for the weekly series from 2019 through 2023. The dashed vertical lines indicate current and year-ago weekly periods.
Thanks, Mike.
NG ended up down 8%!
Appreciate that, Larry. Happy Thanksgiving!
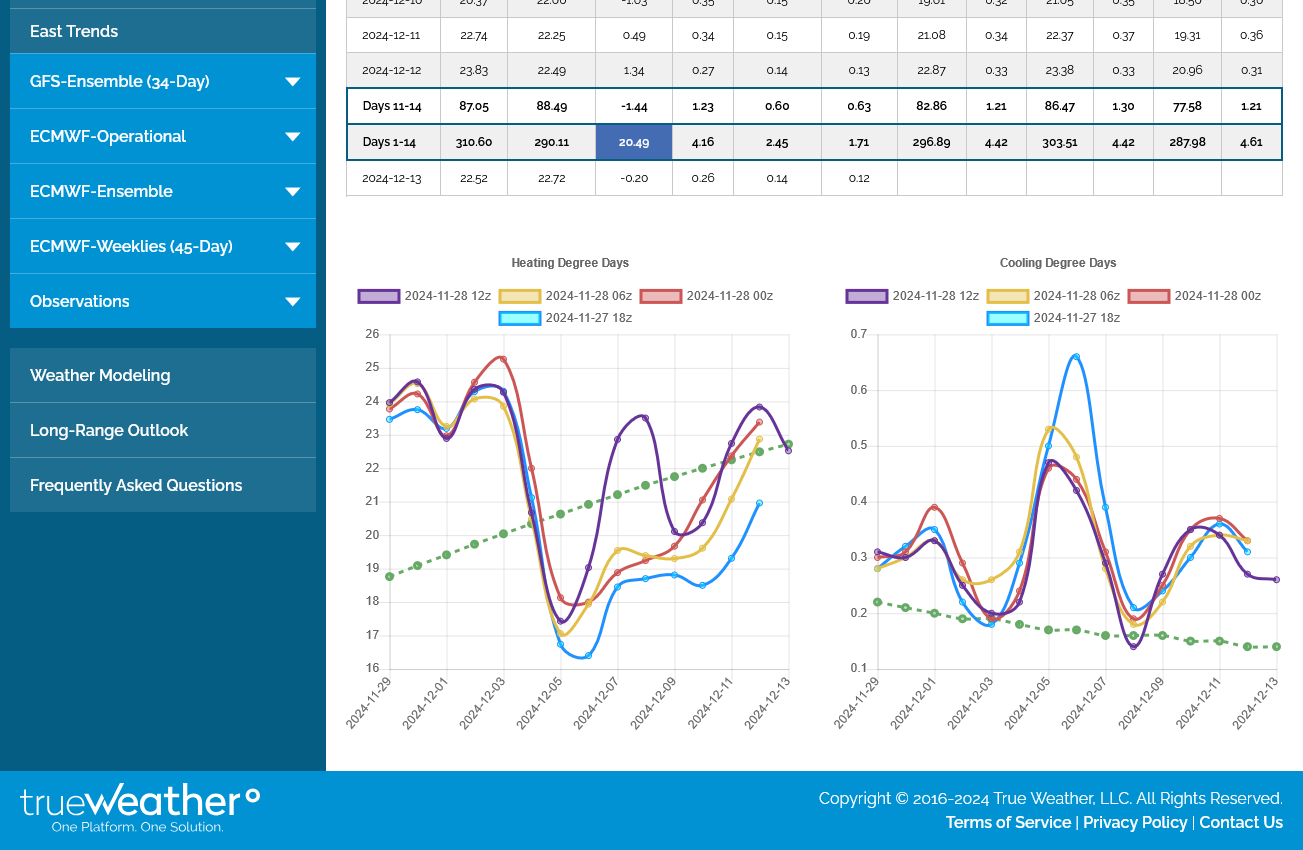
The last 12z GEFS was a whopping +14 HDDs. Its the purple line on the left. This model comes out every 6 hours vs the EE that comes out every 12 hours.
++++++++++++++
The 12z EE was +8 HDDs vs the previous 0z EE:
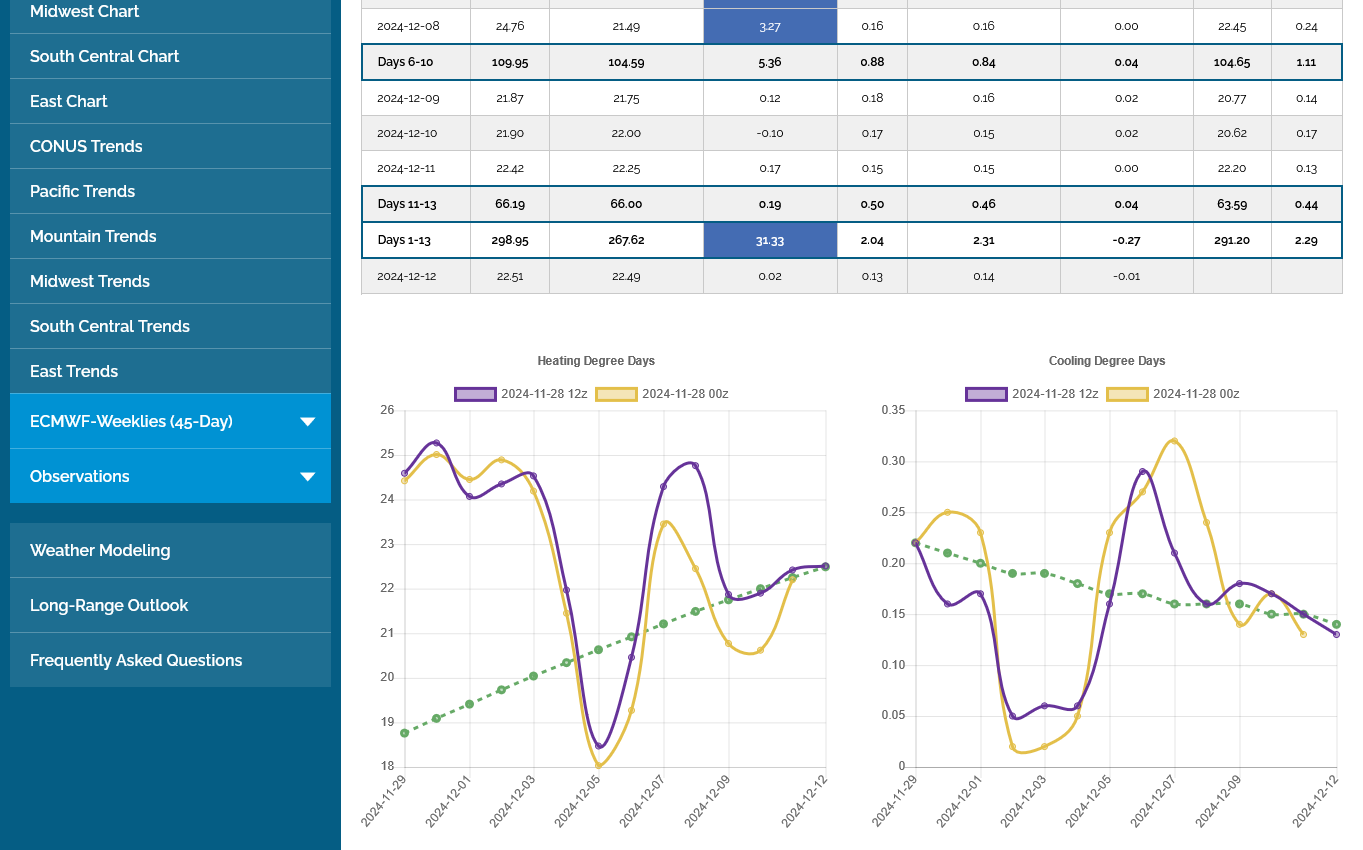
Still a cross polar flow and ridge-west/trough east couplet to transport that cold from Canada to the central and especially eastern US. 
Natural gas is up rather notably this morning (+4%) indicating that the two week forecast is most likely at least hanging on to continued cold, if not colder than how it looked before Thanksgiving.
Natural gas is down 6% this evening, which is usually at this time of year indicative of reduced cold in the two week forecast, especially toward the end of week two.
Thanks, Larry!
Correctamungo!
The last 0z EE model was another -4HDDs vs the previous 12z run. After this current cold spike peaks in a few days, temps dive to ABOVE average(below the green line).
We have a near record amount of ng in storage right now.
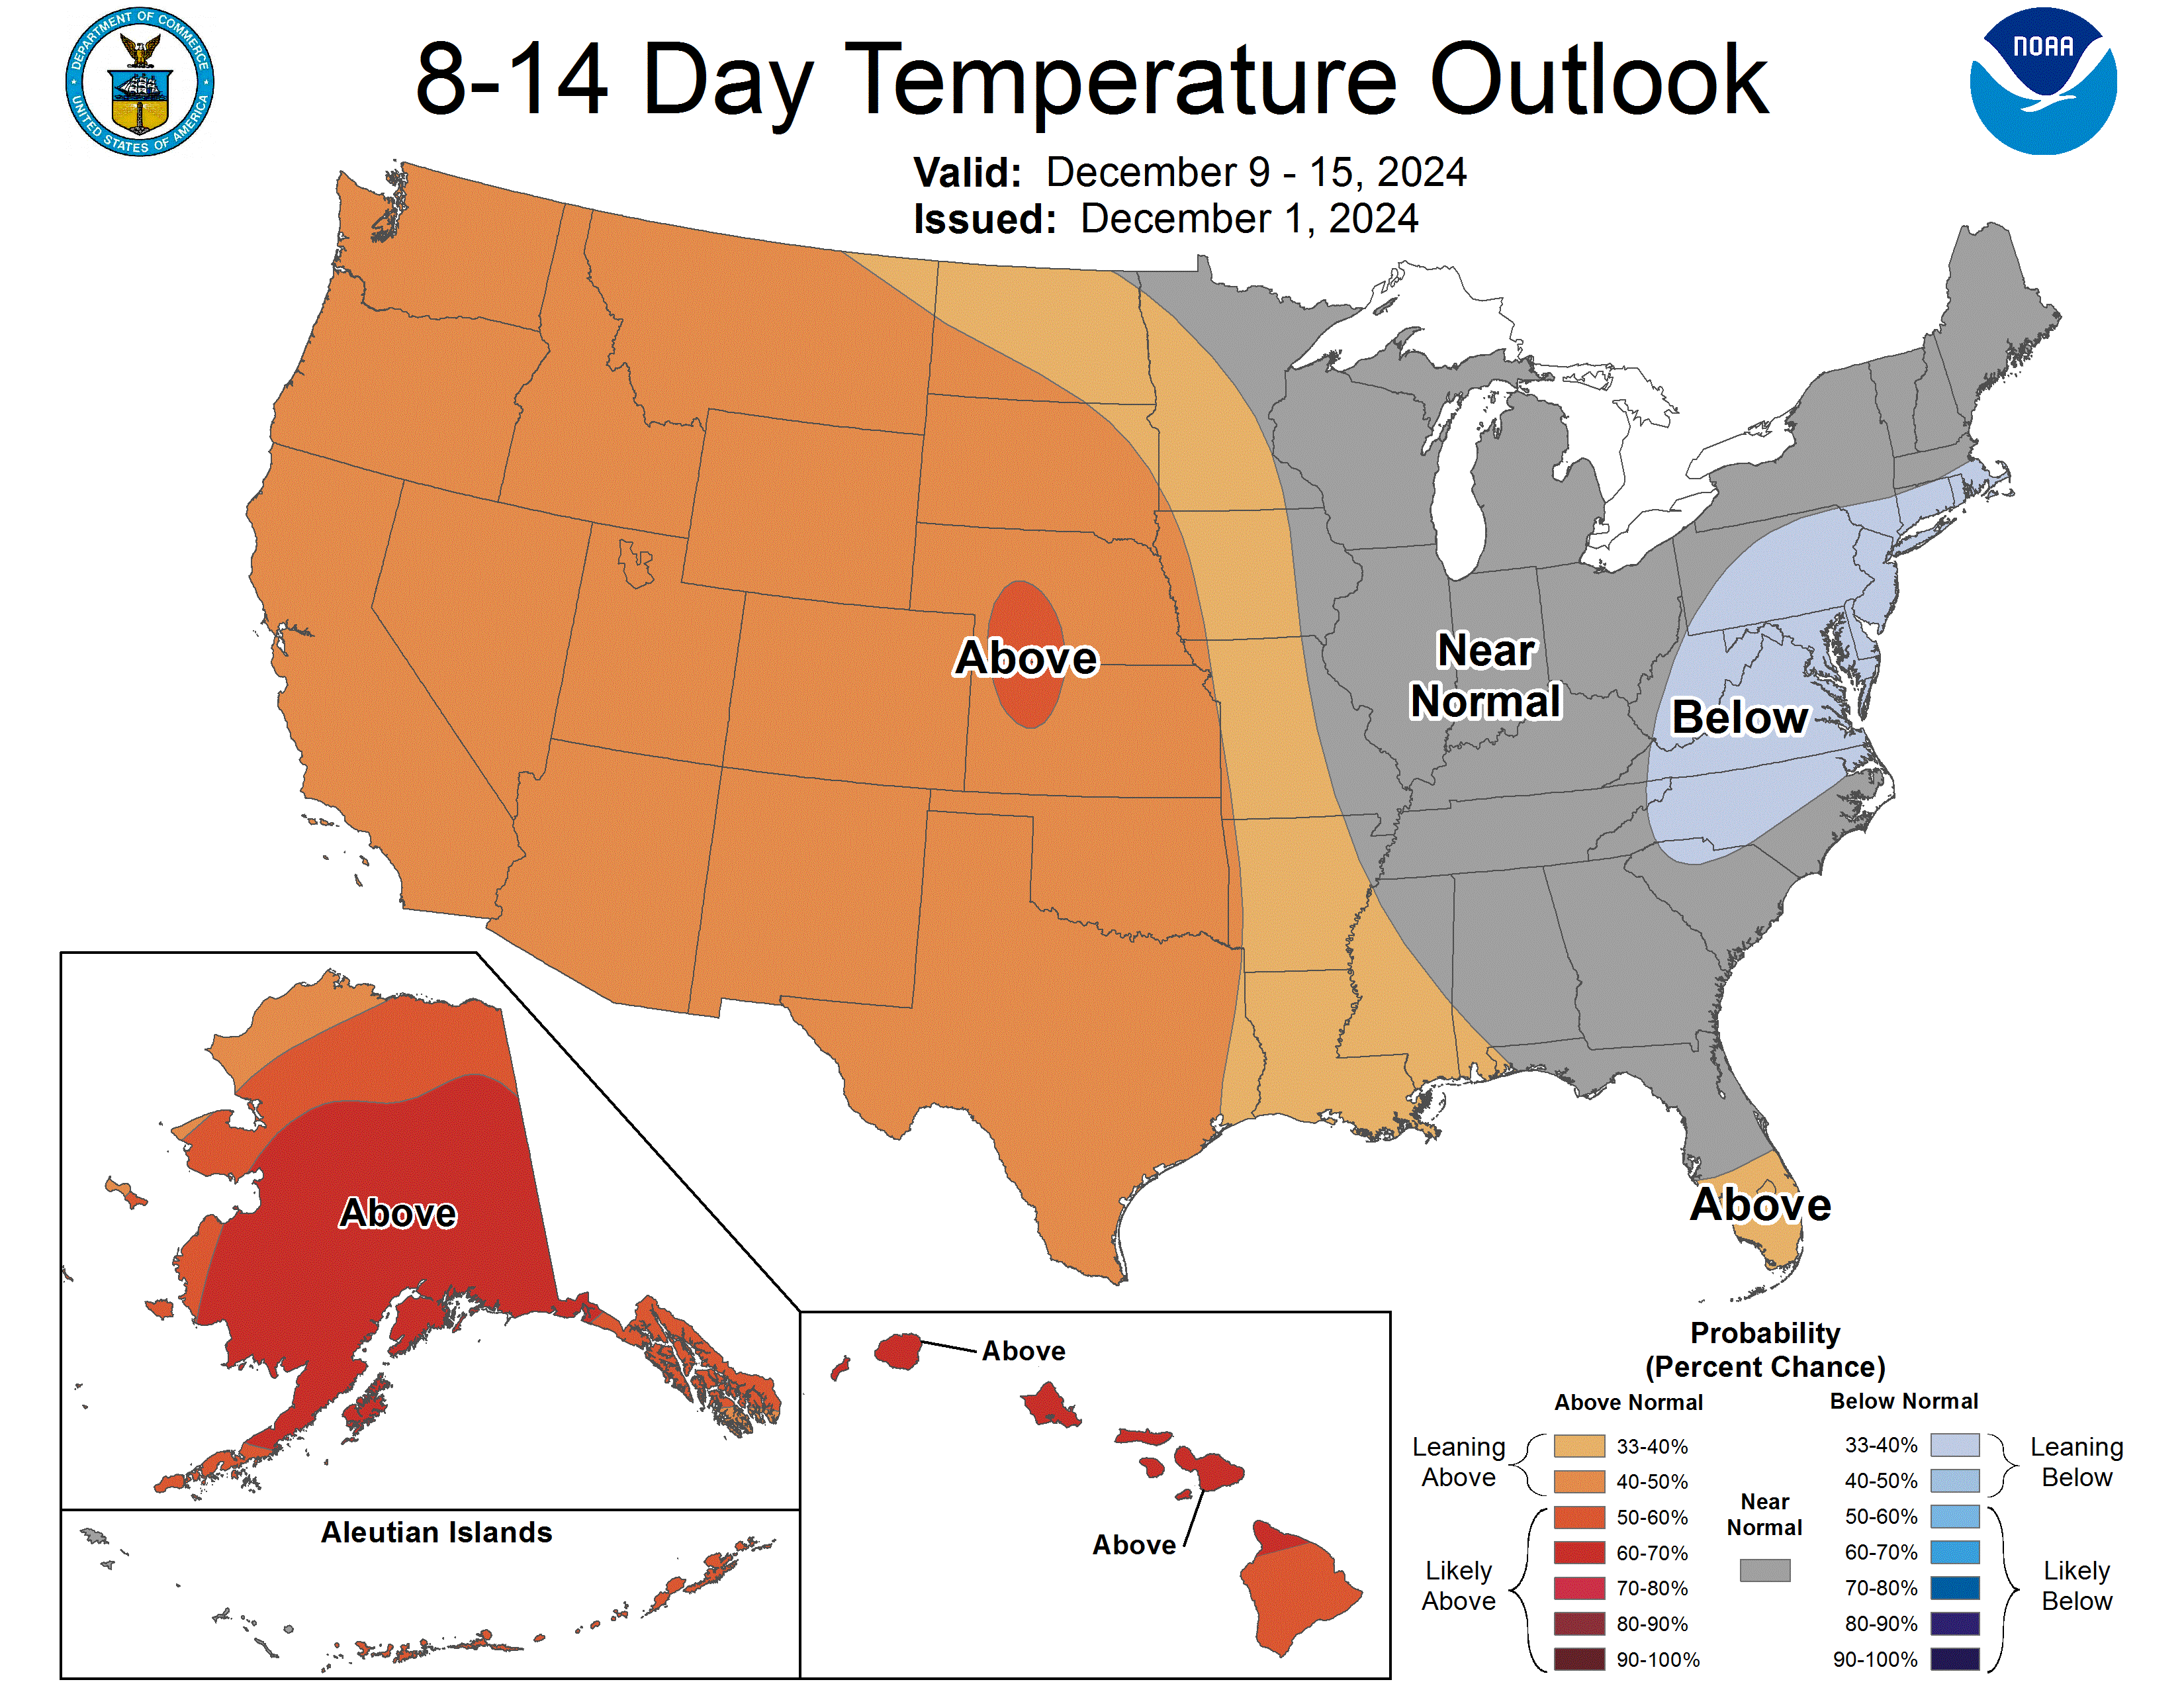
Even with the strong bearish slant to the weather forecast right now, the bullish case is not completely dead!
This is the just out 12z Canadian ensemble which has several bullish members, which still have the cross polar flow dumping air from Siberia into Canada which provides a source region for cold fronts entering the US.
On the other hand, there is Southeast ridge building on some models that will provide resistance to cold penetration and warmth in the East.
This is the battle between the northern stream and southern stream.
https://weather.gc.ca/ensemble/charts_e.html?Hour=384&Day=0&RunTime=12&Type=gz

Another -5 HDDs on the last overnight 0z European Ensemble model.
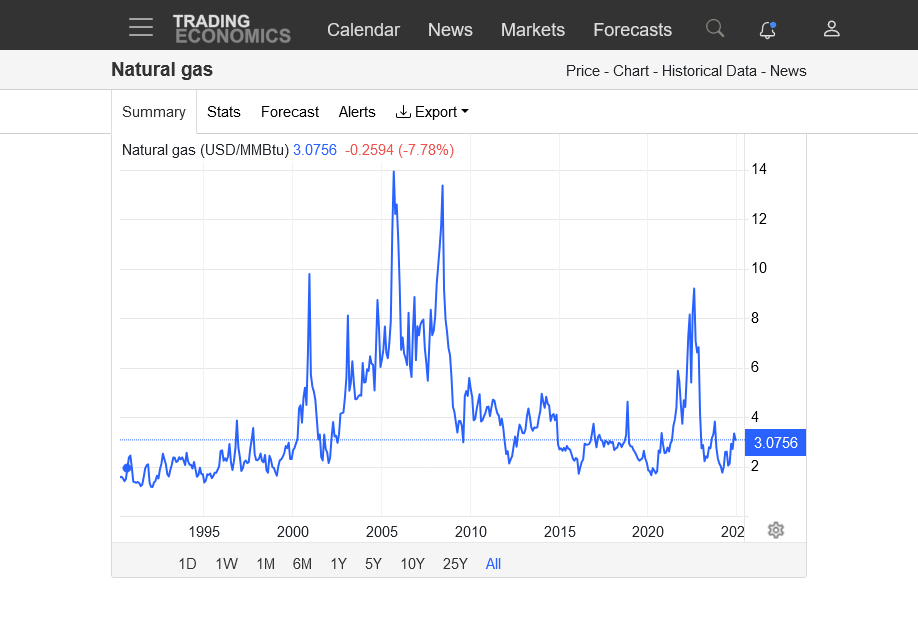
Crystal clear top in natural gas last month when the impact of approaching cold was all dialed in.
Now, the market is trading milder forecasts.
https://tradingeconomics.com/commodity/natural-gas

Thanks, Mike!
NG is down 15% vs one week ago!
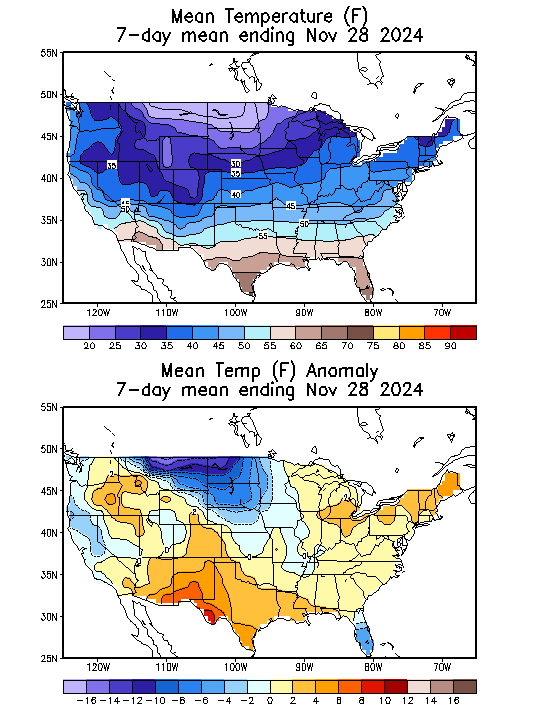
The EIA storage report should feature a seasonable withdrawal compared to the end of November historical average.
https://www.cpc.ncep.noaa.gov/products/tanal/temp_analyses.php
++++++++
-30 Bcf. The current amount of ng in storage is still very robust and ABOVE the 5 year range, indicated by the blue line on the graph below.
https://ir.eia.gov/ngs/ngs.html
for week ending November 29, 2024 | Released: December 5, 2024 at 10:30 a.m. | Next Release: December 12, 2024
| Working gas in underground storage, Lower 48 states Summary text CSV JSN | |||||||||||||||||||||||||
|---|---|---|---|---|---|---|---|---|---|---|---|---|---|---|---|---|---|---|---|---|---|---|---|---|---|
| Historical Comparisons | |||||||||||||||||||||||||
| Stocks billion cubic feet (Bcf) | Year ago (11/29/23) | 5-year average (2019-23) | |||||||||||||||||||||||
| Region | 11/29/24 | 11/22/24 | net change | implied flow | Bcf | % change | Bcf | % change | |||||||||||||||||
| East | 914 | 929 | -15 | -15 | 887 | 3.0 | 880 | 3.9 | |||||||||||||||||
| Midwest | 1,115 | 1,134 | -19 | -19 | 1,090 | 2.3 | 1,062 | 5.0 | |||||||||||||||||
| Mountain | 289 | 292 | -3 | -3 | 247 | 17.0 | 217 | 33.2 | |||||||||||||||||
| Pacific | 310 | 310 | 0 | 0 | 292 | 6.2 | 276 | 12.3 | |||||||||||||||||
| South Central | 1,310 | 1,301 | 9 | 9 | 1,237 | 5.9 | 1,219 | 7.5 | |||||||||||||||||
| Salt | 362 | 353 | 9 | 9 | 337 | 7.4 | 334 | 8.4 | |||||||||||||||||
| Nonsalt | 948 | 948 | 0 | 0 | 901 | 5.2 | 884 | 7.2 | |||||||||||||||||
| Total | 3,937 | 3,967 | -30 | -30 | 3,752 | 4.9 | 3,653 | 7.8 | |||||||||||||||||
| Totals may not equal sum of components because of independent rounding. | |||||||||||||||||||||||||
Working gas in storage was 3,937 Bcf as of Friday, November 29, 2024, according to EIA estimates. This represents a net decrease of 30 Bcf from the previous week. Stocks were 185 Bcf higher than last year at this time and 284 Bcf above the five-year average of 3,653 Bcf. At 3,937 Bcf, total working gas is above the five-year historical range.
For information on sampling error in this report, see Estimated Measures of Sampling Variability table below.

Note: The shaded area indicates the range between the historical minimum and maximum values for the weekly series from 2019 through 2023. The dashed vertical lines indicate current and year-ago weekly periods.
The EE was another -5 HDDs overnight. $3 is extremely solid support right now.
A minority but significant minority of the ensembles are trying to morph back to a cold pattern at the end of 2 weeks. There is a battle between the northern stream, the milder Pacific stream and an upper level ridge building in the Southeast that will cause resistance to cold.
https://weather.gc.ca/ensemble/charts_e.html?Hour=384&Day=0&RunTime=00&Type=gz
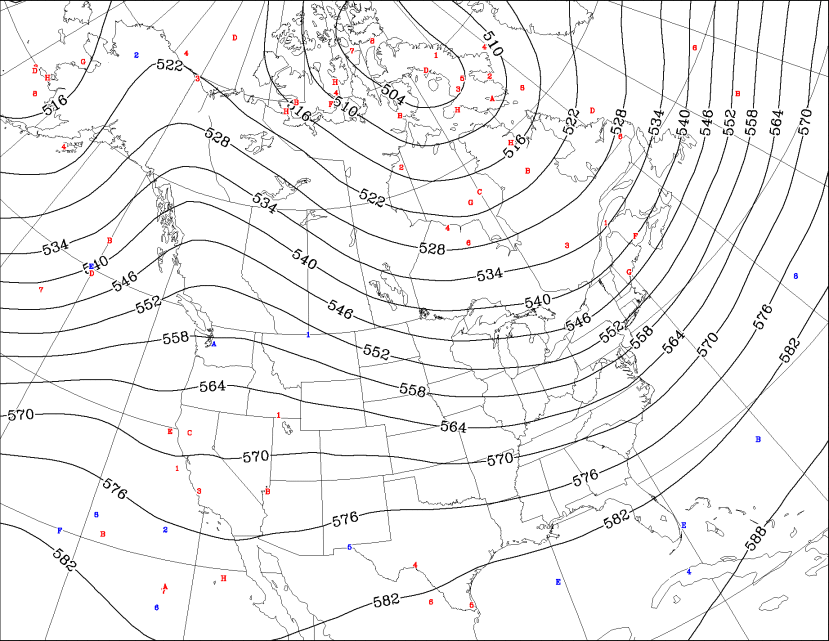
Most of the guidance is bearish and mild for natural gas. However, this last EE model solution at 2 weeks still shows a tenacious ridge/west-trough/east couplet which is potentially bullish. However, the northern stream is lacking and the source region of the air in the East is more Southern Canada vs Arctic.
It would favor chilly weather in the Southeast more than any other place because the contrast between Southern Canadian sourced air and average is greatest there.
The West will be MUCH above average with this pattern. That mild air will spill eastward into the Plains, then Midwest. The farther east we go, the cooler vs average it gets.
Hey Mike,
I don’t have the HDDs. But looking at the GEFS and EE, it sure seems like they’ve overall cooled off since Thur in the E US with upper troughing for both 12/11-14 and for 12/20+.
Are you seeing this, too?
I’m still not trading commodities currently. But if I were I’d be tempted to look for an opportunity to go long NG considering how far down it was late last week vs when it peaked near 3.56 in Nov.
*Corrected date typo….12/20+ instead of 12/2.
Thanks, Larry!
You are correct! Great call! You should start trading again!
Huge, bullish upside breakaway gap higher on the open tonight.
The ridge/west-trough east couplet mentioned yesterday has amplified a bit but the biggest deal is more cross polar flow into Canada from Siberia on the last run which introduces a MUCH colder source region for the cold when cold fronts come south from Canada.
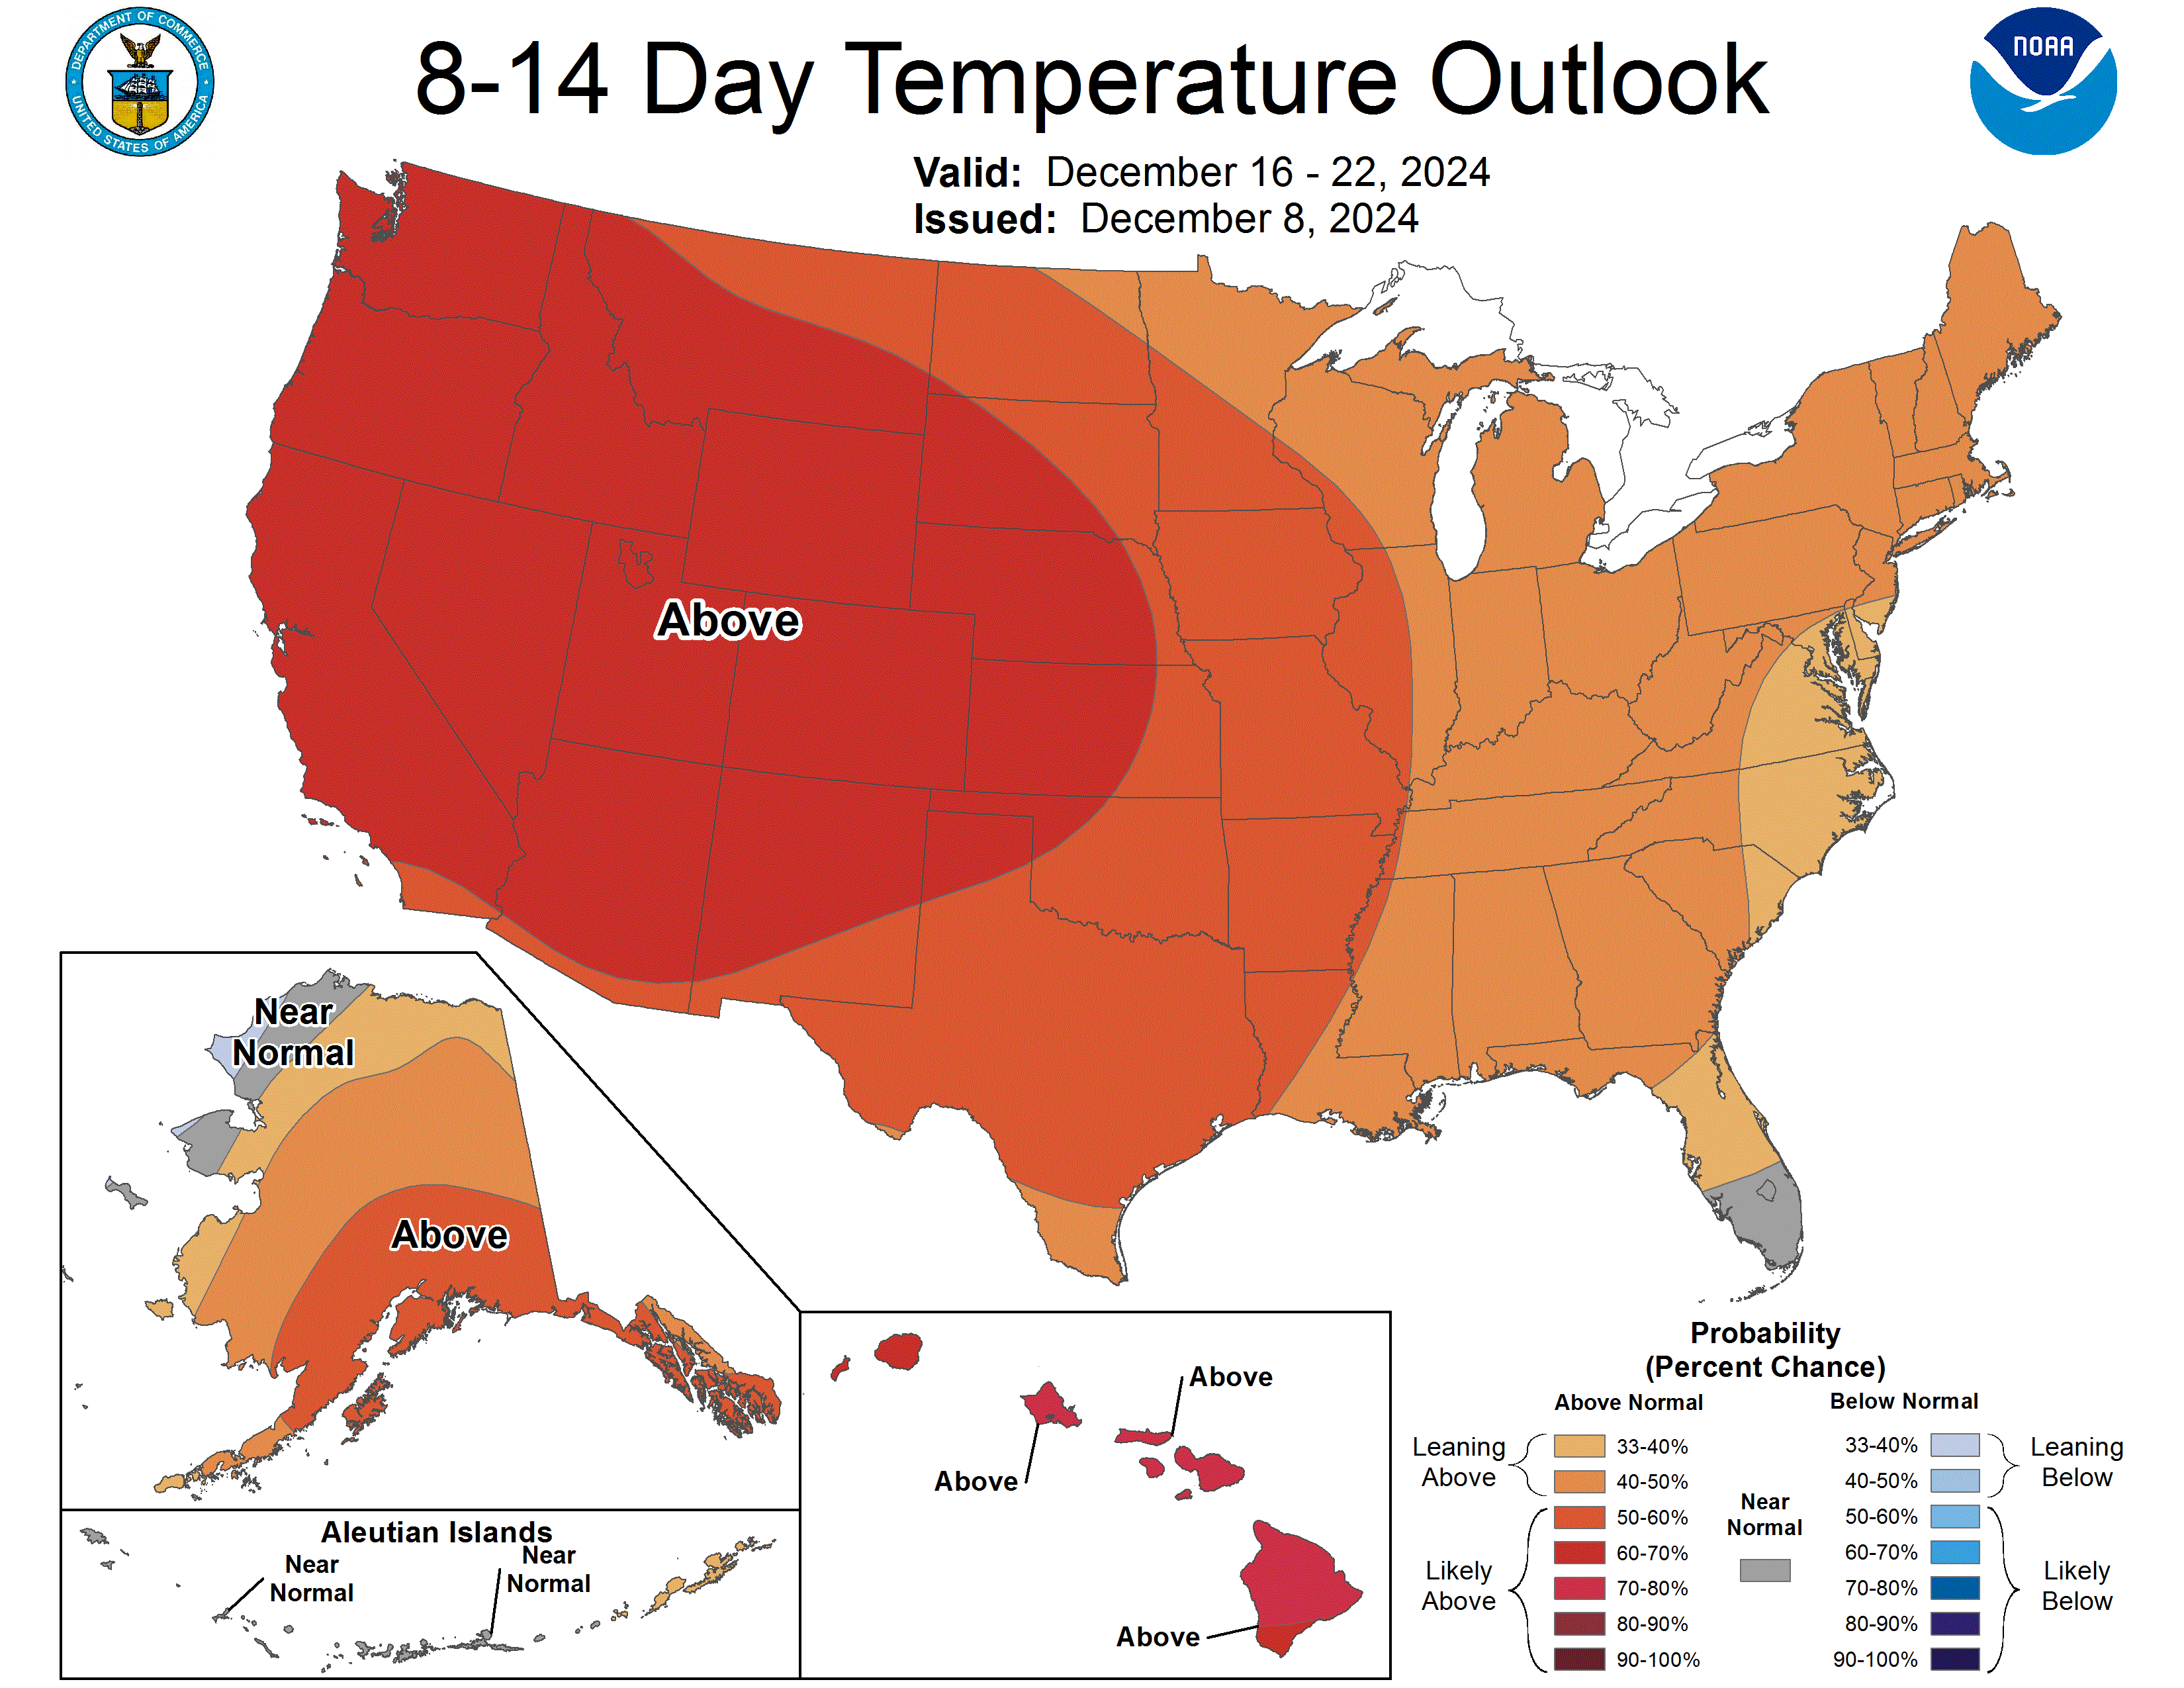
The NWS week 2 products were still VERY bearish/mild but the market knows better.
When was the last time you saw a huge gap higher in December with a forecast like this?
Regardless, there is a great deal of uncertainty and model runs are likely to change a great deal compared to their previous runs.
More shortly.
7pm: The last 18z GEFS just out(purple below/left) was LESS cold. -7 HDDs vs the last 12z run(yellow/tan) but much less cross polar flow and cold coming into Canada and south into the Eastern US. As a result, NG dropped to just below the open and made new lows but there is still a massive price gap above Friday's highs. EXTREMELY VOLATILE!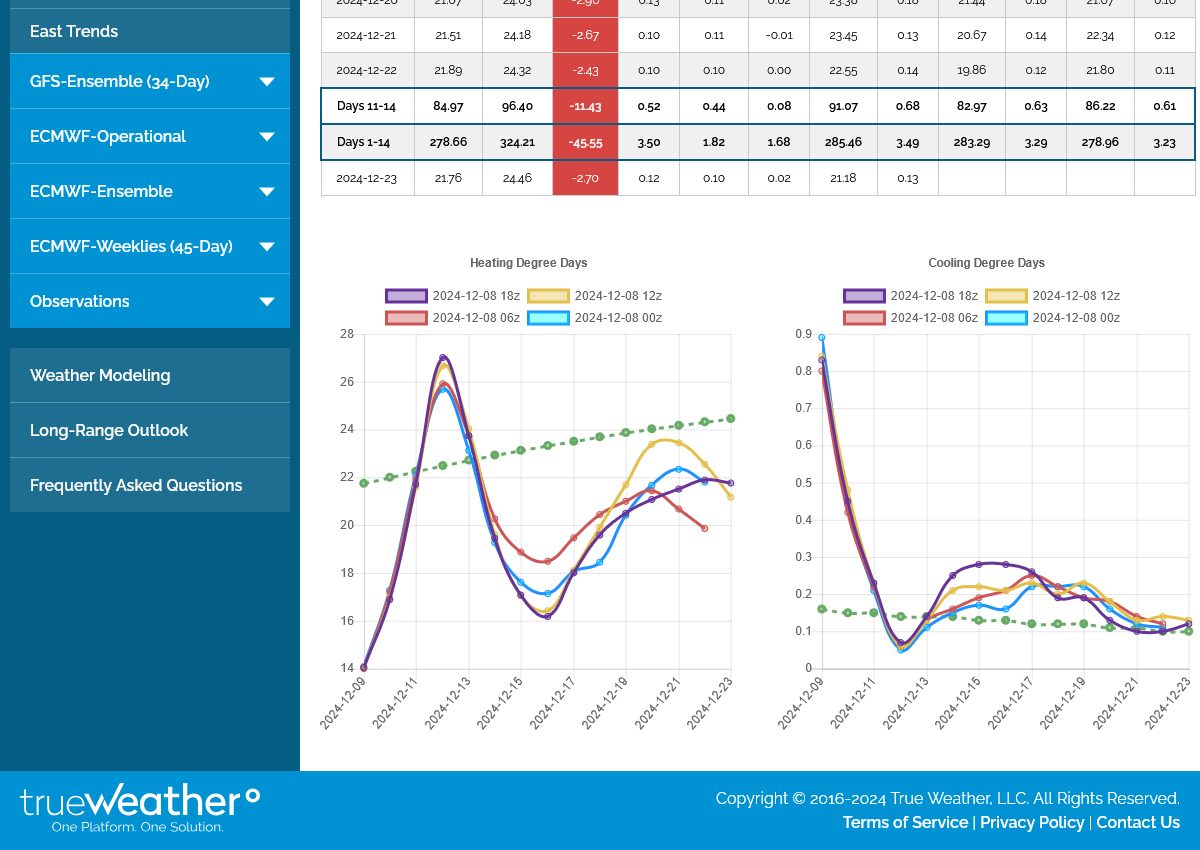
+++++++++++
Heating oil isn't the best weather market but the East is where the coldest air will be(where they use the most heating oil for residential heating in the Winter). This is ONLY for the East below. Above is the entire country.
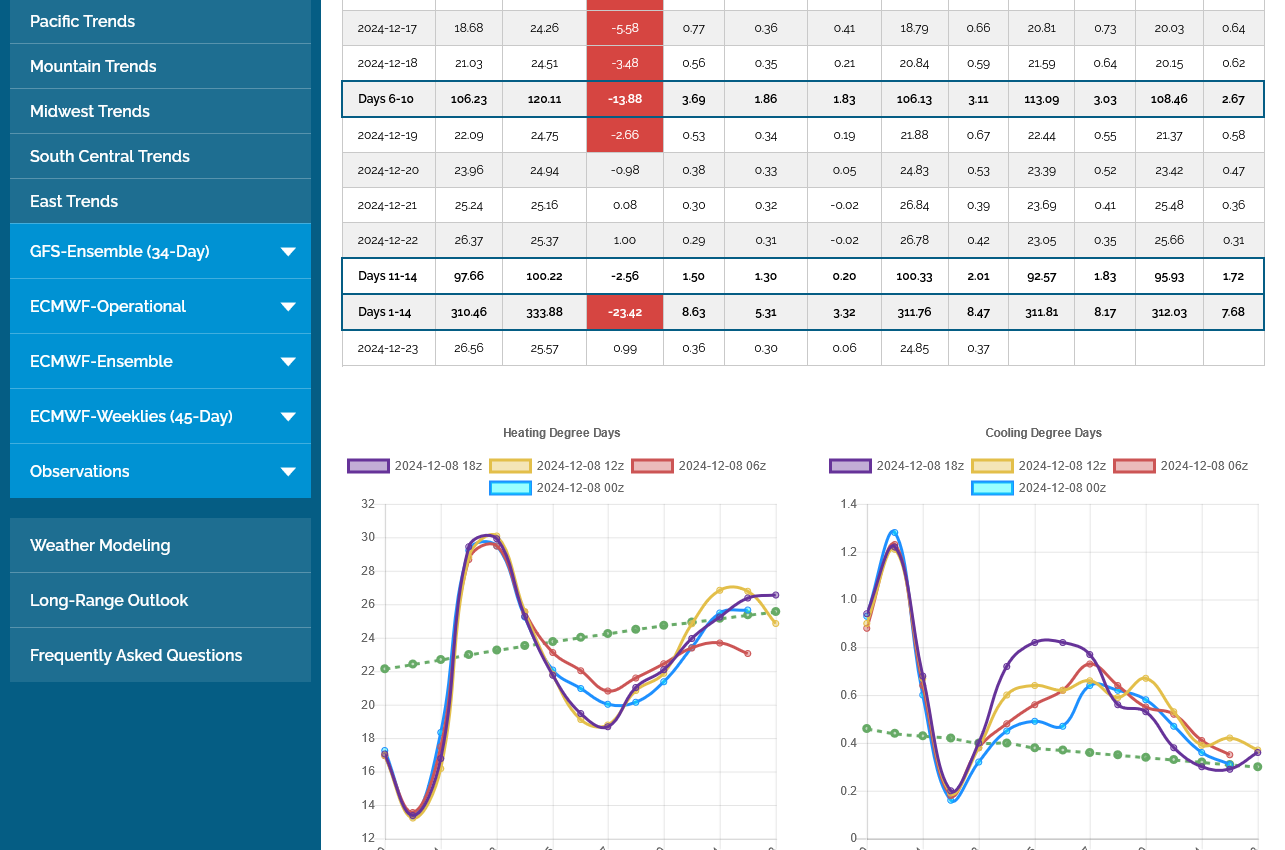
Hey Mike, thanks for the update! I’m seeing even milder 0Z GEFS and 0Z Euro operational and NG giving up more gains. Are you seeing the same?
0Z EE still early in its run though.
Yessireee, Larry!
the 12z run GEFS had the 850mb -3 deg. C isotherm over Chicago At the end of 2 weeks.
the last 0z, 12 hours later is at 0 deg. C.
thats +5 deg F for that time frame in a large area 0z. Warmer than 12z.
EE was close to the previous run.
NG sold off a great deal since the huge gap higher on the Sunday night open but has been unable to completely fill the gap……so far!
It will,probably take weather models turning colder again to keep the price from filling the gap.
$3 last week was clearly rock solid support. NG in storage is above the 5 year range.
However, the next 2 EIA storage reports on Thursday at 9;30am will show robust drawdowns that take is into,the top of that range.
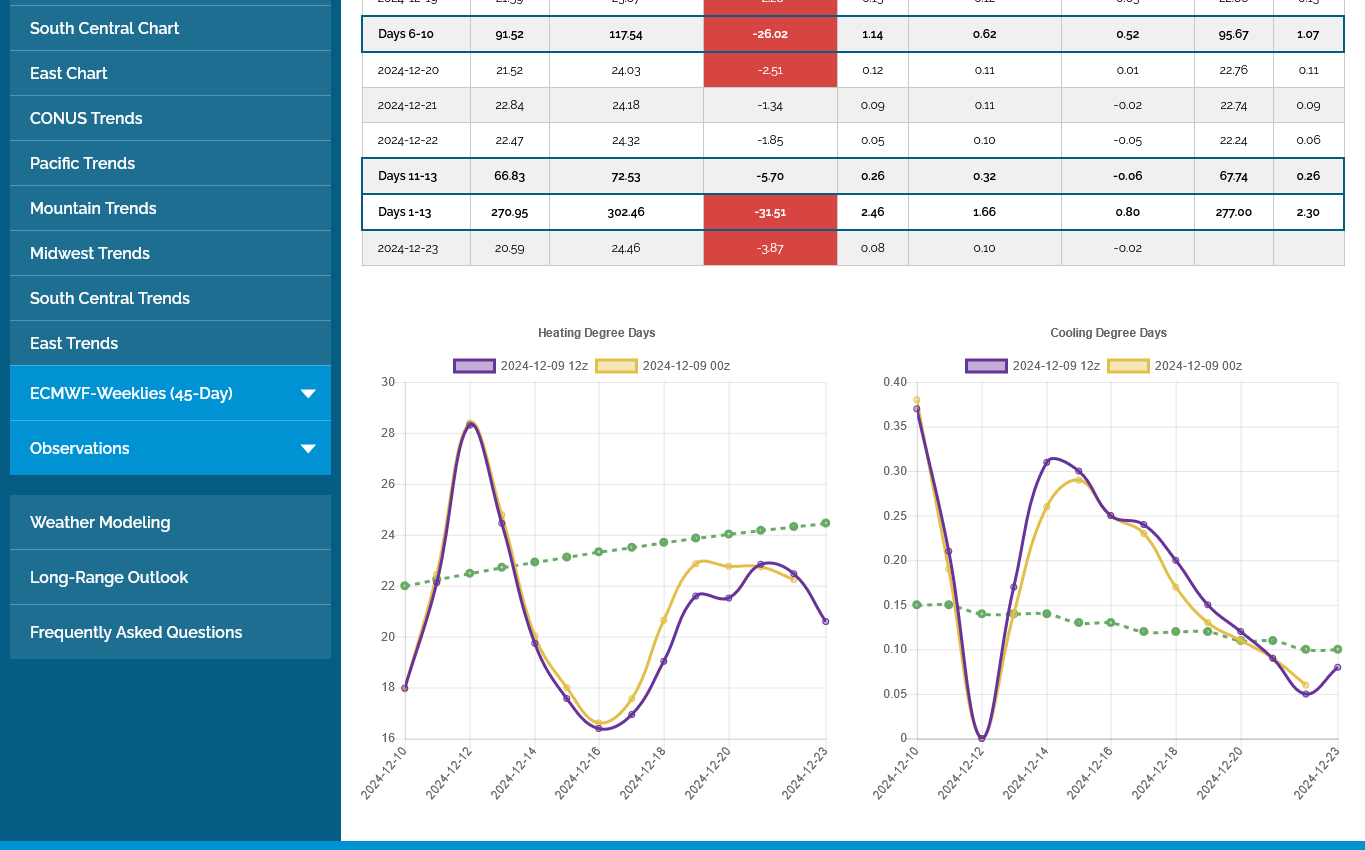
The 12z European Ensemble(purple/left) was -6 HDDs BEARISH vs the previous 0z run from 12 hours earlier. However, as mentioned the ridge/west-trough/east couplet is NOT extremely bearish because its a teleconnection that favors cold in the high population centers of the East/Southeast that use alot of natural gas for residential heating!
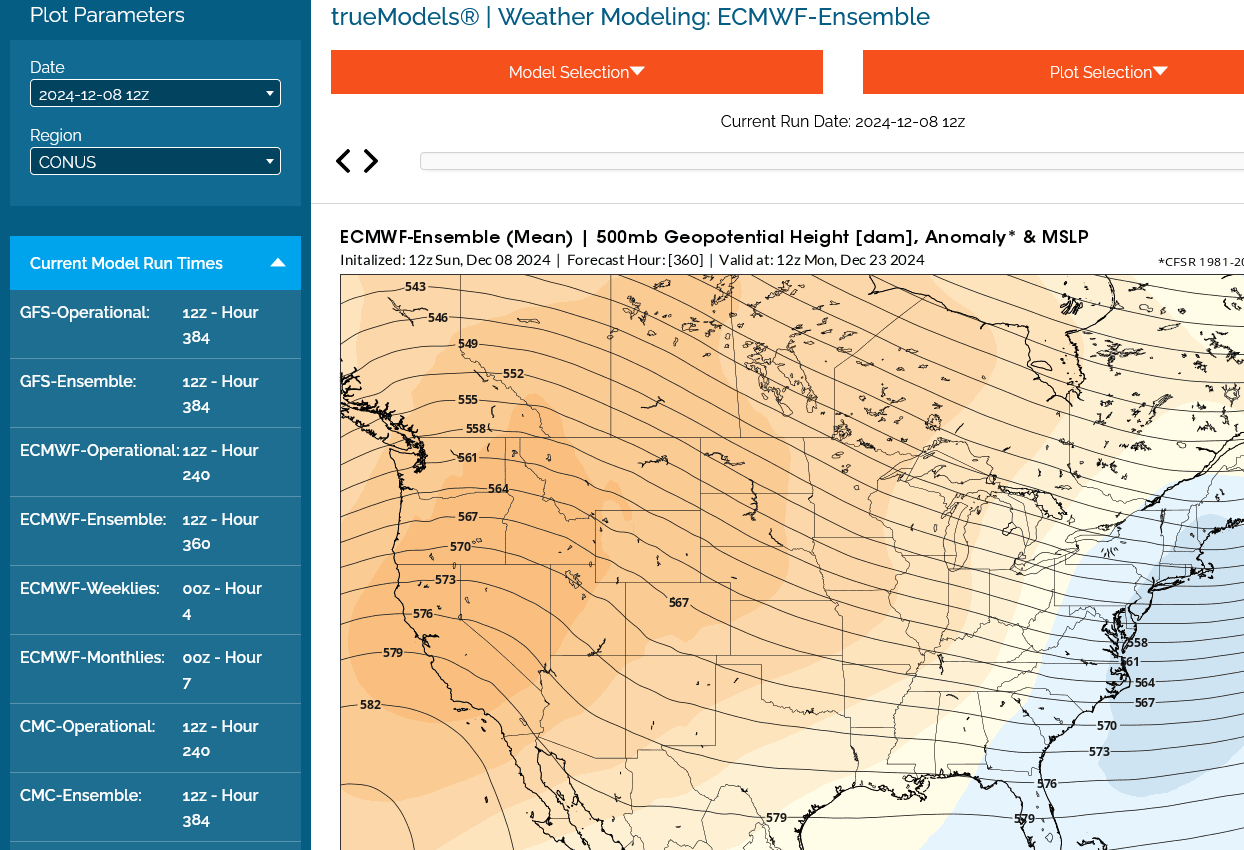
Below are the mid/upper level features in 2 weeks. Negative anomalies in blue. The upper level steering currents tend to follow the streamlines(height contours) below. So there is a northerly component in the east but the source region is still not very cold, meaning the type of cold will be more Southern Canada and NOT Arctic. This means the Southeast, with the greatest contrast vs average with that type of cold will see the chilliest weather COMPARED TO AVERAGE IN THE SOUTHEAST. Even there, it will be close to average cold.
What would turn this BULLISH is if Canada fills up with Arctic air(instead of mild Pacific air from zonal/west to east flow.
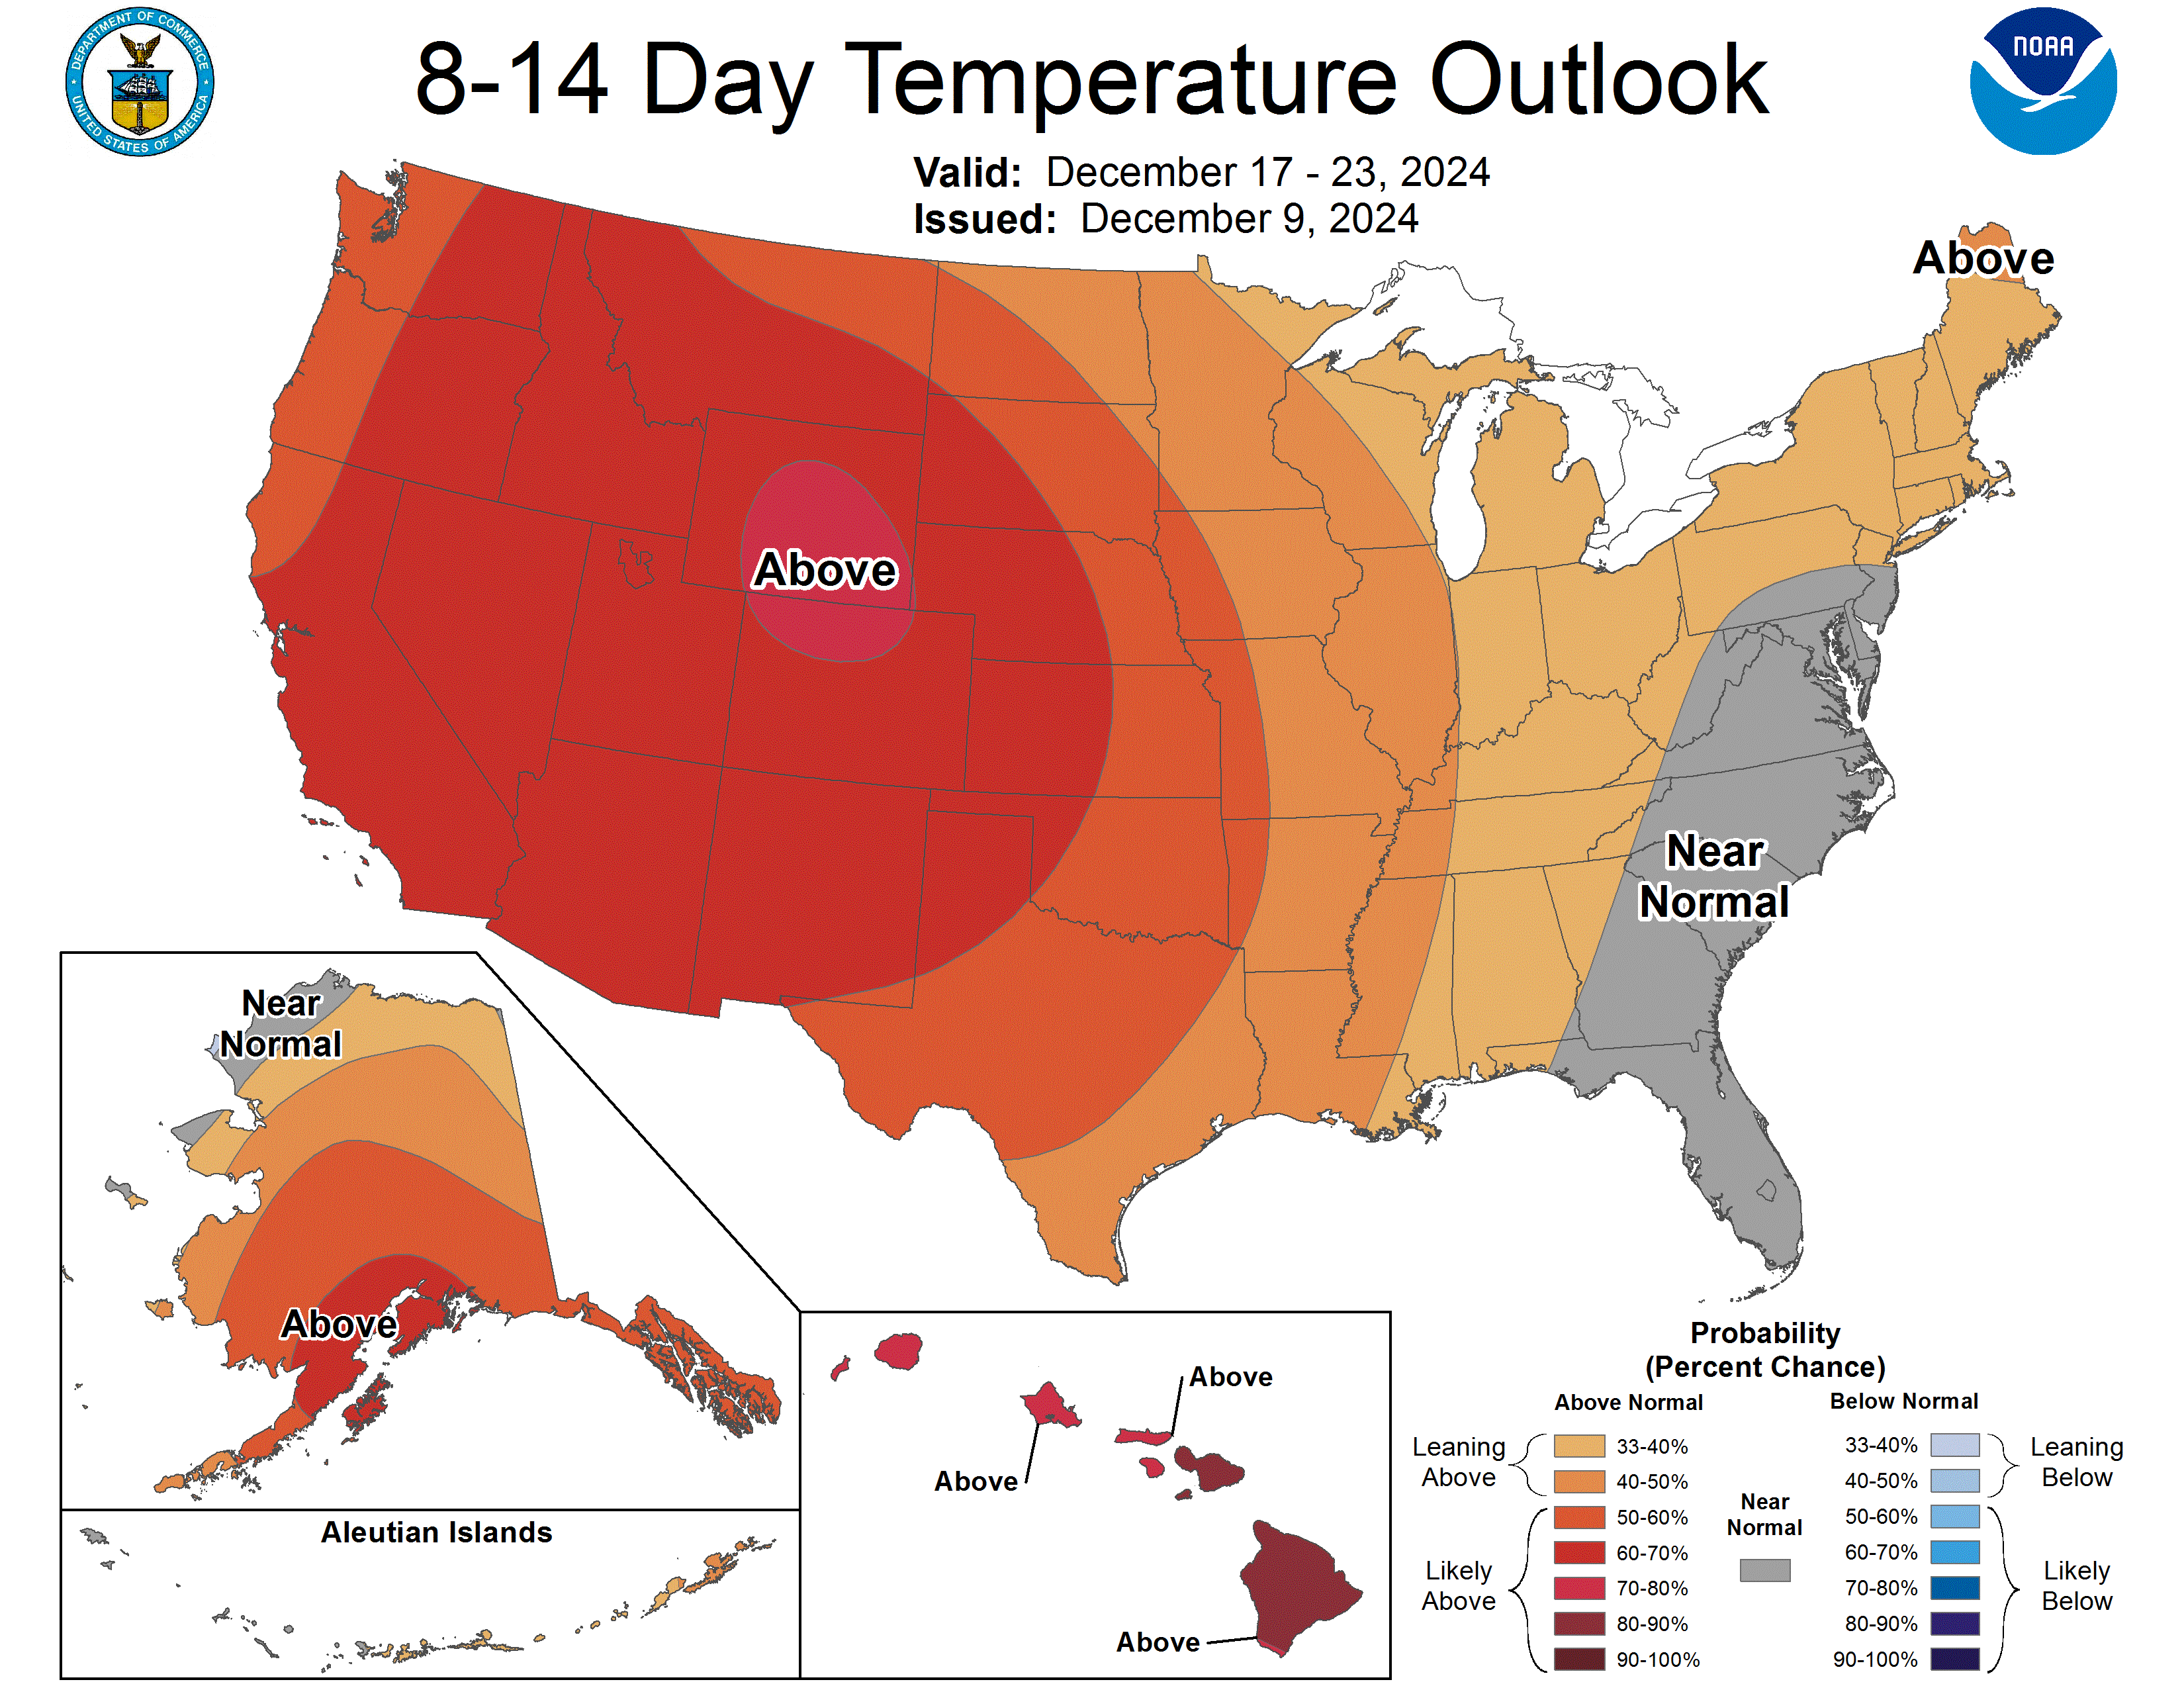
The NWS agrees with the previous assessment with their just out week 2 forecasts:
https://www.cpc.ncep.noaa.gov/products/predictions/814day/index.php
This lat 6z GEFS is coming out EXTREMELY mild. At least -10 HDDs bs the previous runs!
as a result, the price has closed the gap higher open from Sunday night…..negating the upside breakaway gap signature on the price chart.
now it’s a bearish gap and crap buying exhaustion formation.
Last 12z GEFS was MUCH colder in week 2!
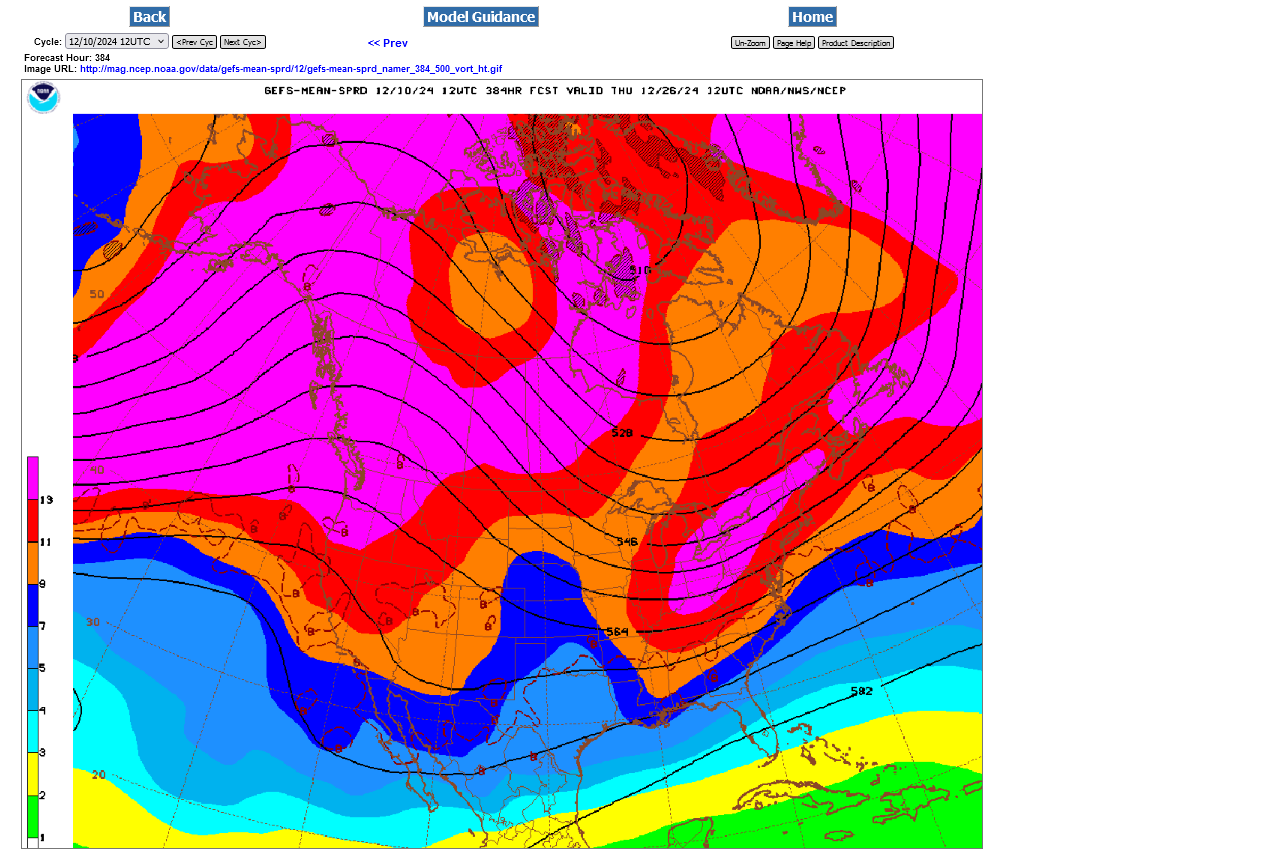
Added: Last 500mb map at 384 hours of GEFS. The upper level ridge in the west goes well into the high latitudes, even enough to cause some cross polar flow. Just follow the stream lines to see where the air masses will be coming from. The 850 mb temp in Chicago at that time is -4 Deg. C which is much colder than any other solution this week. The northern stream will be dominant if the solution below verifies.
The EE was similar to the GEFS but the Canadian model was mostly zonal with mild Pacific air tracking from west to east. A couple of days ago, the Canadian model was the coldest!
MUCH UNCERTAINTY!
Thanks, Mike.
Also, it appears to my eyeballs that the colder 12Z Euro suite helped NG to rise ~2% late.
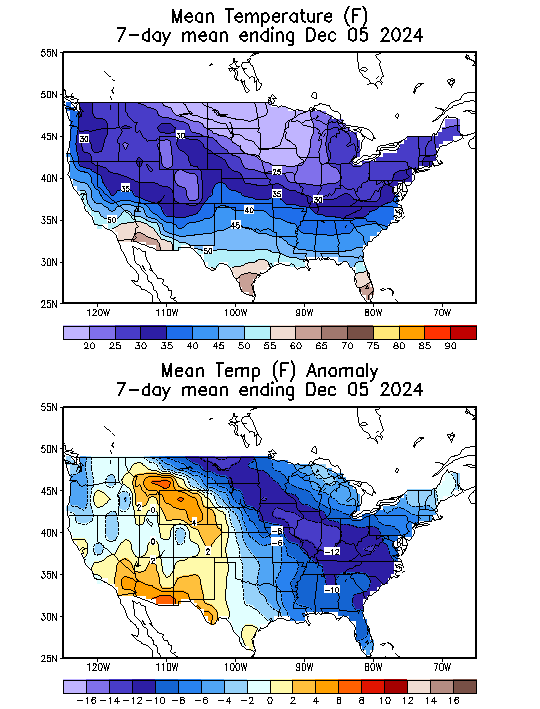
7 day temps for Thursday's EIA. Robust drawdown!
Extreme cold for early Winter in some high population centers that use natural gas for residential heating.
https://www.cpc.ncep.noaa.gov/products/tanal/temp_analyses.php
NG up ~5%. Some likely due to short covering before the anticipated large EIA draw, but I bet the majority is due to colder 0Z/6Z ensemble consensus. Mike, what say you?
thanks, Larry!
im thinking this short term arctic blast and expectations for a bullish EIA number must be much of it.
this is normally dialed into the price a week BEFORE by a market that trades future weather NOT past weather but the models are really not that much colder to account for gains this big.
the Canadian model is actually VERY mild, while the GEFS and EE are the colder models but even they are only near average HDDs in week 2.
Thanks, Mike. So, the 0Z/6Z GEFS/EE haven’t cooled off during 12/19-24?
I’m seeing a lot of potential for E US cold during that period, starting on 12/19 in the SE.
You are correct Larry!
the EE is just +1.7 HDDs, mainly from 4 colder days in week 2 with the same pattern as before.
The GEFS was +9 HDDs from those 4 days, with the rest being the same and temps being well ABOVE average all the others days and around average on those coldest days.
The markets extreme move up today would normally not come from 4 colder days in week 2 of a very mild forecast.
there is actually a fairly strong up seasonal during the first half of December which might be helping.
The last 12z GEFS is in purple below/left. It's a bit less cold than that MUCH colder 6z run(yellow) was for the coldest 4 day period in week 2 that results in a cold spike to almost average temps at its peak, from above/much above temps the rest of the period.
Compared to yesterday evenings 18z line in blue, there is actually a stark contrast with the additional cold adding +17 HDDs from that low point which featured a very mild run.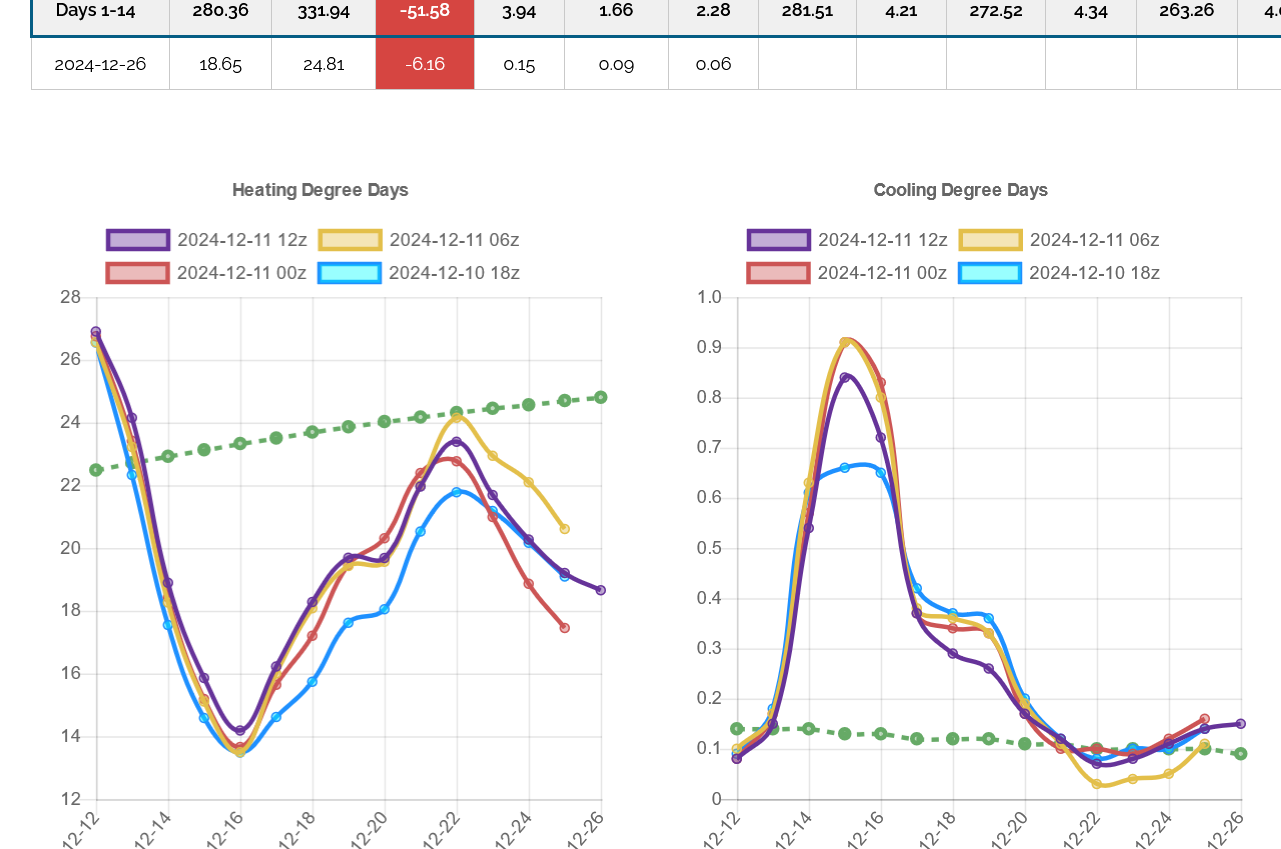 ++++++++++
This last 12z European operational model in purple was -7 HDDs milder
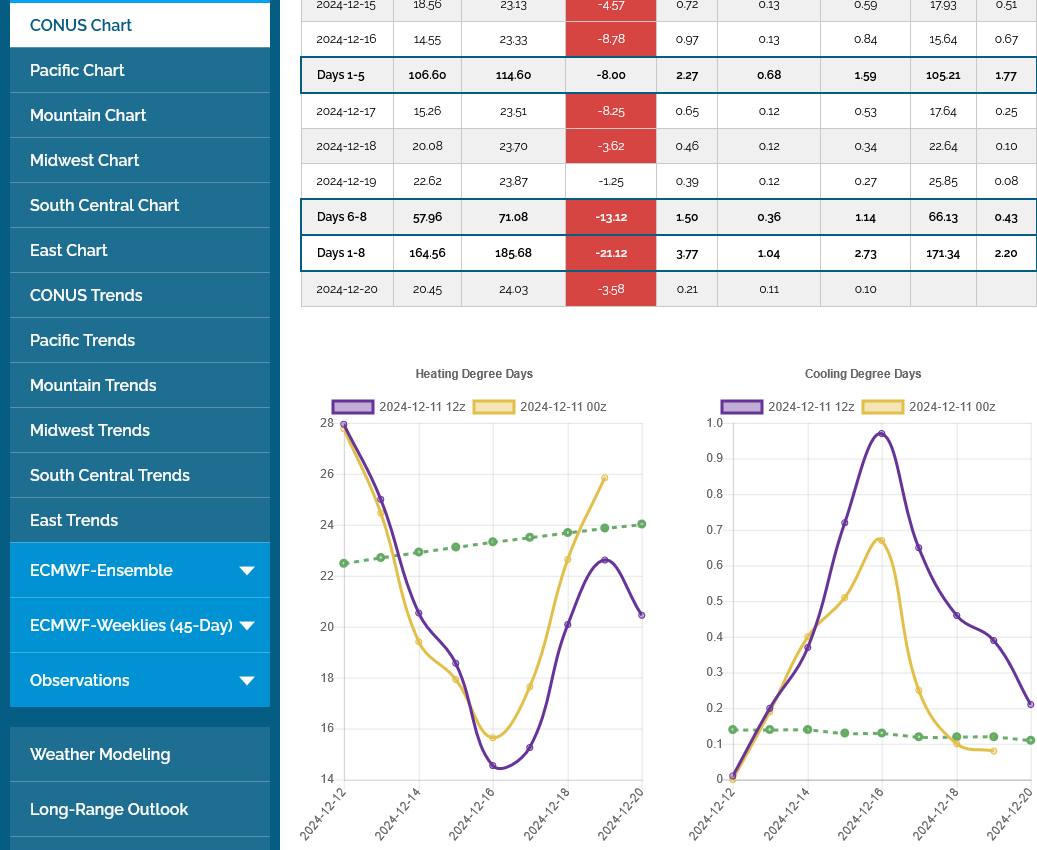
++++++++++++
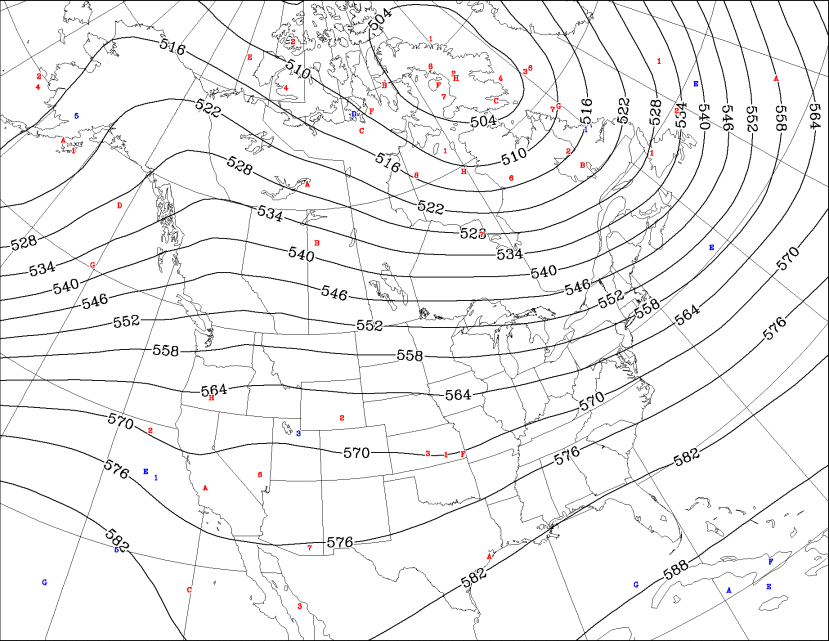
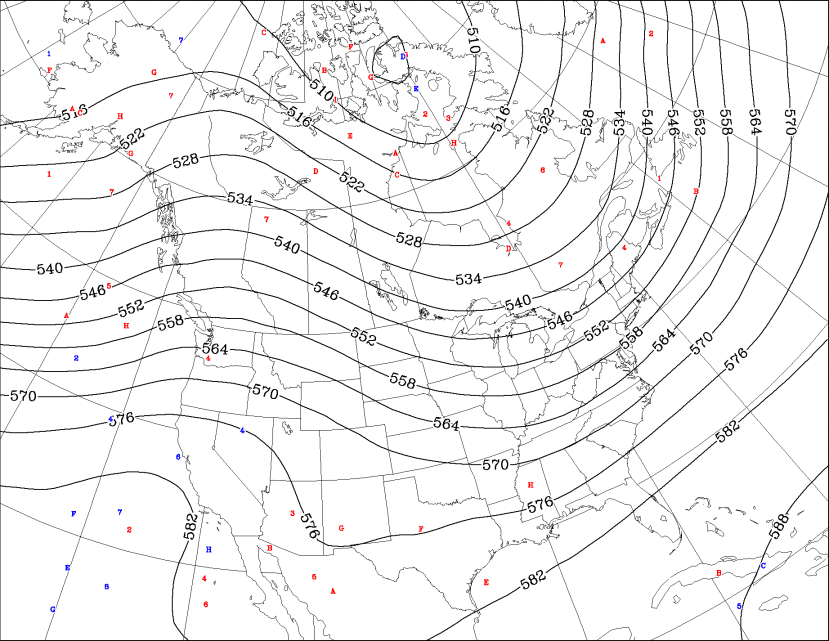
The Canadian ensemble model that was INCREDIBLY mild last night at 0z-first map has joined the other models and replaced zonal, west to east mild Pacific air with the less mild ridge-west/trough-east couplet in its 12z run.
https://weather.gc.ca/ensemble/charts_e.html?Hour=384&Day=0&RunTime=00&Type=gz
384h GZ 500 forecast valid on Dec 27, 2024 00 UTC
https://weather.gc.ca/ensemble/charts_e.html?Hour=384&Day=0&RunTime=12&Type=gz
372h GZ 500 forecast valid on Dec 27, 2024 00UTC
So far, you two weather experts are talking WEATHER.
Translate. Sell higher tomorrow?
tjc,
If I were back to trading and were already long, I’d strongly consider selling to go flat and take a nice profit. Now going short would be another story/would be too risky now for me. But I’m always flat these days lol.
Hi tjc,
I let the weather models tell me what to do. Your idea might work on a very bullish EIA number spike higher at 9:30 am if the weather models are all decidedly mild(er).
But here's the thing. The market will react to the milder weather models as they're coming out which is often the best time to put on a position.
There are various scenarios that can play out at that point. If the market sells off after the milder overnight models are out........cover BEFORE the report or risk a spike higher against you.
However, if the report is bullish and we spike higher AND the 12z GEFS run coming out just after that is COLDER, you will get run over because the market will ADD TO the bullish EIA gains. So the bottom line is that once the EIA report is out of the way, traders long for it will be out and we trade weather again.
I am neutral right now based entirely on the models flip flopping on the upcoming pattern. NG DOES react strongest to cold in the first half of the heating season because sustained cold still has the greatest potential to drawdown storage......which is at near record highs but that will erode to just below the top of the 5 year range tomorrow.
In February, you need even more extreme cold to provide speculators with the incentive to buy because WInter is running out(unless storage has already plunged and production has been cut=bullish underlying fundamentals).
++++++++++
1 way to use this strategy was to consider selling on the day session close today when we were at 3.4, near the highs because the guidance was coming out milder.
And hope the EE model coming out will also follow that trend.
The 12Z EE is Aleutian Low central Dec 16-26. Assuming it has a clue, this wouldn’t be a mild pattern for the E 1/4 of the US. It has only two really torchy days, 12/16-17. Other days are from modestly AN to MB. In addition to the current Arctic high coming down, the run has two more. This doesn’t average out to be mild by any means.
NG is near multiday highs close to 3.40, 11% above where it was just 29 hours ago!
Thanks, Larry! That is correct for the Eastern US which will be closest to average. The rest of the country would average out to be pretty mild.
The 12z HDDs and surface weather maps had a technical failure for the EE products. However, the last maps for 500 mb and 850 temps at the end of the period are looking pretty chilly for the East and even the upper Midwest.
Agreed about the mild rest of country on the EE. But doesn’t NG focus on the E 1/4?
The 0z GEFS model was cold and gave Ng a spike to new highs. Then the EE came out mild at the end of 2 weeks and we spiked down.
The 6z model changed to look more mild, like the EE late in week 2 and NG was hit real hard with a huge selling spike Lower.
unless that changes, the highs are in.
Hey Mike,
Based on my eyeballs, I wouldn’t have thought there was a trend change from colder to warmer in the ensemble consensus (GEFS/EE). Did the HDD in week 2 drop substantially on the 0Z EE and 6Z GEFS?
Maybe i was wrong about the highs being in if the EIA is super bullish. However, any upward spike to new highs won't last if the guidance is anything like the much milder models at the end of week 2 in their last solution.
The 6z GEFS was -5 HDDs vs the 0z GEFS.
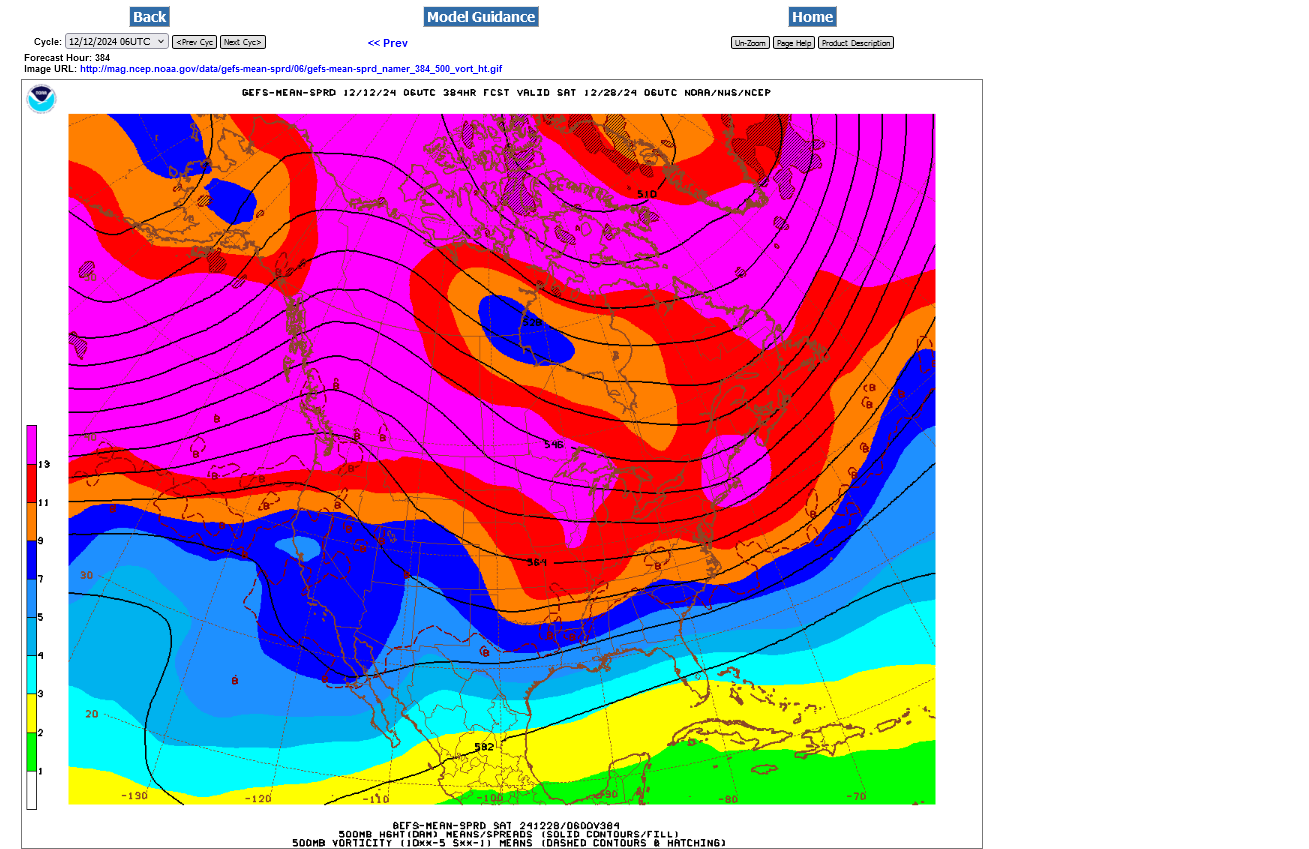
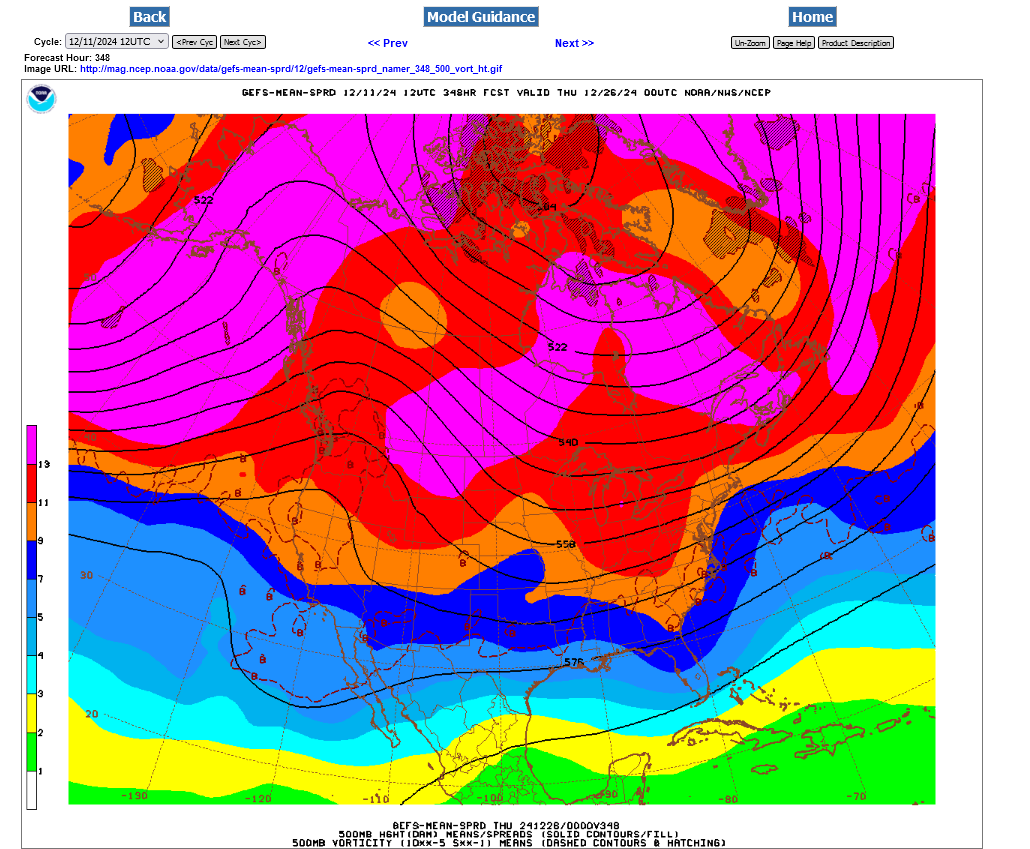
Here's a comparison of the last, more bearish 500 mb map of the 6z GEFS vs the more bullish 500 mb map from 12z. The amplitude of the ridge-west/trough east couplet is much greater at 12z but has was flattened out at 6z. There is more cross polar flow at 12z and more zonal flow at 6z.
850 mb temps are around 3 deg. C warmer in Chicago at the end of the period.
1. 6z GEFS-500 mb 12-12-24
2. 12z GEFS-500 mb(yesterday 18 hours earlier) 12-11-24
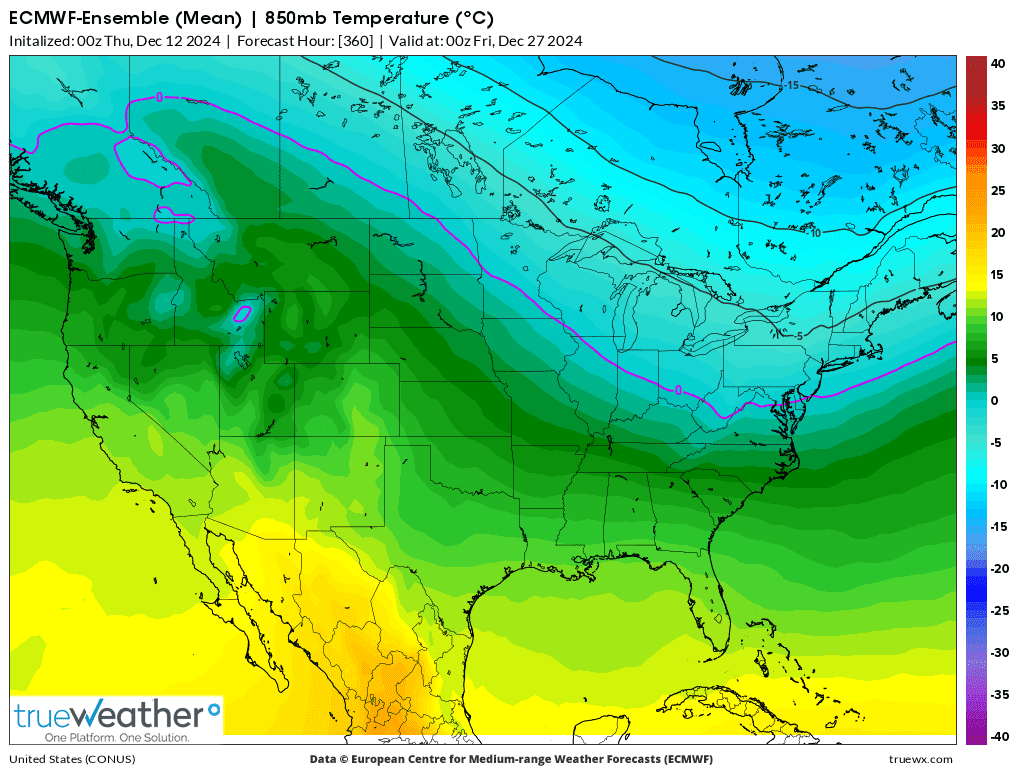
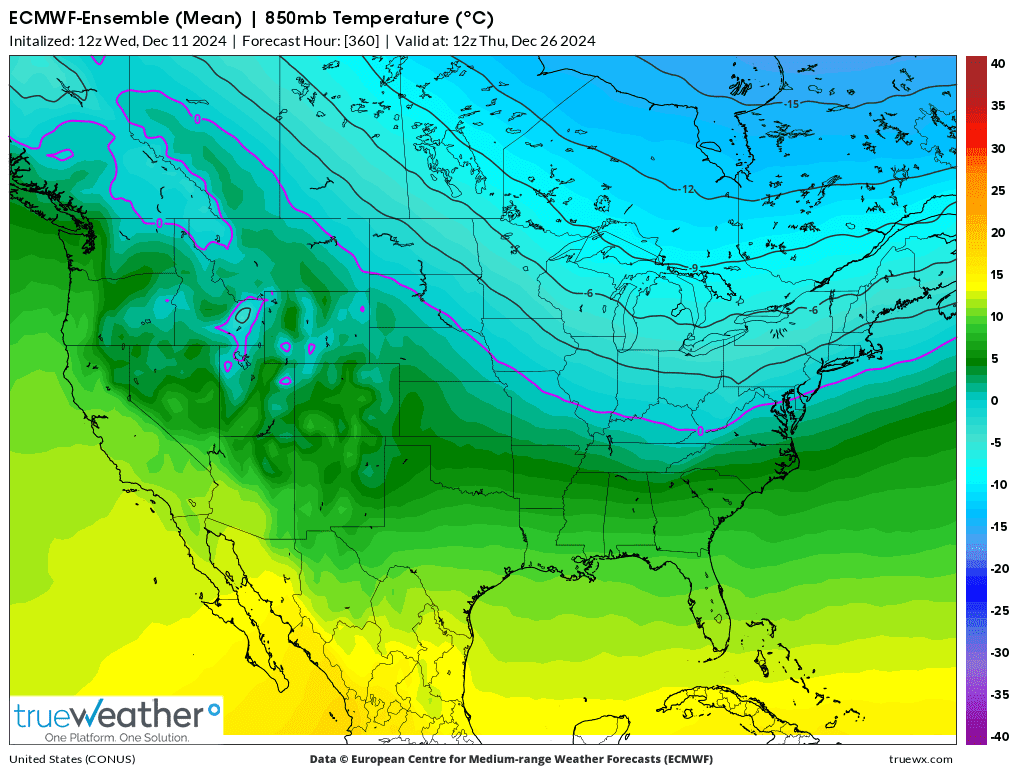
Below are the last 2 solutions of the EE for the 850 mb temps.
1. Last, MUCH milder 0z run-12-12-24 with warmer air spreading from west to east
2. Colder 12z run 12-11-24. Note the location of the 0 Deg. C isotherm in purple is much farther south and west.
EIA: BULLISH! I actually sold the initial spike at 3.42, then put in a protective buy stop at 3.4 when it dropped lower and got lucky for $180/contract because its making new highs and I'd be behind by $450/contract.
My point in stating this is that ng is extremely volatile and my confidence is low and for me, anytime I am ahead on a trade here is time to put in a protective stop.
OK, its back to where I got in.
If the guidance is milder again with the 12z runs, NG will be toast with higher confidence.
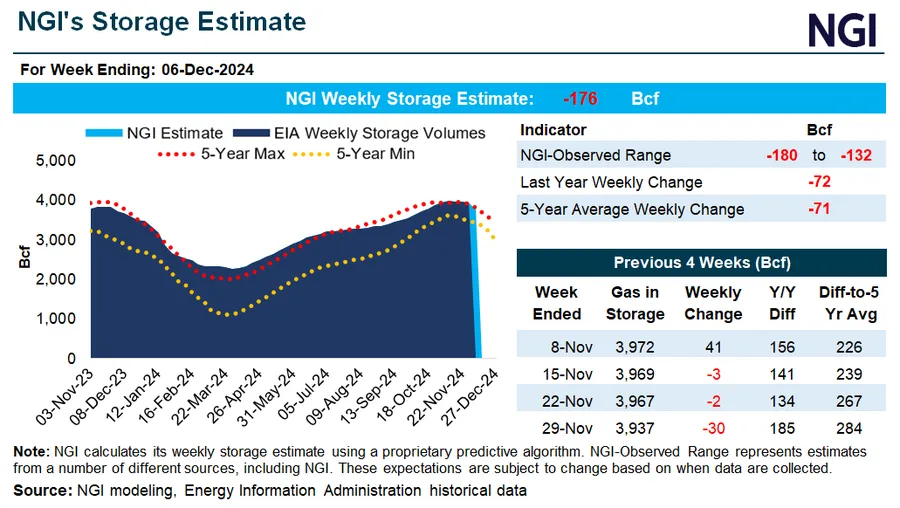
-190 Bcf is huge for this early in the Winter. Do you know what was expected, Larry?
for week ending December 6, 2024 | Released: December 12, 2024 at 10:30 a.m. | Next Release: December 19, 2024
| Working gas in underground storage, Lower 48 states Summary text CSV JSN | |||||||||||||||||||||||||
|---|---|---|---|---|---|---|---|---|---|---|---|---|---|---|---|---|---|---|---|---|---|---|---|---|---|
| Historical Comparisons | |||||||||||||||||||||||||
| Stocks billion cubic feet (Bcf) | Year ago (12/06/23) | 5-year average (2019-23) | |||||||||||||||||||||||
| Region | 12/06/24 | 11/29/24 | net change | implied flow | Bcf | % change | Bcf | % change | |||||||||||||||||
| East | 856 | 914 | -58 | -58 | 862 | -0.7 | 859 | -0.3 | |||||||||||||||||
| Midwest | 1,055 | 1,115 | -60 | -60 | 1,063 | -0.8 | 1,035 | 1.9 | |||||||||||||||||
| Mountain | 282 | 289 | -7 | -7 | 244 | 15.6 | 212 | 33.0 | |||||||||||||||||
| Pacific | 302 | 310 | -8 | -8 | 289 | 4.5 | 270 | 11.9 | |||||||||||||||||
| South Central | 1,251 | 1,310 | -59 | -59 | 1,222 | 2.4 | 1,207 | 3.6 | |||||||||||||||||
| Salt | 340 | 362 | -22 | -22 | 335 | 1.5 | 335 | 1.5 | |||||||||||||||||
| Nonsalt | 911 | 948 | -37 | -37 | 886 | 2.8 | 872 | 4.5 | |||||||||||||||||
| Total | 3,747 | 3,937 | -190 | -190 | 3,680 | 1.8 | 3,582 | 4.6 | |||||||||||||||||
| Totals may not equal sum of components because of independent rounding. | |||||||||||||||||||||||||
Working gas in storage was 3,747 Bcf as of Friday, December 6, 2024, according to EIA estimates. This represents a net decrease of 190 Bcf from the previous week. Stocks were 67 Bcf higher than last year at this time and 165 Bcf above the five-year average of 3,582 Bcf. At 3,747 Bcf, total working gas is within the five-year historical range.
For information on sampling error in this report, see Estimated Measures of Sampling Variability table below.

Note: The shaded area indicates the range between the historical minimum and maximum values for the weekly series from 2019 through 2023. The dashed vertical lines indicate current and year-ago weekly periods.
++++++++++++++
Looks like this was the expected drawdown, with -180 being the top of the estimates, so -190 Bcf was a bullish surprise!
+++++++++++++
I continue to have a neutral stance on NG price direction and will be as fickle as the weather models are with their solutions, responding only to this key market/price determining factor.
The last models were LESS bullish which is where I'm leaning very slightly. In 2 hours, I might be MORE bullish.
NG is holding up well here after 10am, so traders are NOT sold (yet) on the milder overnight solutions.
+++++++++++++
Added:
12Z GFS is very cold in a good portion of the E/SE US most of 12/20-24, including a big SE snowstorm within that period. It is just an op run, but the model consensus has shown a consistent and growing signal for cold then and now the start of that period has gotten to within one week. It at least appears that NG reacted higher due to this. Mike, what say you?
12Z GEFS is also cold(er) so far (through 12/20).
Edit: 11:31AM CST: 12Z GEFS appears to my eyeballs to be coldest run yet for 12/20-22 with 12/23 running now.
Edit #2: 12Z GEFS has Aleutian Low in the mean, which is a +PNA/El Ninoish cold E US pattern, especially SE. Now coldest run into 12/24. NG hardly reacting so far to 12Z GEFS. Maybe because it has run up so much so fast earlier today, including reacting up to the 12Z GFS?
Edit 3: NG finally reverted to rising 11:48AM-12:05PM CST.
Exactly right on this last 12z run, Larry! There are numerous colder days in that period and 3 MUCH colder days that by themselves, tacked on around +12 HDDs.
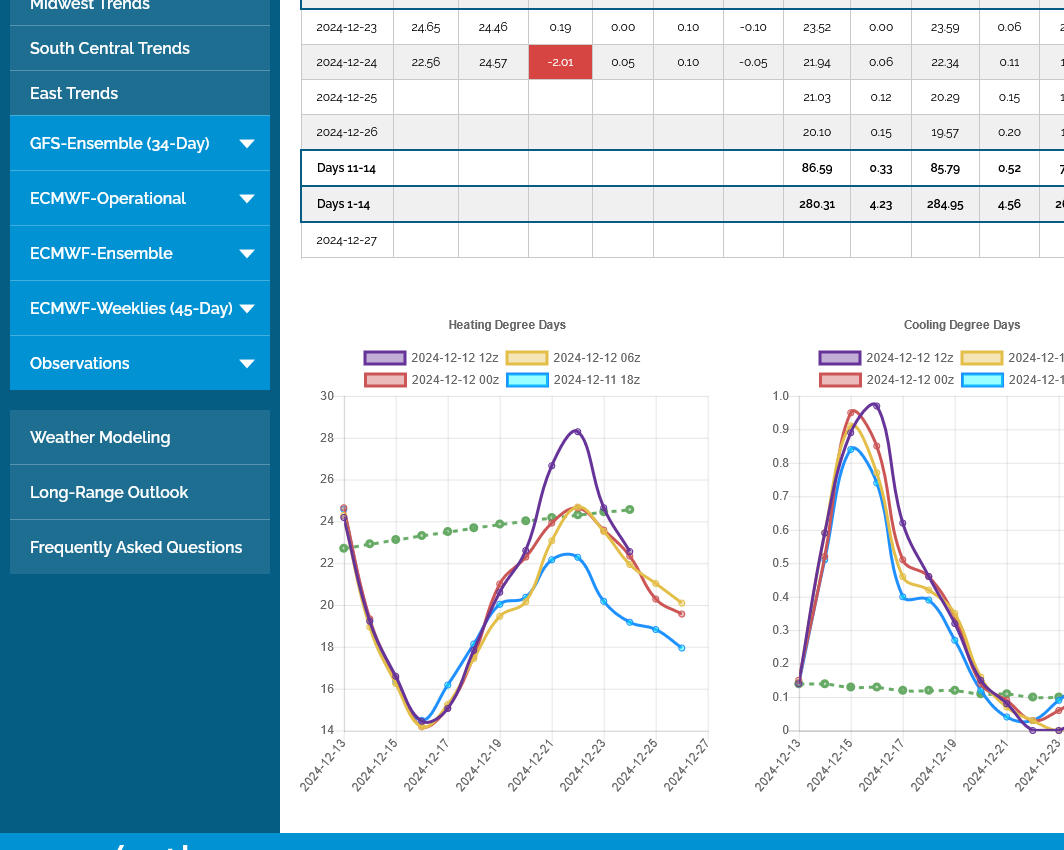
The Canadian model, though not AS cold as the GEFS is a bit less zonal and a bit more amplified with the ridge/trough couplet.
+++++++++++
We spiked $5,000/contract since the lows just 2 days ago, which is ALOT in such a short period and the pattern is not extreme by any means with just a few BELOW average days in the forecast THEN warming up to above normal temps again.
This last 12z GEFS came out +14 HDDs vs the previous 6z run that was milder. +10 HDDs vs the colder 0z run.
Again, this is generally from cold individual days for a slightly more amplified pattern in week 2...........that DOES NOT EVOLVE INTO A PATTERN CHANGE TO COLDER. Look at all the line above.........SPIKE UP, then DROPPING THE LAST FEW DAYS instead of getting colder. This suggests a transient period of the colder days which is just a break between a milder week 1 and a turning milder end of the period.
This is the last GEFS 500 mb map:
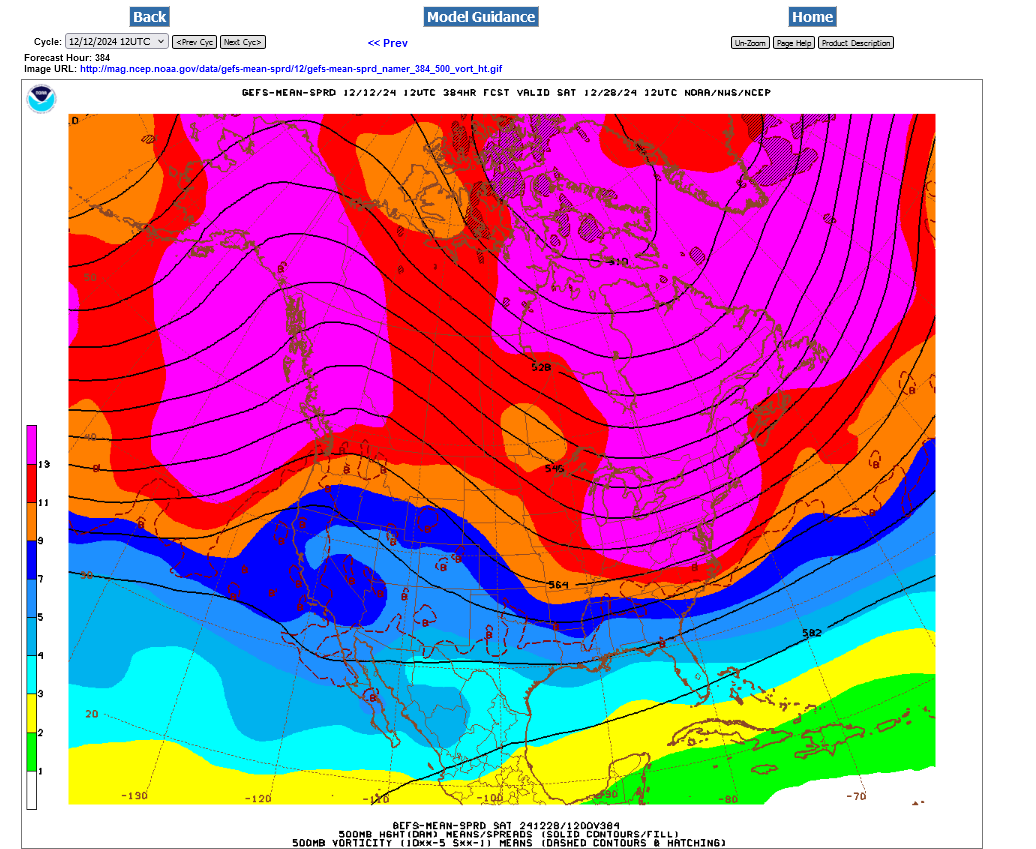
These were some key indicators based on the last 0z GEFS. The -AO is definitely looking potentially cold (so is the +PNA) but the NAO is still positive(but falling).
The 500 mb anomalies are not impressive for cold.
https://www.marketforum.com/forum/topic/83844/#83856
++++++++++
I got lucky with a 2 minute trade earlier today, being wrong about the overall direction of the market. That feels better than making more money and leaving almost all of it on the table. tjc knows all about this.
The moral of the story is that tight stops save you alot of money if you're wrong(or have low confidence) but cost you a ton of profits when you're right in a volatile market.
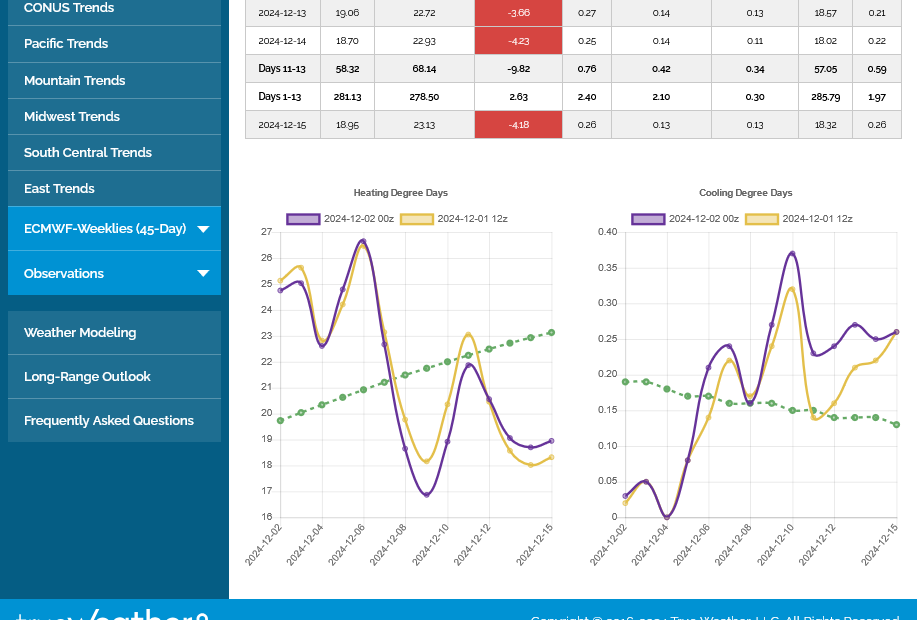
The last 18z GEFS was another + 6 HDDS but the market isn't reacting that great, still a tad lower over 30 minutes after this was out. The problem can be seen on the graph below. There is only a 4 day period of ABOVE HDD's(BELOW temps), then we go back down. The green dashed line is the slowly increasing average for HDDs.
The overall pattern matters with regards to longevity. A brief cold snap can be dialed in with +4,000/contract in the last 2 days of trading. Making individual days colder has only so much power if it turns milder again after those colder days.
SUSTAINED temps matter the most. Purple is the last run, yellow is the previous 12z run that also had the spike to colder than average early in week 2.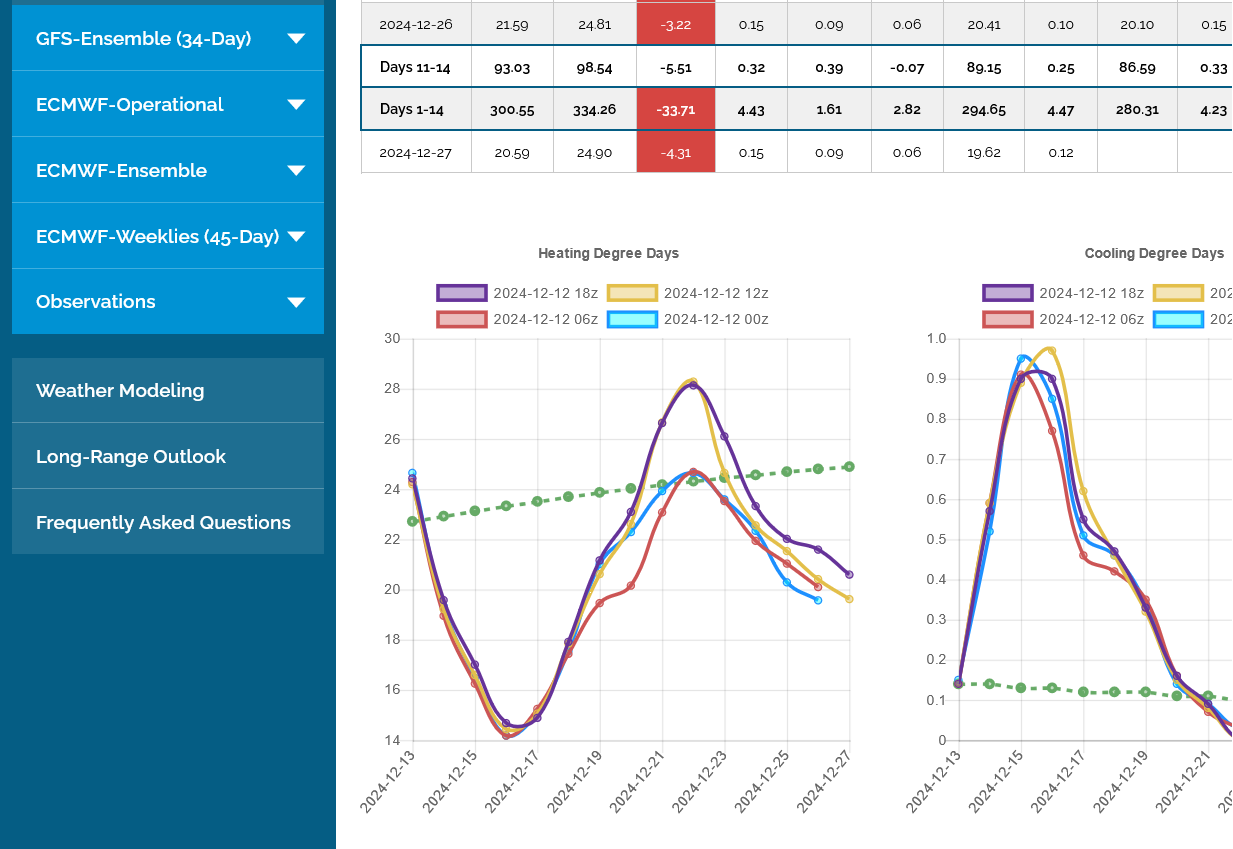
My eyes tell me that the 6Z GEFS was at least several HDDs warmer than the prior 3 runs. It looks like that lead to NG dropping >2% from ~3.48 to ~3.40 a couple of hours ago. Now it is even a little lower than that.
Thanks, Larry!
It was -7 HDDs vs the extremely cold 18z run but close to the same for the others.
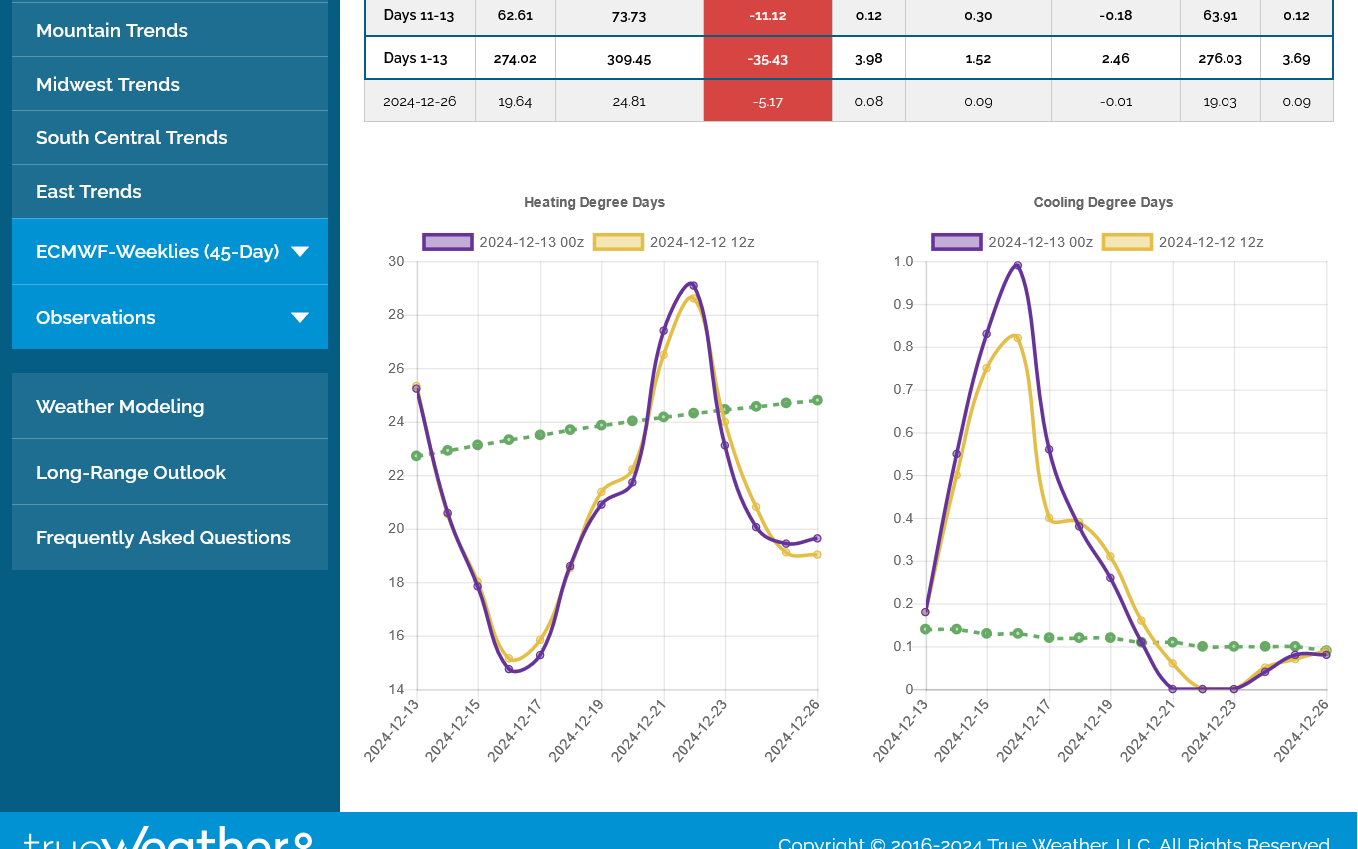
The 0z EE was -2 HDDs vs the previous 12z run.
Again, it boils down to this brief, frigid blast only lasting a few days, then going back to milder. That cold blast was dialed in the previous 2 days. Since the end of the forecast is ADDING MILDER DAYS because of progression, its increasingly bearish. Last 0z EE below in purple on the left. Mimics the previous 0z run but just a smidgen milder.
Thanks, Mike. I find it interesting that NG didn’t rise with the much colder SE US vs prior runs early week 2 (12/21-3) considering it was down >4% on the day. Instead, it actually dropped a little bit more. Strange imho. But then again, that’s the less reliable GFS and not the more reliable GEFS. But still I would have expected at least a little bounce then.
Edit: Now GEFS coming out and looks a bit colder overall at sfc in the E US late week 1 but with no NG bounce so far.
Thanks, Larry!
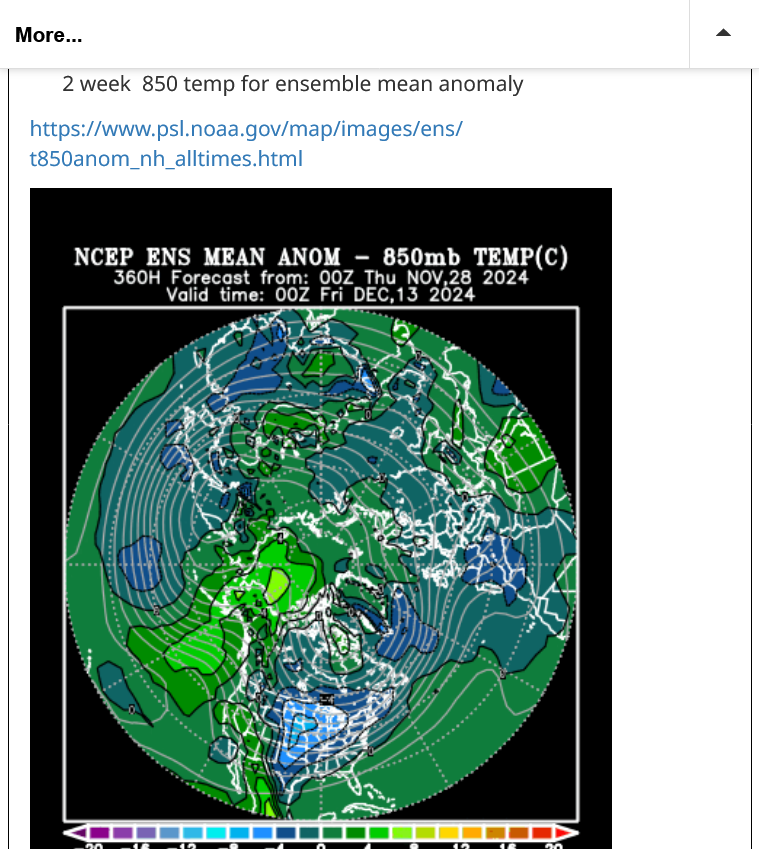
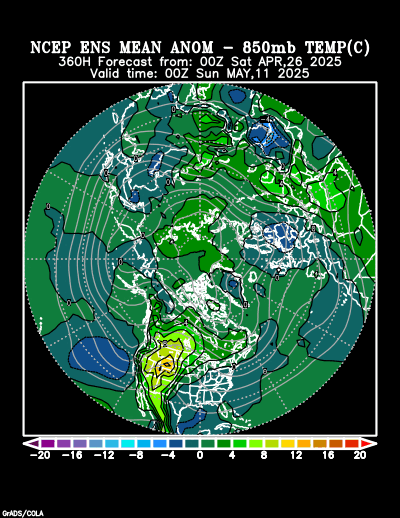
These are the anomalies in 2 weeks. As a futures market, the price is dialing in the expectations for the added days at the end of the forecast......VERY mild.
GFS ensemble mean anomalies at 2 weeks.
https://www.psl.noaa.gov/map/images/ens/z500anom_nh_alltimes.html 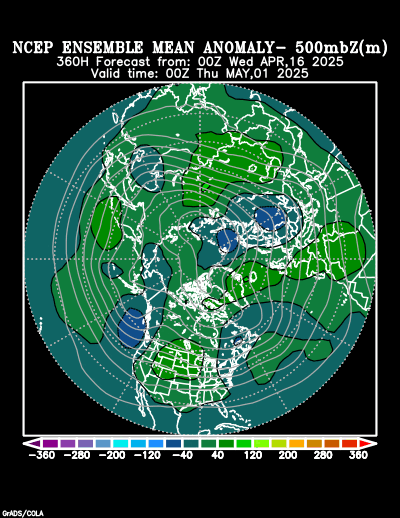
2 week 850 temp for ensemble mean anomaly
https://www.psl.noaa.gov/map/images/ens/t850anom_nh_alltimes.html
Thanks, Mike. But NG had already dialed in those expectations and was down >4%. That’s a good bit for one day. Thus I would have expected a slight bounce. But no loss for me since I haven’t resumed trading.
Thanks, Larry!
the market will be closed for 2 days so I think we are adding those additional mild days at the end of the forecast when we open on Sunday.
And it’s never aperfect fit for X days and X number of HDDs = X price change. Market fluctuations take into account a myriad number of factors including technical and emotional and fundamentals that usually end up with OVER reactions because traders will all pile on in the same direction with a mob like, emotional
mentality.
If that anomaly map above is anywhere close in late December then Ng is headed back to $3 and could drop below that if it continues in January.
12Z EE looks warmer overall vs 0Z. The 1st 10 days look similar, but days 11-15 clearly look warmer. Thus, I’m predicting that the total run HDDs will be a fair bit lower than 0Z EE.
I started this post 4 hours ago then got interrupted and forgot about it.
+++++++++++
Yes, the total was -6 HDDs because of the end of the period that matters the most.
The cold spike during the 6-10 day period was actually +1 HDDs(a tad colder). However even if it was more than that, the market dialed in that brief cold spike and more previously(and yesterdays VERY bullish EIA). Its now focused on trading the return to the much milder weather after it ends.
We are closing with a technical AND weather pattern that strongly favors a gap lower on the open Sunday Night.
The models will need to change to colder for that to NOT happen.
Still expecting the gap lower open tonight.
Question is…….how big will it be???
That would be a downside break away very bearish technical formation.
to negate that, we need the models to turn sharply colder late in the 2 week period.
Some of the solutions are trying to do that already but it’s not in time to save NG on the open.
and the real mild solutions are the majority which will put a great deal of downside pressure on NG. Maybe to $3 in short order.
The EIA storage report should be a tad bullsh but not nearly as robust as this last bullish surprise. And the market dialed that in over a week ago BEFORE it happened.
We got a modest gap lower of around -$450/contract.
Now what happens?
depends on weather models. Continuing mild and NG is toast.
getting colder again and Ng filling this gap negates this formation and turns it into a gap and crap BULLISH indicator. However, the reliability would be extremely low because we are only subject to the same volatility of the weather models that have low skill in predicting a pattern like this for 2 weeks out.
honestly, if I had been short over the weekend, I would have covered already because we’re getting enough initial buying to close some of the gap instead of it providing more selling incentive That would have added to initial losses.
The weather models will decide where we go the rest of the week!
I’m starting a new thread due to this one’s length: NG 12/15/24+