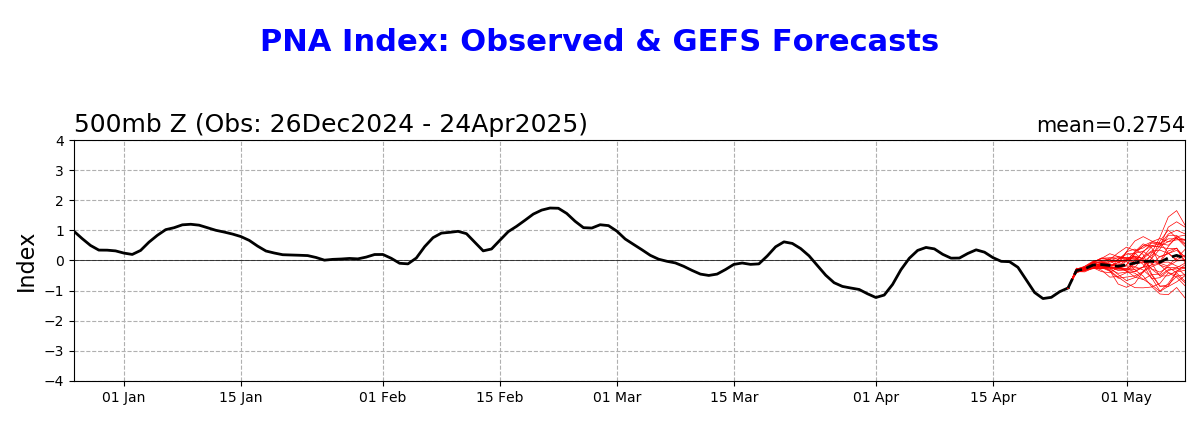
Based on the GEFS chart’s PNA mtd as well as the 0Z GEFS 14 day PNA prog, we have a chance to break the all-time record (since 1950) +PNA for a non-Nino Dec. I estimate based on dailies that the (tabular equivalent) MTD is ~~+1.8. The prog avg (tabular equiv) for the next 2 weeks is near that meaning the progged MTD through Dec 27th is ~~+1.8. *Keep in mind that the tabular equivalent is ~~twice the dailies.* Also, keep in mind that the 10 day GEFS progs have verified significantly too low since late Nov as they’ve averaged only ~half as high as verifications.
Current highest tabular Dec +PNA for non-Nino:
2020: +1.58
1960: +1.46
1985: +1.39
2005: +1.38
2000: +1.23
Highest tabular Dec +PNA for El Nino:
2006: +1.86
1969: +1.84
1963: +1.77
2002: +1.59
1986: +1.37
0Z GEFS prog through 12/27 and mtd: ~+1.8:
Based on the GEFS chart’s PNA mtd as well as the 0Z GEFS 14 day PNA prog, we have a chance to break the all-time record (since 1950) +PNA for a non-Nino Dec. I estimate based on dailies that the (tabular equivalent) MTD is ~~+1.8. The prog avg (tabular equiv) for the next 2 weeks is near that meaning the progged MTD through Dec 27th is ~~+1.8. *Keep in mind that the tabular equivalent is ~~twice the dailies.* Also, keep in mind that the 10 day GEFS progs have verified significantly too low since late Nov as they’ve averaged only ~half as high as verifications.
Current highest tabular Dec +PNA for non-Nino:
2020: +1.58
1960: +1.46
1985: +1.39
2005: +1.38
2000: +1.23
Highest tabular Dec +PNA for El Nino:
2006: +1.86
1969: +1.84
1963: +1.77
2002: +1.59
1986: +1.37
0Z GEFS prog through 12/27 and mtd: ~+1.8

Tabular monthly PNA 1950+:
https://www.cpc.ncep.noaa.gov/products/precip/CWlink/pna/norm.pna.monthly.b5001.current.ascii.table
Next post will explain why this progged strong Dec +PNA favors a +PNA continuing through Jan….
As stated above, the 5 highest tabular Dec +PNAs for non-Nino on record (2024 progged to have good chance to be new highest):
2020: +1.58
1960: +1.46
1985: +1.39
2005: +1.38
2000: +1.23
Where were the subsequent Jan tabular PNAs for these non-Nino high +PNA Dec?
2021 +0.19
1961 +1.41 (4th highest on record for non-Nino)
1986 +0.97 (tied for 7th highest on record for non-Nino)
2006 +0.43
2001: +1.51 (3rd highest on record for non-Nino)
Avg Jan for these 5: +0.90
So, a +PNA in Dec tends to carryover into Jan for non-Nino. Three of the 5 did strongly and one weakly. The other (2020-1) went to neutral. So, none even went to a weak -PNA.
Further followup:
So, the above suggests a good shot at a +0.75+ PNA in Jan. The following 9 non-Nino Jans since 1950 had a +0.75+ PNA (all cold ENSO except RONI neutral 1961 and 1981):
Year/PNA/E US temps
1961 +1.41 cold
1981 +2.42 cold
1984 +0.97 cold
1985 +1.63 cold
1986 +0.97 normal
2001 +1.51 normal
2011 +1.29 cold
2014 +0.97 cold
2022 +1.01 cold
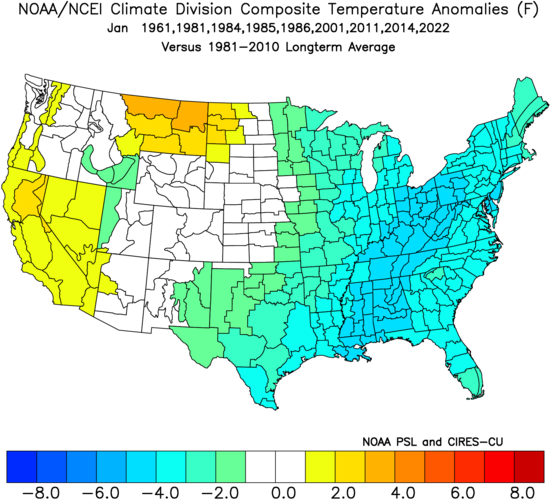
So, the current cold and strongly +PNA Dec has totally changed my thinking for Jan using the Dec to Jan analog method to a good shot at much colder than I originally thought based on models.
Wonderful thread, Larry.
I actually look at this index, as well as others every day but didn't realize that we were near a record. I would say that the record for the month of December is mainly from the extraordinary persistence/sustained +PNA for an unusually long period with ZERO dips.
See below.
You're PNA graph did not copy for the last month, Larry.
https://www.marketforum.com/forum/topic/83844/#83856
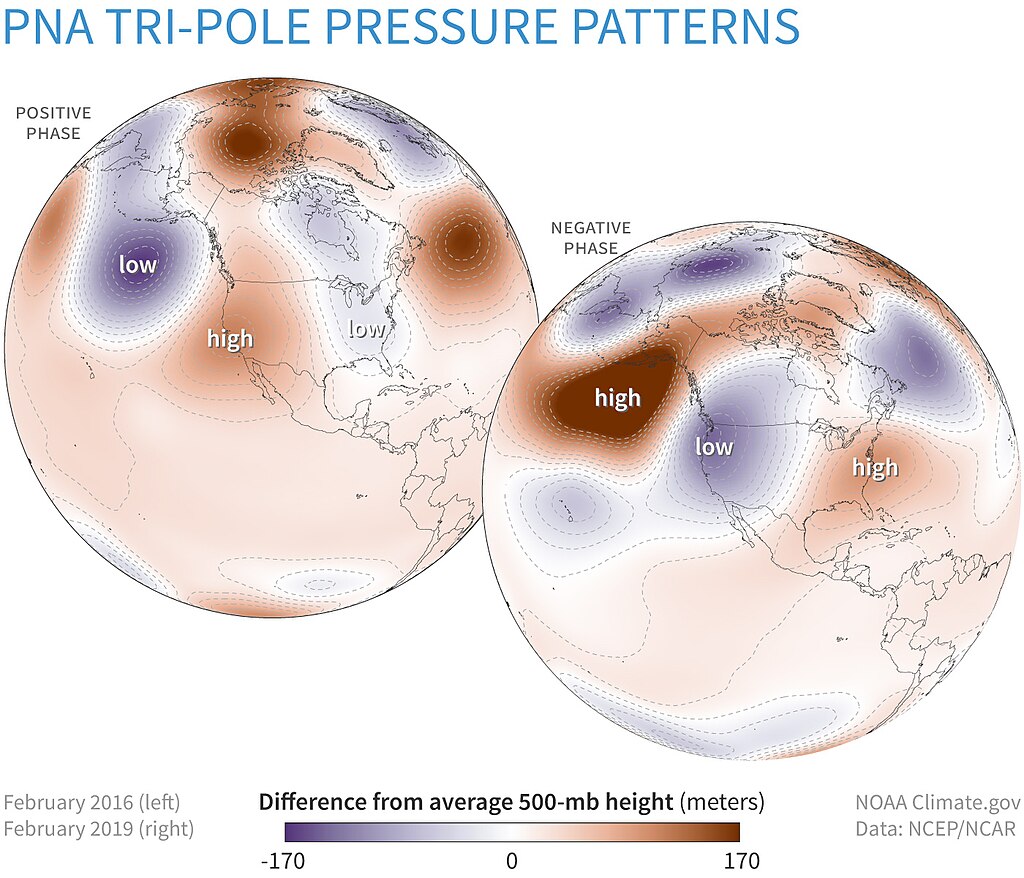
Arctic Oscillation Index, North Atlantic Oscillation Index, Pacific North American Index.
https://www.cpc.ncep.noaa.gov/products/precip/CWlink/daily_ao_index/ao.shtml
https://www.cpc.ncep.noaa.gov/products/precip/CWlink/pna/nao.shtml
https://www.cpc.ncep.noaa.gov/products/precip/CWlink/pna/pna.shtml
This +PNA has been part of the ridge/west-trough east couplet mentioned frequently the past several weeks.
Here it is peaking with the 500 mb anomalies of this next cold wave during the 6-10 day period.
Awesome discussion by this guy:
The pattern change to much colder in January will actually feature the +PNA dropping to near 0.
The greatest positive anomalies will be growing in EASTERN North America instead of western North America.
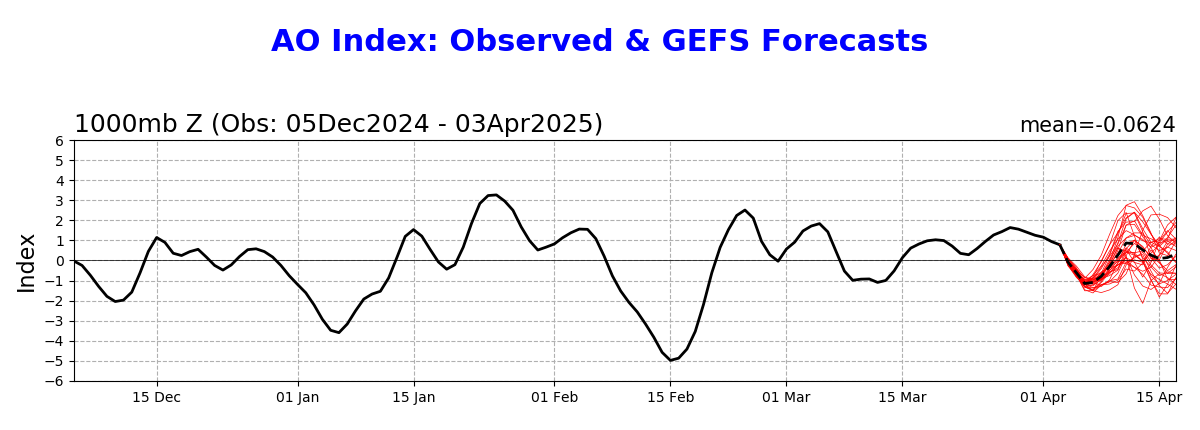
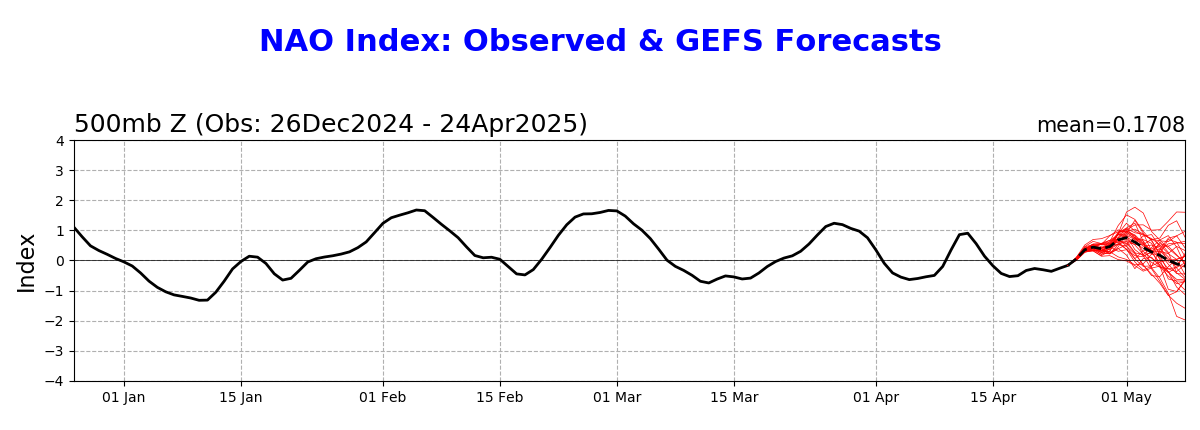
The MOST significant cold bullish changes feature the NAO AND ESPECIALLY THE AO dropping into negative territory!
Arctic Oscillation Index, North Atlantic Oscillation Index, Pacific North American Index.
https://www.cpc.ncep.noaa.gov/products/precip/CWlink/daily_ao_index/ao.shtml
https://www.cpc.ncep.noaa.gov/products/precip/CWlink/pna/nao.shtml
https://www.cpc.ncep.noaa.gov/products/precip/CWlink/pna/pna.shtml
++++++++++++++++++++++++++++++++++++++++++++
GFS ensemble mean anomalies at 2 weeks.
https://www.psl.noaa.gov/map/images/ens/z500anom_nh_alltimes.html 
2 week 850 temp for ensemble mean anomaly
https://www.psl.noaa.gov/map/images/ens/t850anom_nh_alltimes.html
PNA plunging!
AO and NAO both going negative, foreboding extreme cold in the US.
By metmike - April 30, 2022, 8:57 p.m.
The reason for the positive anomalies in Canada is that this pattern is favorable FOR DRAINING THE COLD from high latitudes to mid latitudes. When the cold in high latitudes is drained, it started as the coldest air in the northern hemisphere because there's no sunshine up there at this time of year.
Air that replaces it (from lower latitudes) will be MILDER compared to the seasonal of bitter cold in the high latitudes.
We’re still on pace for a shot at a new record high Dec PNA for non-Nino. Current projections are close to the +1.58 of 2020.
Current highest tabular Dec +PNA for non-Nino:
2020: +1.58
1960: +1.46
1985: +1.39
2005: +1.38
2000: +1.23
I see that.
Models shift the ridge in the west farther west, causing the + PNA to drop.
Also aiming More cold towards the Midwest and Plains than before.