
Please continue posting NG stuff in here. Thanks.
On this Sun evening: only a modest downward open Sun night as Mike noted (~2%).
Thanks, Larry!
Previous thead:
https://www.marketforum.com/forum/topic/108738/
Just to carry over the last several posts here:
By metmike - Dec. 13, 2024, 5:59 p.m.
I started this post 4 hours ago then got interrupted and forgot about it.
+++++++++++
Yes, the total was -6 HDDs because of the end of the period that matters the most.
The cold spike during the 6-10 day period was actually +1 HDDs(a tad colder). However even if it was more than that, the market dialed in that brief cold spike and more previously(and yesterdays VERY bullish EIA). Its now focused on trading the return to the much milder weather after it ends.
We are closing with a technical AND weather pattern that strongly favors a gap lower on the open Sunday Night.
The models will need to change to colder for that to NOT happen.
++++++++++++
By metmike - Dec. 15, 2024, 5:30 p.m.
Still expecting the gap lower open tonight.
Question is…….how big will it be???
That would be a downside break away very bearish technical formation.
to negate that, we need the models to turn sharply colder late in the 2 week period.
Some of the solutions are trying to do that already but it’s not in time to save NG on the open.
and the real mild solutions are the majority which will put a great deal of downside pressure on NG. Maybe to $3 in short order.
The EIA storage report should be a tad bullsh but not nearly as robust as this last bullish surprise. And the market dialed that in over a week ago BEFORE it happened.
++++++++++++
By metmike - Dec. 15, 2024, 6:02 p.m.
We got a modest gap lower of around -$450/contract.
Now what happens?
depends on weather models. Continuing mild and NG is toast.
getting colder again and Ng filling this gap negates this formation and turns it into a gap and crap BULLISH indicator. However, the reliability would be extremely low because we are only subject to the same volatility of the weather models that have low skill in predicting a pattern like this for 2 weeks out.
honestly, if I had been short over the weekend, I would have covered already because we’re getting enough initial buying to close some of the gap instead of it providing more selling incentive That would have added to initial losses.
The weather models will decide where we go the rest of the week!
Temps for this Thursday's EIA report at 9:30pm Central. Maybe a tad bullish, unlike the bullish surprise last week.
https://www.cpc.ncep.noaa.gov/products/tanal/temp_analyses.php
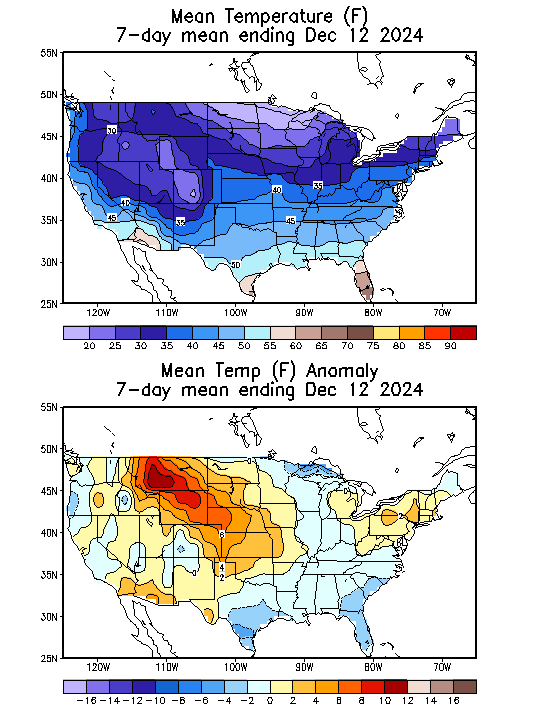
0Z European ensemble was a whopping -14 HDDs so down we go(went)!
The GEFS was colder mid period but with a milder finish.
+7 HDDs for the 0z.
With the gap lower last evening not being filled p, it remains as a downside break away gap signature.and VERY bearish.
Added 10am: The 6z GEFS was -7 HDDs the previous colder 0z run and back to the 18z run but the market bottomed after that and came all the way back to make a new high by a few ticks at the bottom of the gap but could not fill the entire gap, as sellers aggressively stepped in. So a SMALL part of the gap remains open.
I was surprised at last evenings strength after the lower open(not following thru selling) but REALLY surprised at how we came back to the bottom of the gap after the mega bearish 0z EE.
Considering how well NG held up after the much milder 0z EE last night, I suspect colder models will fill the gap.
12z GEFS was the same as the very mild 6z and -9 HDDs vs the colder 0z. So bearish!
The 12z Canadian model is a bit bullish in my view. These are the maps at 384h hours....end of period.
https://weather.gc.ca/ensemble/charts_e.html?Hour=384&Day=0&RunTime=12&Type=gz
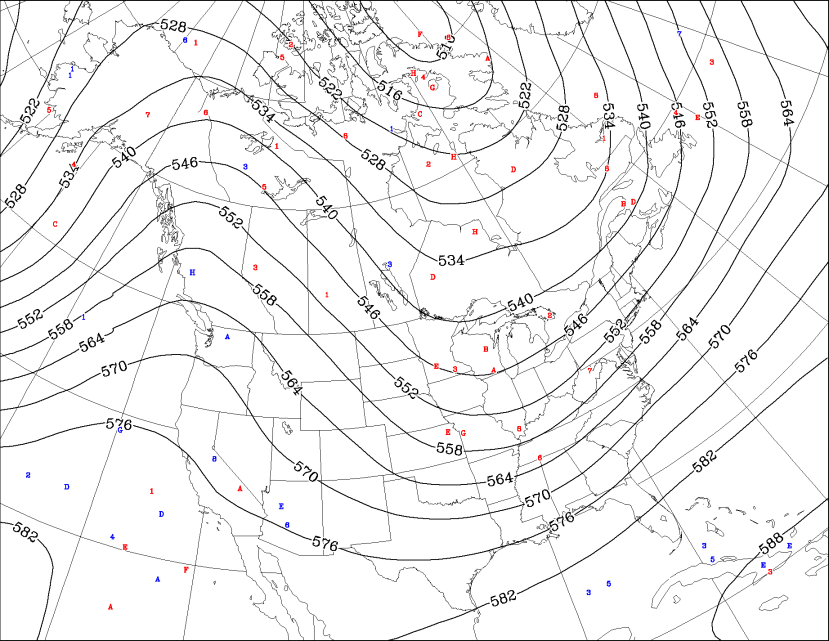
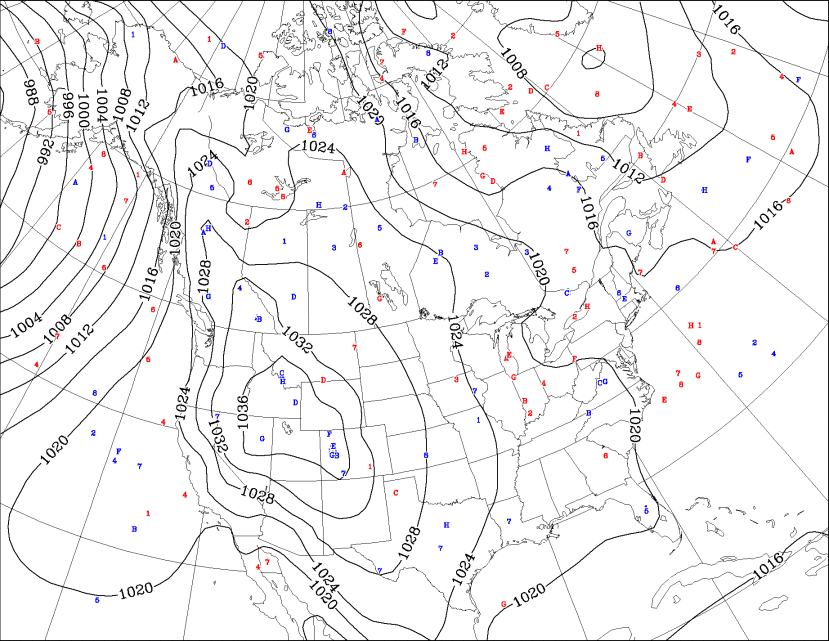
The Last 12z EE was another -2.6 HDDs VS the already mega bearish, previous 0z run.
Im surprised we are still near the opening price from Sunday Night! The gap has NOT been closed completely however, so it’s still a downside breakaway signature/formation on the price charts. We are also just above the mid point of the range for todays daily trading bar.
Hey Mike, I’m educatedly guessing NG got a 1% pop late in the 0Z EE due to:
1) A somewhat notable overall increase in HDD vs 12Z per me eyeballs. Week 1 appeared fairly unchanged with probably a modest drop. But week 2 clearly to me was notably colder due mainly to late week 2. How much did the complete run’s HDDs increase by vs 12Z? Or am I mistaken? What say you?
2) The end, itself, looked bullish with a reforming +PNA.
You are correct, Larry. The 0z EE was slightly warmer early in the period and slightly colder at the end. Overall HDDs compared to the 12z run were almost the same though. This DID give ng a bit of strength at the time, which settled back. The 0z GEFS did something similar.
Then, just before 6am NG had a big spike higher that filled the gap(in the midst of the 6z GEFS coming out milder at the end-made no sense) and took out a ton of buy stops, followed by a sustained selling surge that took us down $1,000/contract in an hour and now, just before 8am we are close to the lows for the week.
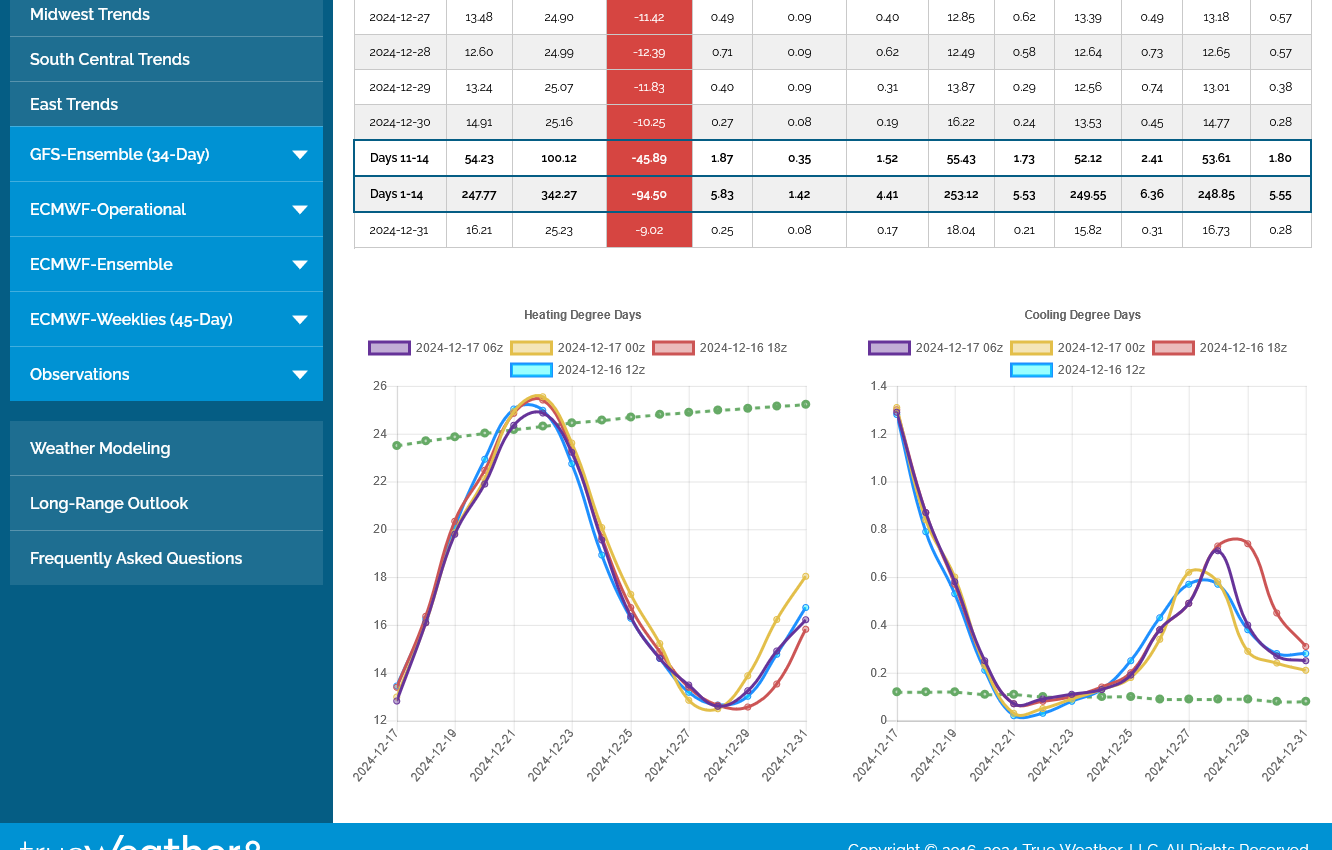
0s EE in purple on the left. 12z EE in tan.
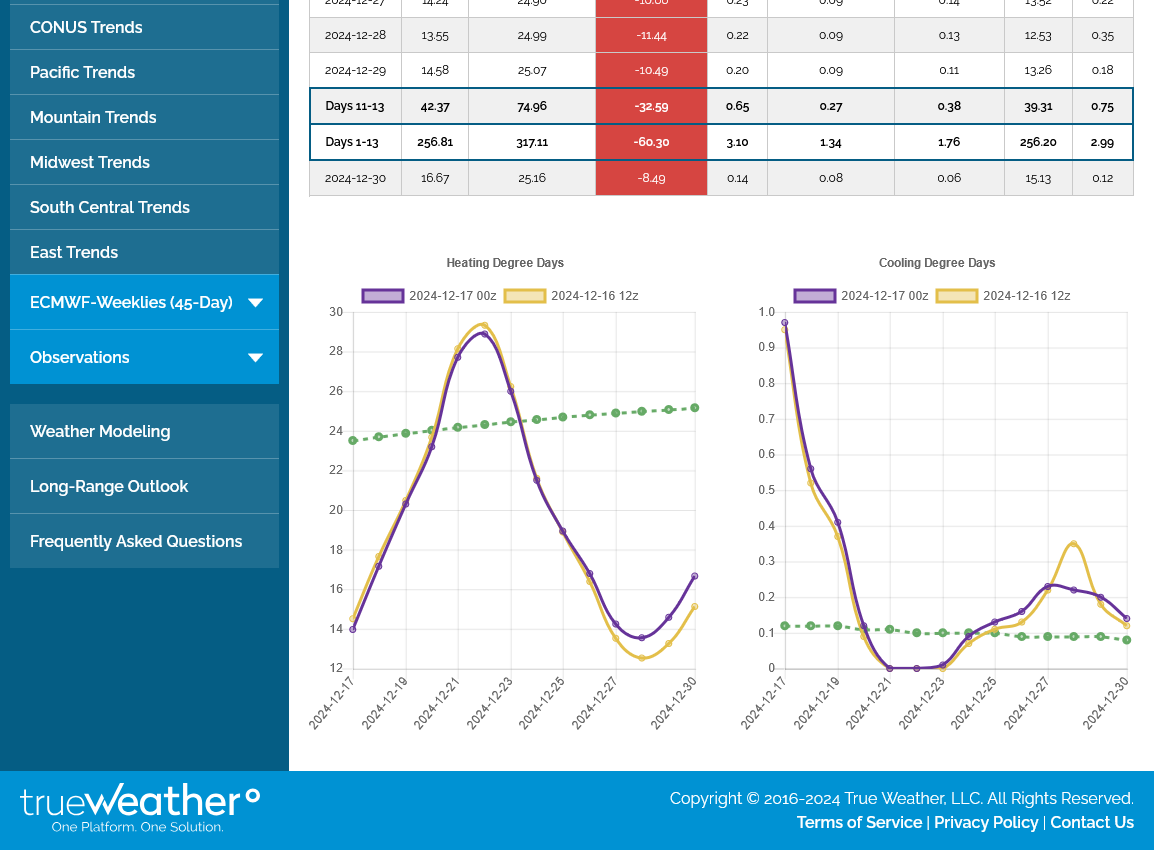
Last 6z GEFS in purple below. Colder 0z (at the end) GEFS in tan.
+++++++++
Indices and Anomalies at the end of 2 weeks:
Thanks, Mike.
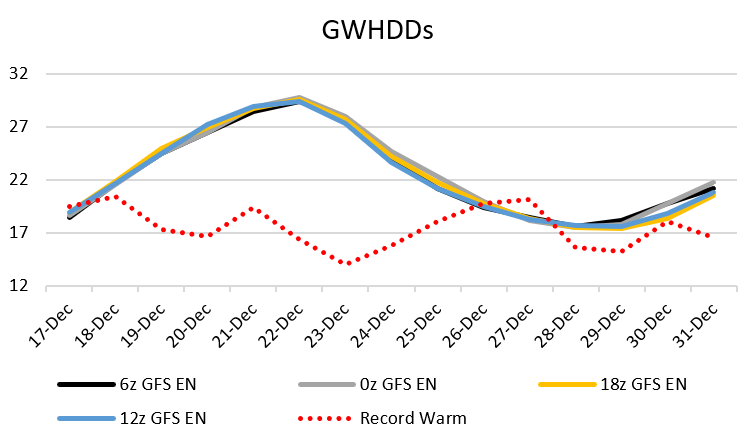
So, pop wted US HDDs per last 4 GEFS: absolute blowtorch most days through Dec 31st with only ~13/day Dec 27-9, which amazingly is a mere ~50% of normal to barely above that! The 13 is the normal for Nov 13th, a full 1.5 months earlier! So, if this prog is correct, we’ll be only at mid Nov normals for a few days late in Dec just before the expected end of month cooldown! I bet that is at least near a record low for pop wted US HDD then.
Do you have a source for what the record low US pop wted HDD are per each calendar day? I should note that these do run a little lower than Maxar’s, whose normals in late Dec are ~29 rather than 25 if I’m recalling correctly. But regardless, in relation to Maxar’s normals, I’m assuming that the GEFS prog is near their mid-Nov normals, too. So, perhaps Maxar has GEFS late Dec daily HDD prog at, say, 15. That would be my educated guess.
Thanks met and wx for this continuing conversation about NG . What is " pop wted US HDDs "? What is HDD prog?
Cutworm said:
What is " pop wted US HDDs "? What is HDD prog?
—————-
Hey Cutworm,
1. US population weighted heating degree days. These are more heavily weighted by the degree days of the E US due to higher population density and thus more heating energy usage there.
2. Prog is short for prognosis or forecast. I’m referring to the model’s forecasted HDD.
——————-
After seeing how low the progged HDD are, it really is surprising how well NG is holding up.
thanks just trying to learn about this and you guys are light years ahead of me.
YW, cutworm.
To all: My Maxar contact just emailed me this chart, which shows that the GEFS is predicting US pop wted HDD to be near or at record lows today as well as Dec 26-7 based on record dailies that go back to 1950:
that helps my understanding a lot
The last 15 minutes saw a >2% rise clearly due to a colder 12Z EE vs 0Z for 12/27-30 despite the temperatures remaining mainly warmer than normal. Helping it is a robust +PNA late.
Larry,
The 12z EE hasn't even started to come out yet.
The 12z GEFS and 12z Canadian model were not much different.
The 12z operational E model is over halfway out and similar to the previous one.
The +PNA has been the same feature all week.
12Z EE has been fully out on WxBell and mostly out on Pivotal.
What’s your source? TrueWx? If so, why are they so slow today? Are they always this slow?
It has to be the colder late EE. What else would have caused it to rise so sharply the last 30 minutes?
Wow, I can’t believe they would be this slow.
yes, this is always the time it comes,out. Time to get a new source!!
what’s the link to yours, Larry!
That’s weird!! Back when I was a TruWx subscriber, they came out about as fast as Maxar DD! Otherwise I wouldn’t have paid for it. What time does TruWx EE usually finish? What about GEFS? I’m confused. Something doesn’t seem right.
Pivotal: free https://www.pivotalweather.com/model.php?m=epsens
Even faster is WxBell but I can’t provide a link because it is pay. But you can get subscription for pretty low price.
Edit: NG up a whopping 17 cents (5+ %) last 70 minutes! Why so much? Colder late EE shouldn’t have been enough and most of that run still has well BN HDDs, regardless!
Was at chess practice at 1 of my 5 schools the last couple of hours.
Larry,
I'm shocked and grateful at the same time.
Like you, I always assumed they were the fastest. It explains some market reactions recently that suggested traders getting the EE earlier than before.
So apparently the EE is coming out earlier than before by a large amount of time, correct?
It's ok for you to provide the Weather Bell link here if you want.
Regardless, I'm going with them if they are the fastest.
If you hadn't made me aware of this, I would have been trading ng with a huge disadvantage for a long time!!
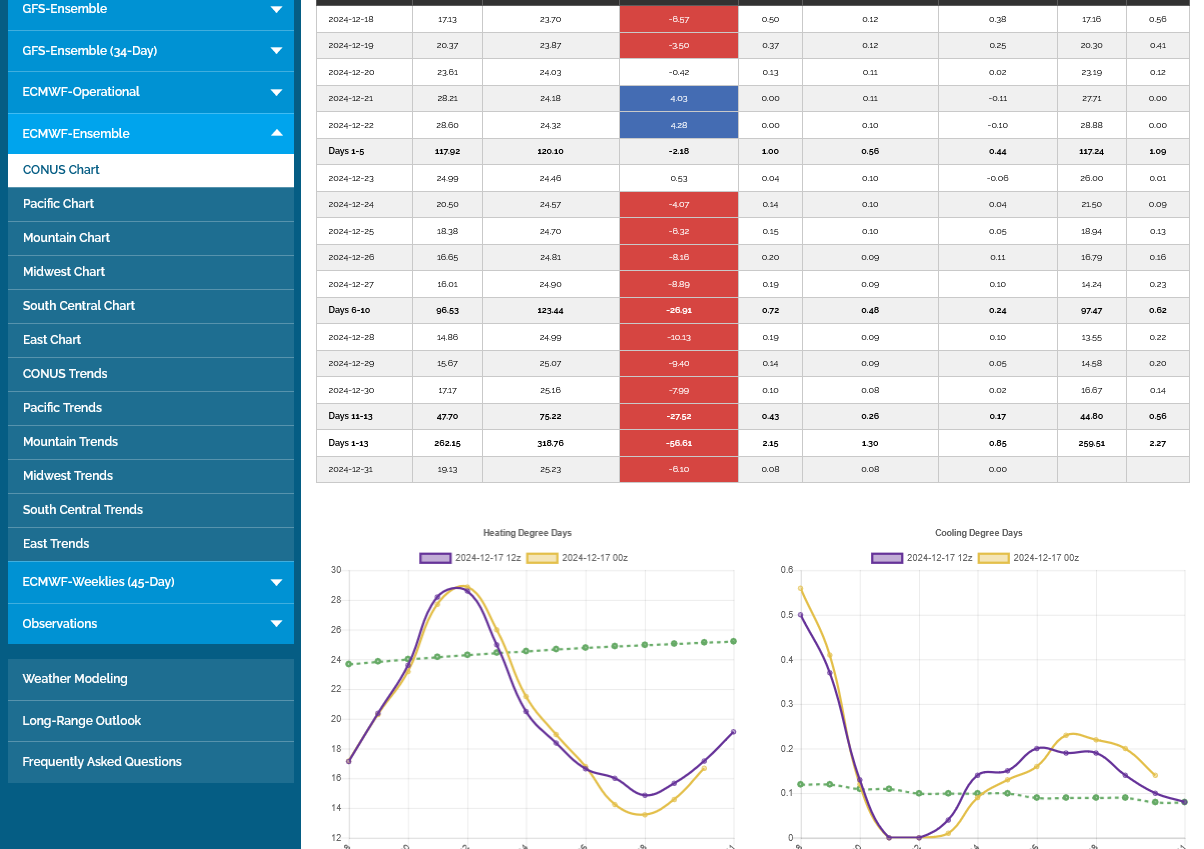
This was the 12z EE HDDs. +2.6 vs the previous 0z run, all at the very end of the period. I would have never guessed the reaction would be this powerful to the price. However, the market was refusing to sell off earlier on some pretty mild forecasts(acting better than expected as you also noted).
++++++++++++++++
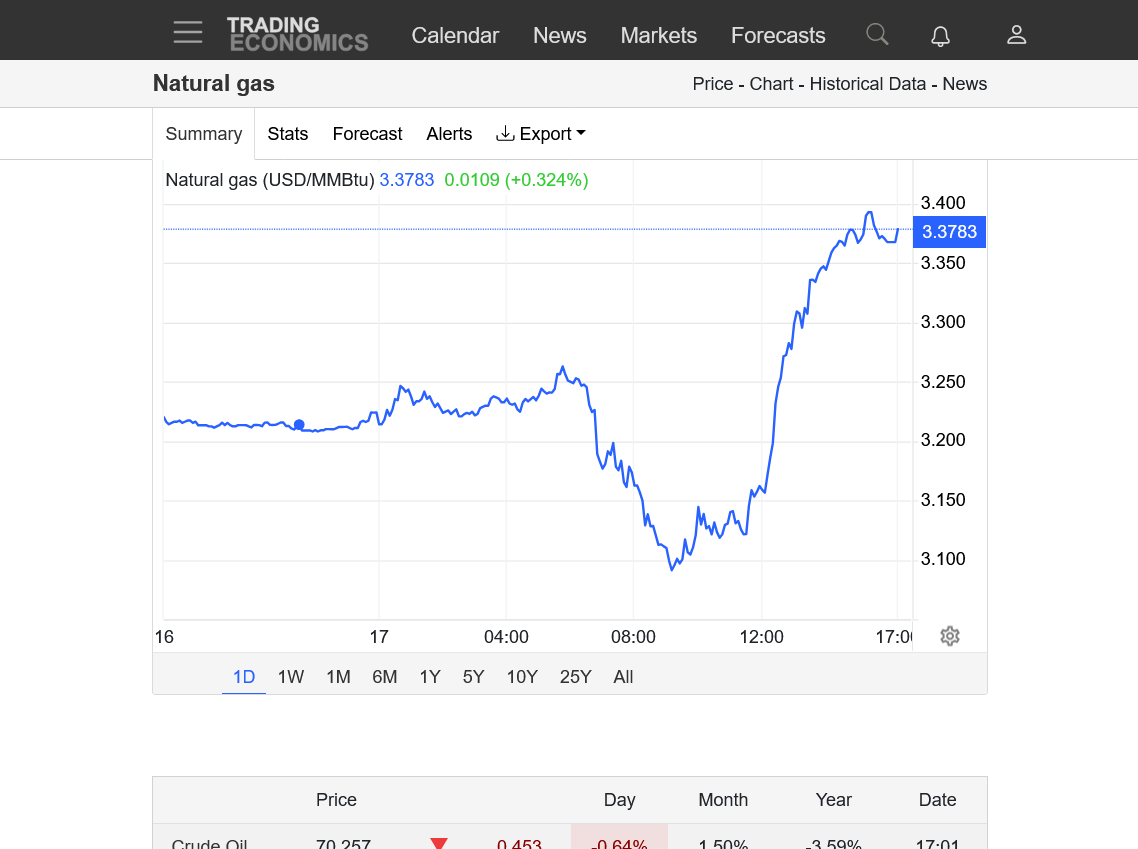
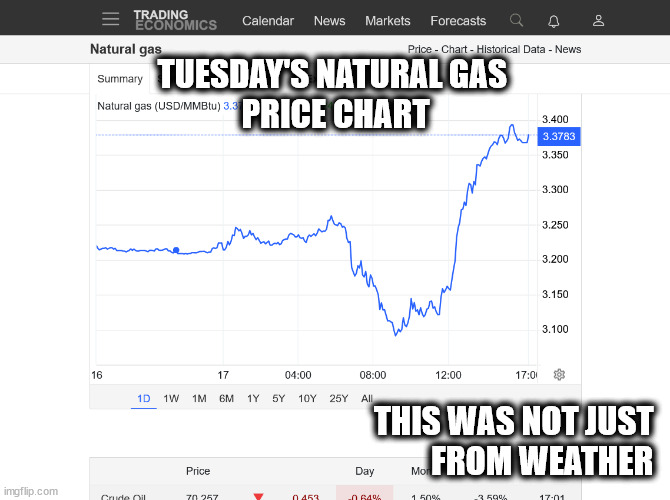
Who could have imagined the HDDs below would result in a +$2,500/contract reversal from down sharply to up sharply. It started at ~11:30 am. It wasn't just knee jerk. The buying continued strong for several hours.
What an insane reversal below on the 1 day chart!
https://tradingeconomics.com/commodity/natural-gas
+++++++++++++++++
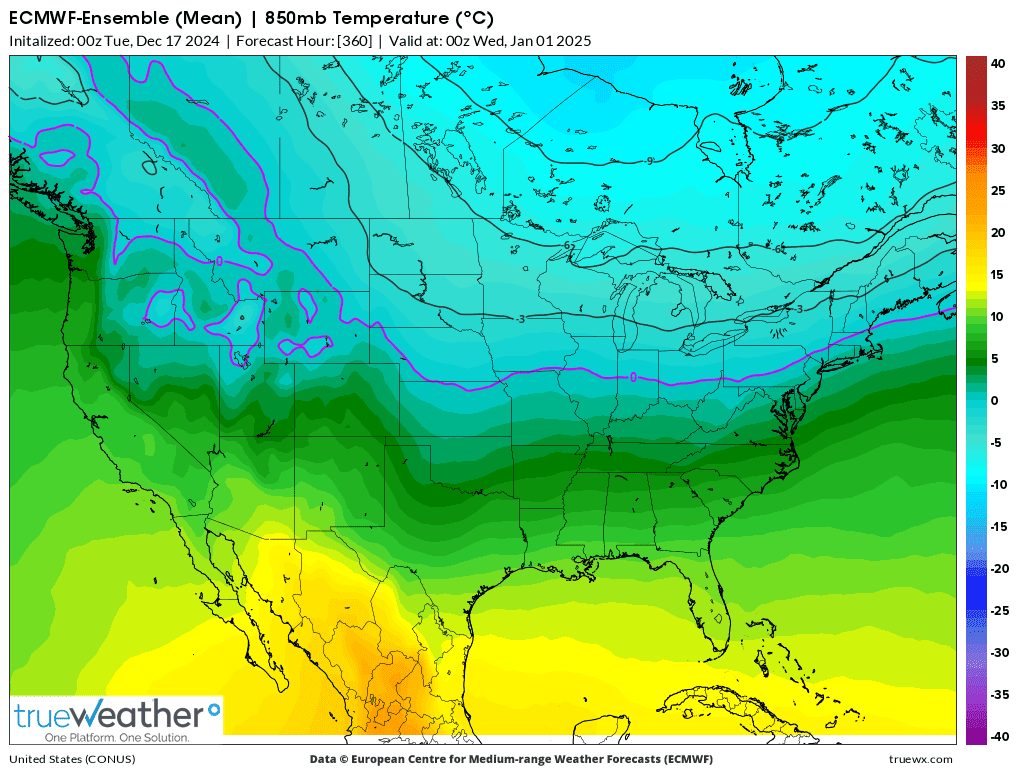
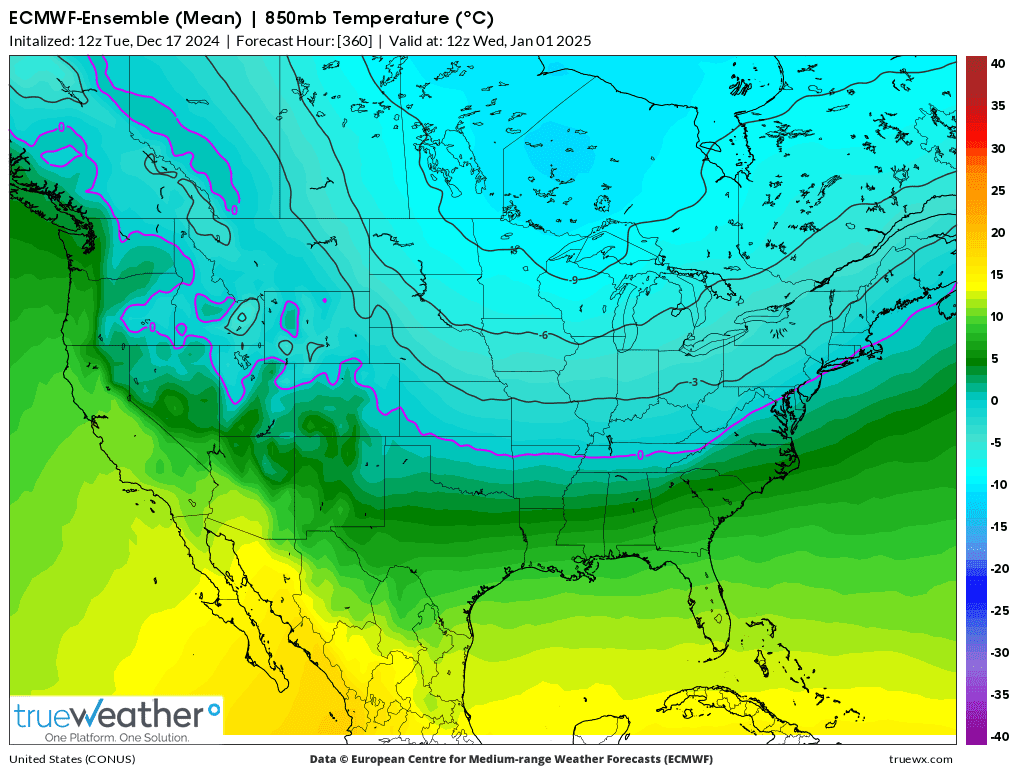
1. 850 temps at 360 hours from 0z EE. -2 Deg. C at Chicago.
2. 850 temps at 360 hours from last 12z EE, 12 hours later, -6 Deg. C at Chicago.
Hey Mike,
1. WxBell: https://www.weatherbell.com
2. How much did EE HDD rise? This huge upward reaction seems way out of line from just a few extra HDD late and that with still an overall very warm run. **Edit: never mind as I see you just posted it went up a mere 2.6.
3. Maybe something to do with increased LNG exports?? Always a wildcard nowadays.
4. I’m writing TruWx to see what they tell me about EE DD timing. I was actually considering becoming a subscriber again due to it being pretty cheap, but this could prevent that.
*Edit: LMAO, I emailed the CEO of the wrong company. I emailed Tru Weather instead of True Weather. Ooops. I didn’t know they both existed with such similar names!
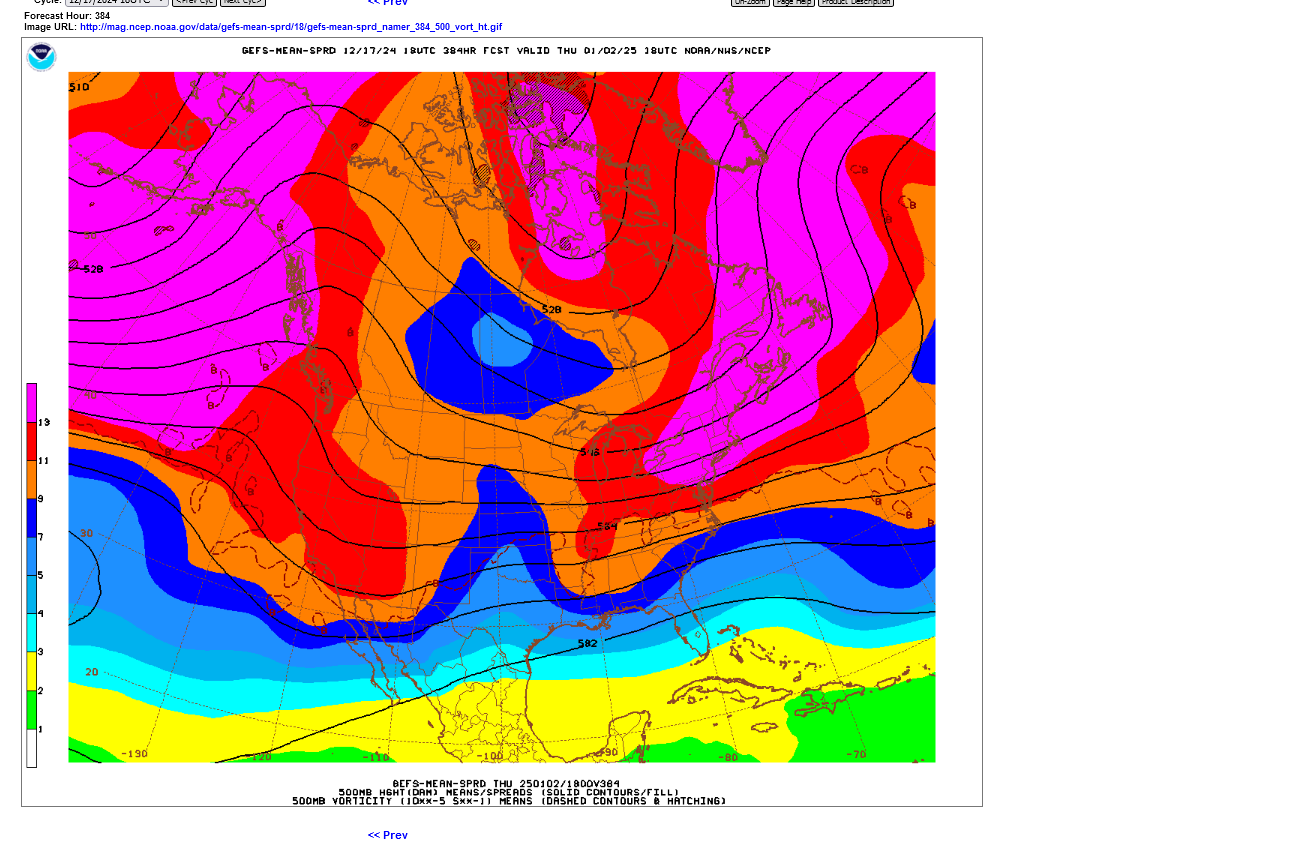
This was the last 500 mb map of this latest 18z GEFS. This is STILL BEARISH! Something else had to be causing the huge rally, even though the 12z EE seems to have triggered the start of the buying surge.
Did NG just rise 2 cents on colder late Euro op?
My service just started the European model.
larry, if you don’t mind sharing and to save me a ton of time that I’m lacking right now….what service are subscribing to at weather bell?
the GEFS was WARMER for the 2nd run in a row -2 HDDs on both runs.
Hey Mike,
“Premium” service. You’ll like the change maps.
By the way, EE almost finished and my eyeball based guess is that HDDs are fairly similar to 0Z. But the end is very slightly less bullish looking than 12Z although still has a bullish look. GEFS is ugly looking at end. CDN ens is pretty looking (bullish).
0z EE was -3.4 HDDS compared to the previous 12z run.
This means lower than the one 24 hours ago, when nat gas tanked. However as you mentioned, it’s the end of the period that the market is trading because that’s the one giving us the best clue about the month of January.
EE and Canadian models suggest a much colder trend in early January. GEFS says the complete opposite.
The colder versions would make it more exciting and what I would enjoy more (although I’m running a big chess tournamemtm on Jan 11th and a winter storm would reek havoc here in Evansville-result in rescheduling)
i can tell how much more you like the colder forecasts too.
My preference is not impacting my forecast, which is going to flip flop with the models, though leaning towards the cold january right now.
it will try to anticipate what the market will think.
yesterday, that was obliterated by the massive reversal that I would have never imagined from the amount of change on the weather maps.
if the GEFS is right, January could start out VERY MILD in many Places.
air masses coming from Canada would be very mild.
I’m still thinking NG is likely trading something else bullish that has nothing to do with wx. It is up way too much for that not to be the case imho. The wx being significantly more bullish than it was recently is highly questionable imho. If I had been trading it I’m confident I would have missed most, if not all, of this entire big rise since yesterday midday. I’m wild guessing it has something to do with LNG, my “favorite” factor lol.
NG being almost back to highs of the year (within 15 cents) makes no sense just based on wx. It is up nearly 10% from yesterday’s lows for goodness sakes! Sometimes, especially over the last few years as we know, it trades mainly nonwx factors like LNG.
Yes, I definitely prefer it be cold in winter here in the SE US in this warming world. Heat and humidity is increasing in dominance, which I don’t like.
Agree, Larry!
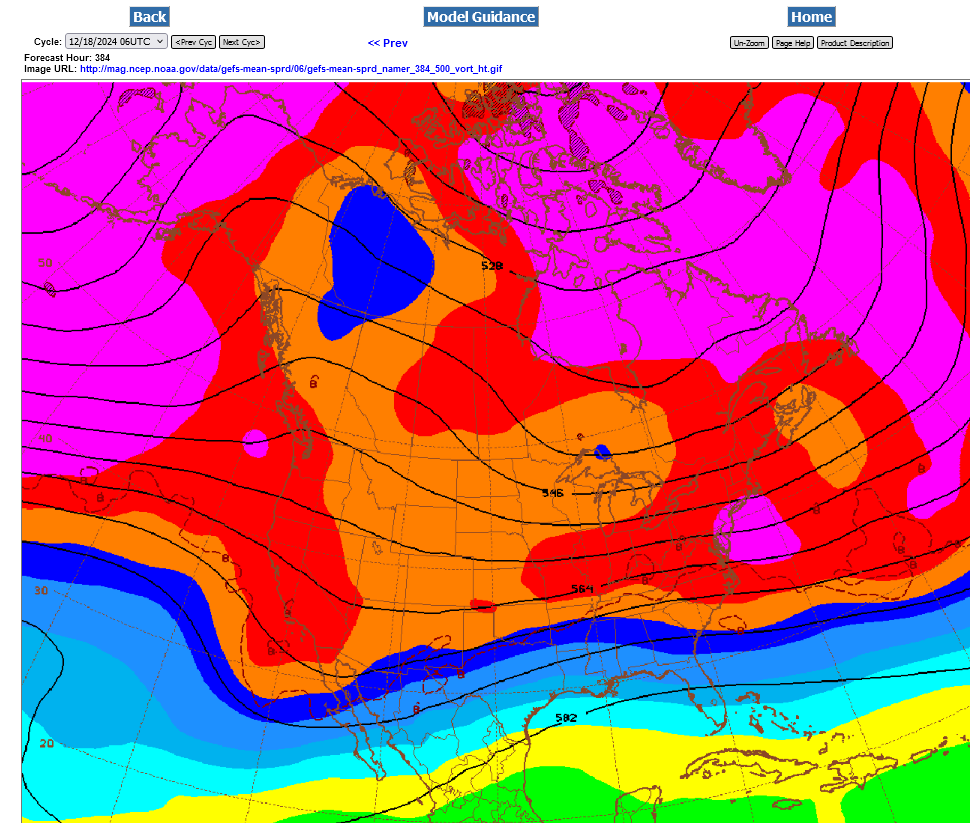
The other models are not like this but this last 6z GEFS is very bearish. It even has an upper level ridge building in the Southeast. The very weak ridge-west/trough-east couplet has a mostly, mild zonal flow component. No way a map like this justifies the huge move up yesterday and ng ADDING to the gains today.
It might be wrong, of course but something else must be up, like you said.
Larry,
Regarding LNG exports..........this bullish export demand study below, came out yesterday right when ng started it huge climb from SUSTAINED buying that lasted hours. As we've noted in the past, when its a reaction to 1 particular weather model(EE slightly colder at the end on 12z run), the move is extremely spikey. That was NOT the case yesterday.
https://tradingeconomics.com/commodity/natural-gas

December, 17 2024
Washington, D.C. – The U.S. Department of Energy (DOE) today released an updated study of U.S. liquefied natural gas (LNG) exports. DOE has been given the responsibility by Congress under the Natural Gas Act to evaluate the public interest of proposed exports to countries with which the United States does not have a Free Trade Agreement.
The U.S. liquefied natural gas export sector has experienced transformative and unprecedented growth in just a decade, with the first LNG exports from the lower-48 states commencing in 2016. DOE has authorized 48 billion cubic feet per day (Bcf/d) of natural gas for export, or nearly half of current domestic production.
Of this 48 Bcf/day in total authorized exports, 14 Bcf/d of associated capacity is now operating, making the U.S. the largest exporter of LNG in the world. Another 12 Bcf/d is under construction and expected to double present export volumes by 2030, at which time the U.S. will remain the top exporter, exceeding other countries by roughly 40 percent based on announced expansions. And a further 22 Bcf/d of capacity exports has been approved by DOE, but has not secured a final investment decision to begin construction.
Given these robust export commitments already made, and before considering additional applications that would take authorized U.S. natural gas exports beyond levels previously evaluated, DOE leadership recognized the need for a comprehensive update to ensure the most comprehensive and up-to-date analysis possible of market, economic, national security, and environmental considerations of different potential volumes of U.S. LNG exports.
Thanks, Mike! Who knows if that had a bullish influence though? Possible but it is general, long term, and likely already known by many.
————-
12Z GFS: colder week 2 may have pushed NG up a few cents
12Z GEFS: a tad bearish looking, if anything, through hour 204 with warmer than 6Z in E US
Thanks much, Larry!
I've been trading natural gas for over 3 decades. More than half that time, I made much of my living on Winter ng trades.
In 24 hours, NG rallied $3,000/contract in a key time frame for residential heating demand(late Dec/early Jan) with a forecast like this:
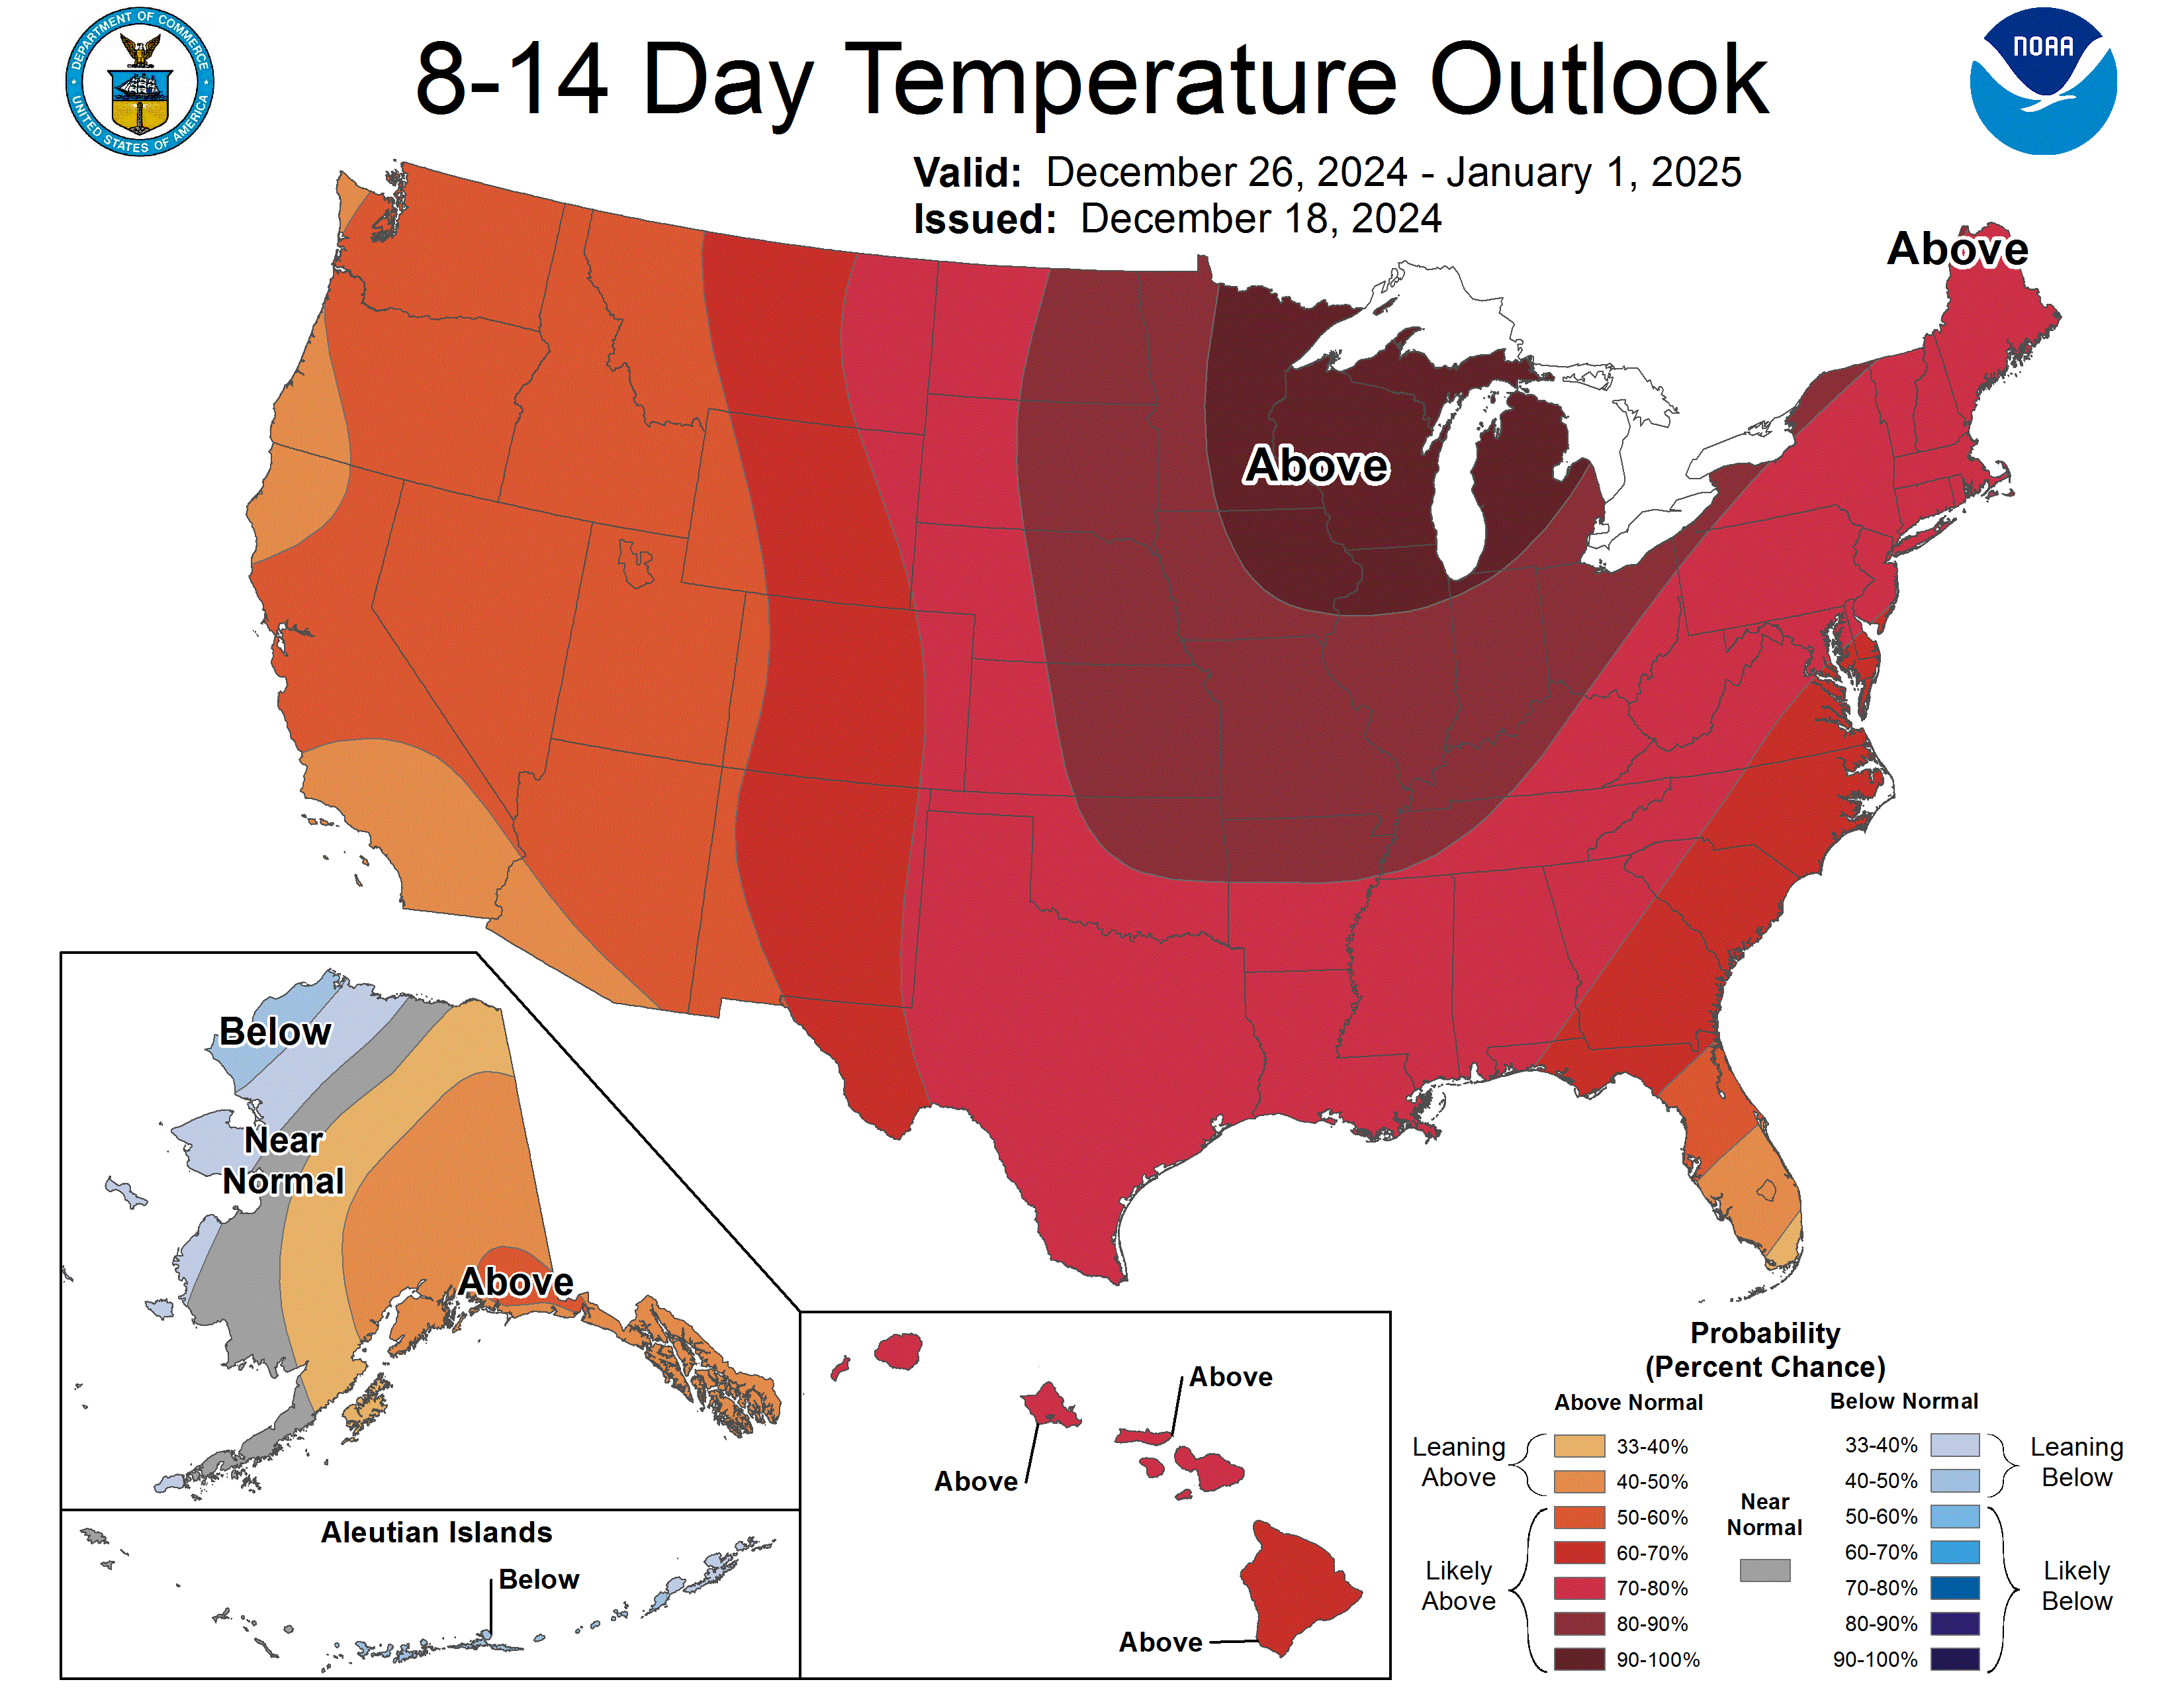
I never remember this happening previously and if it did, I WOULD REMEMBER because I would have lost a massive amount of money trading weather!
I can't remember every single big profit trade but I remember, crystal clear as a bell every single moderate loss and the major ones, like it was yesterday.
+++++++++++++
Was it from the cold january forecast?
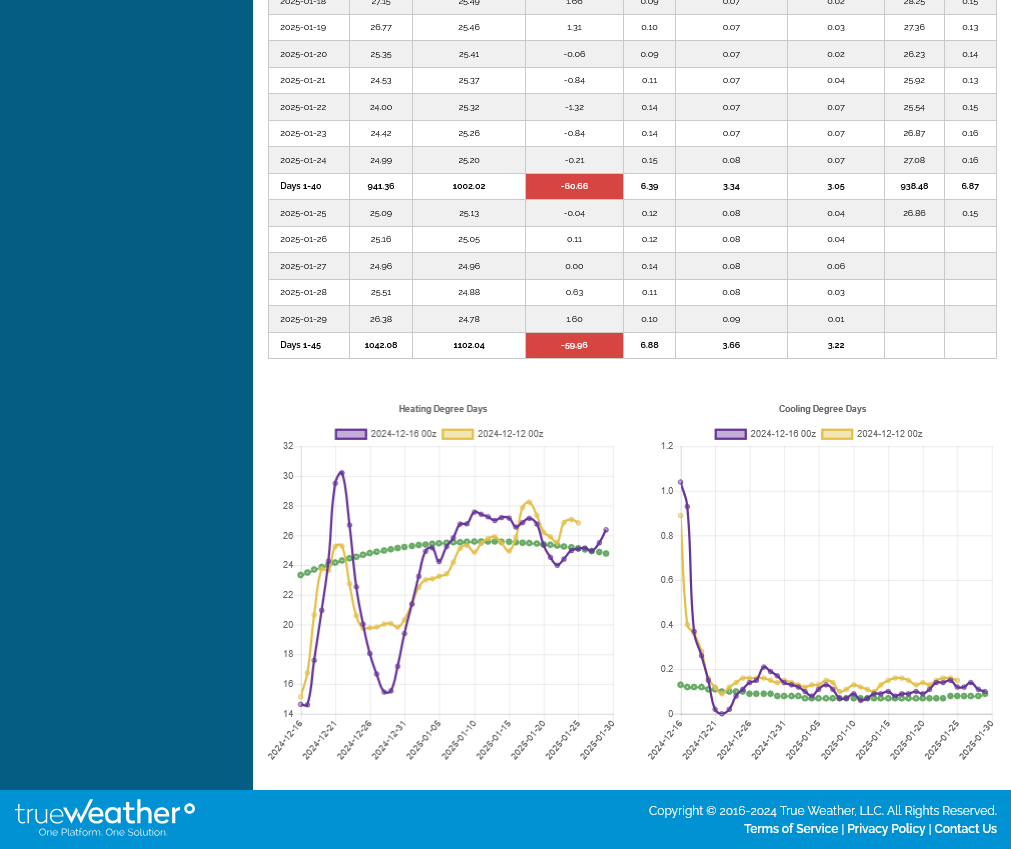
That hasn't changed! This was the 45 day forecast from the European model ON MONDAY. We gapped lower Sunday and were BELOW THAT GAP until, Tuesday morning(when we were down sharply on the mild weather) then, very suddenly sustained, aggressive buying hit, with 0 corrections, just higher and higher for hours. There was a clear reversal/turning point which is the identifying signature on the price charts of the release of some sort of news to the market.
This chart formation tells us that some sort of powerful news was released on Tuesday morning BEFORE the 12z models were out. The late period cold on the 12z EE probably amplified that but we went straight up the rest of the day with just a minor change in the weather forecasts.
https://tradingeconomics.com/commodity/natural-gas
+++++++++
Here at 6:30pm, the last 18z GEFS at the end(January 3rd) is VERY BEARISH! A drop of -1 HDDs from the 12z run but close the recent BEARISH runs.
Natural gas is completely ignoring all the bearish weather.
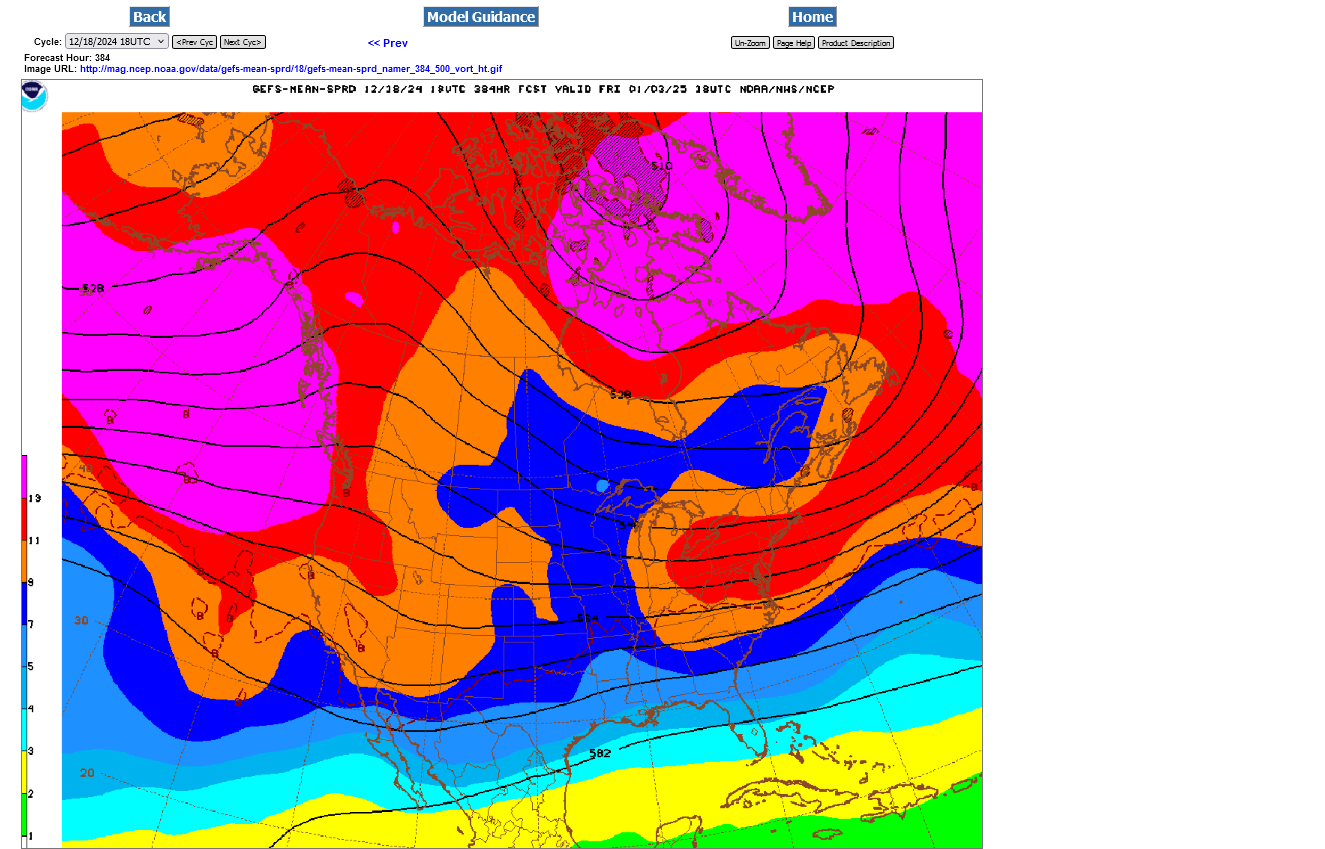
My gut feeling right now is starting to lean towards a more bullish, amplified version of solutions like this.
The Canadian model was MORE bearish than previous runs but there are a couple outliers that are extremely bullish. I will not discount the market possibly being smarter than the models but that still can't come close to explaining this price action.
Last weeks drawdown was a bullish surprise. The demand/supply fundamentals may have changed to more bullish? This could lead to erosion of the massive surplus during cold waves. .......but the didn't suddenly become known on Tuesday morning.
0Z model consensus looks bullish to me. The GEFS late week 2 is the coldest in several days per my eyeballs! 0Z EE is nice and cold late as is CDN ens.
Thanks, Larry.
the GEFS does look colder but still above temps, even at the end.
The EE looks the same but was -3 HDDs from additional warmth the first 10 days.
To compare the entire period HDDs =259 to the average =320 HDDs on this last EE shows how mild the period is. -61 HDDS.
+++++
EIA at 9:30 am.
Thanks, Mike. Eyeball check says 6Z GEFS MAY end up with slightly fewer HDD vs 0Z due to a warmer late week 2 fwiw. Before that it may actually have a small increase in HDD though. So, maybe not. So, not sure about entire run. The end though isn’t as bullish as 0Z fwiw.
Regardless, NG at session highs 3.503.
Thanks, Larry.
Pretty close to your assessment. The GEFS was -2.5 HDDs. Purple is the last 6z run. HDDs are on the left.
The total HDDs for the period is 252 compared to the normal/average of 346. So this 2 week forecast is -96 HDDs below average.
The price of natural gas is +$4,000/contract in less than 48 hours. There is MUCH more going on than the weather forecast.
+++++++++++++
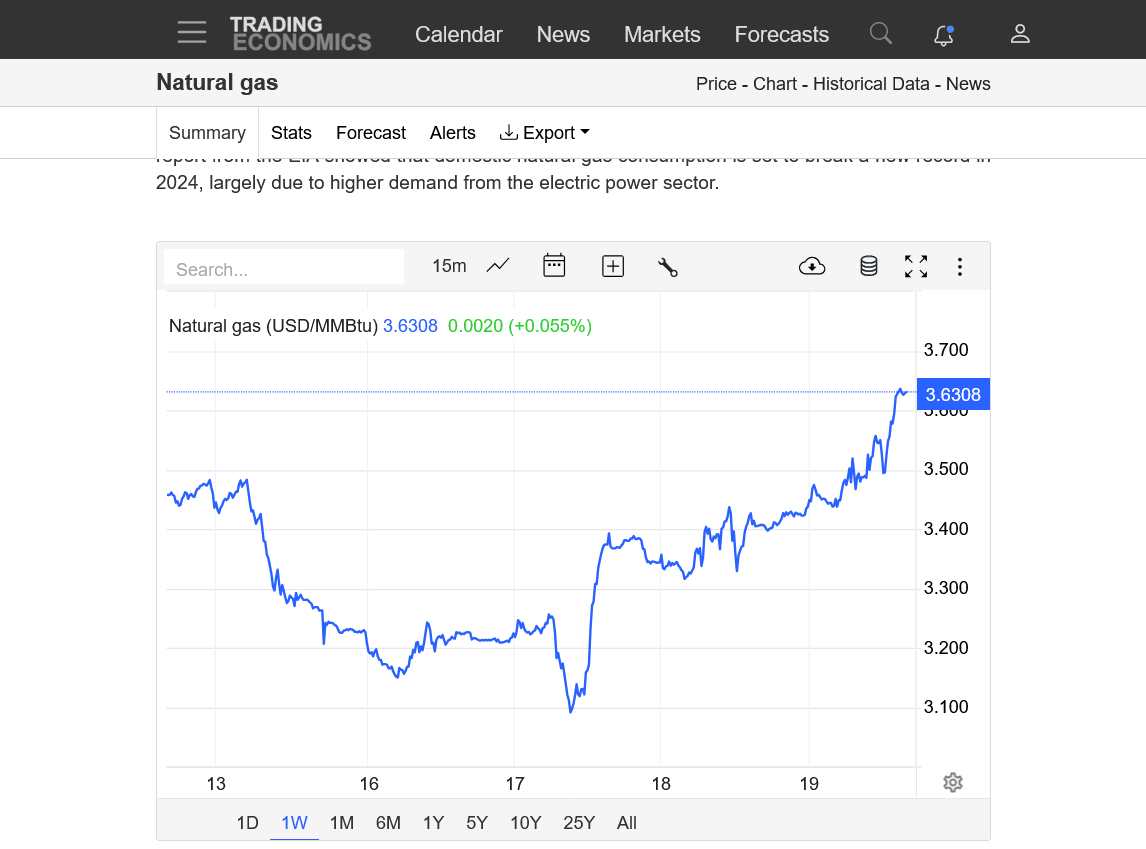
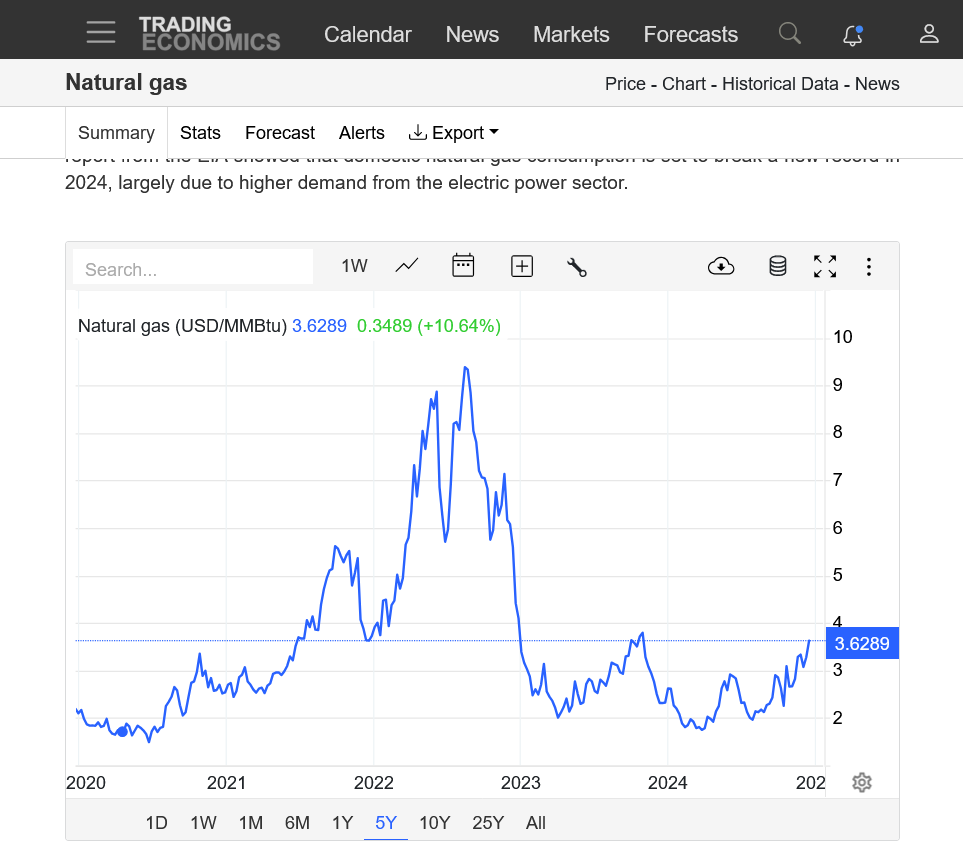
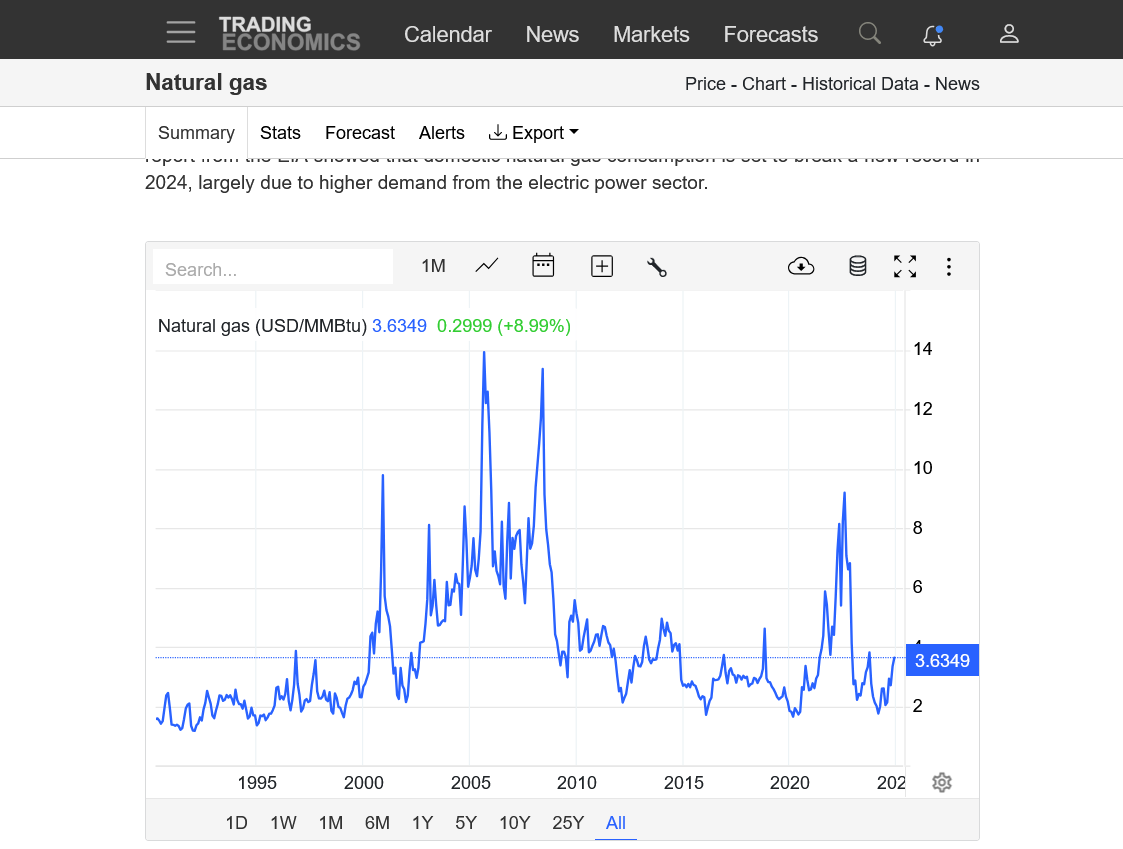
Charts below looking extremely bullish!
https://tradingeconomics.com/commodity/natural-gas
1. 1 week
2. 1 year
3. 5 years
4. 35 years
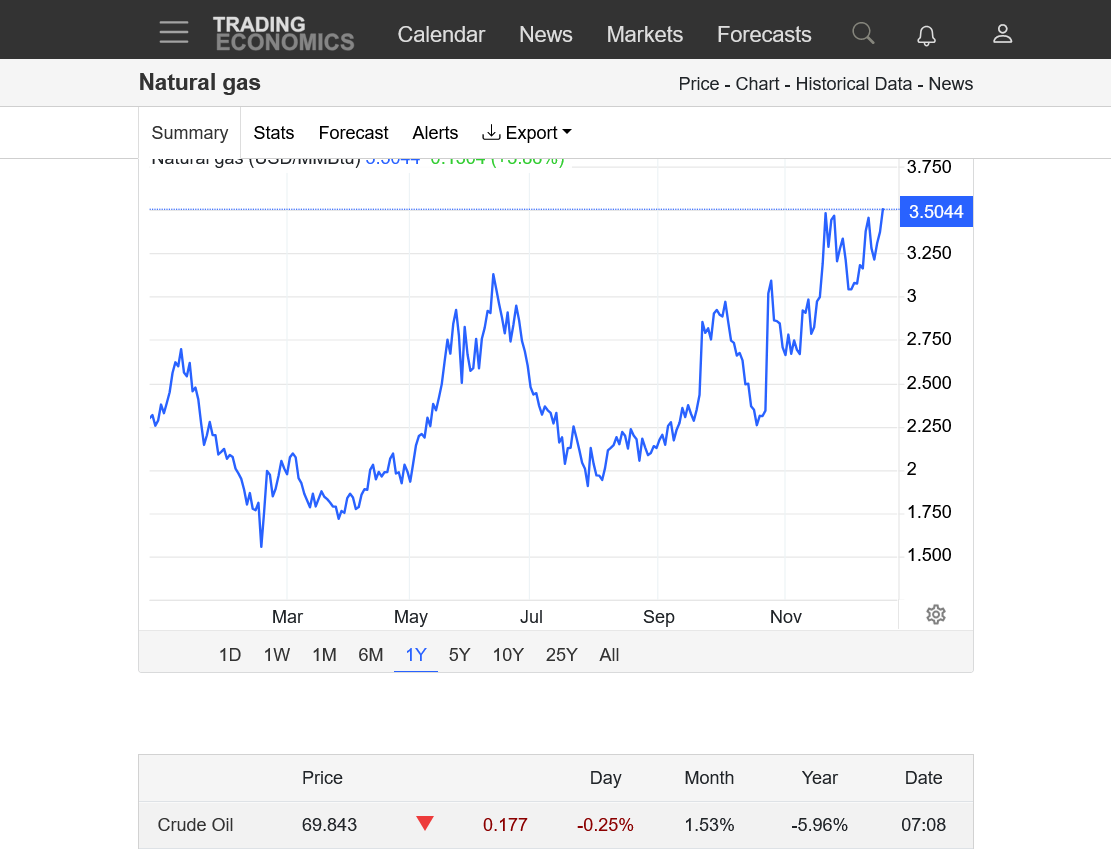
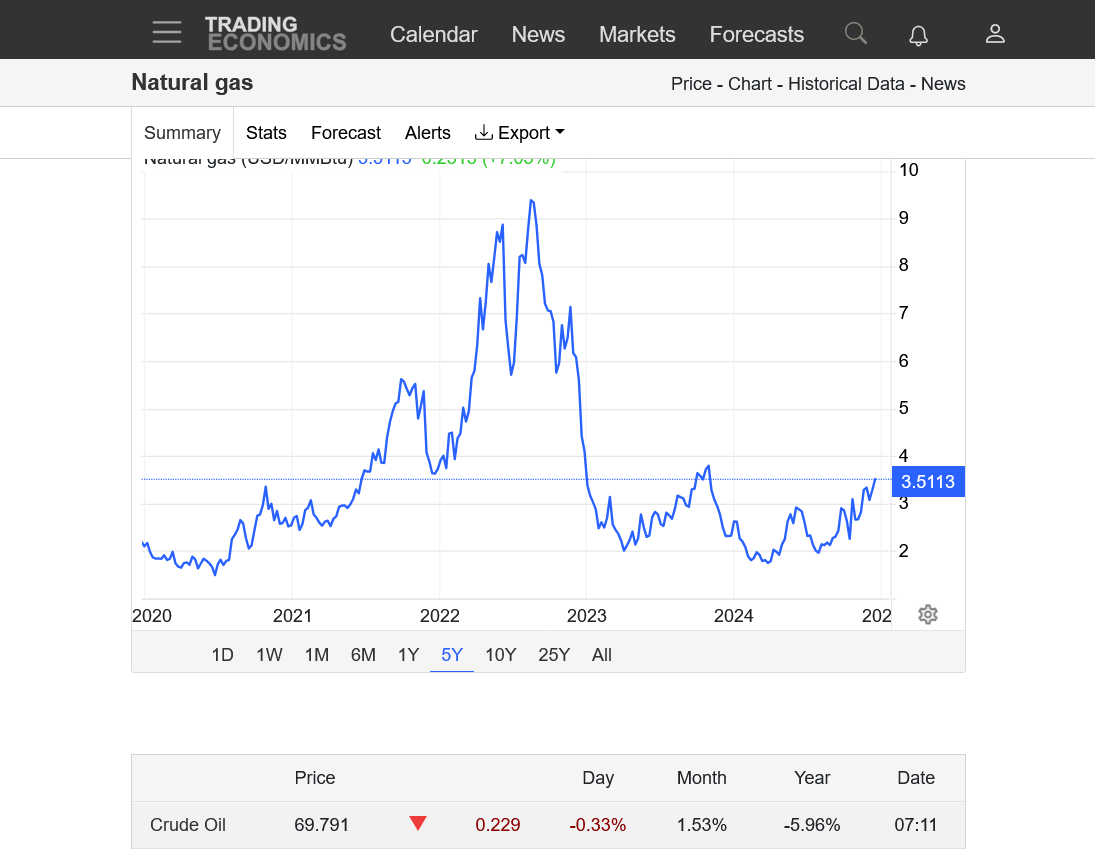
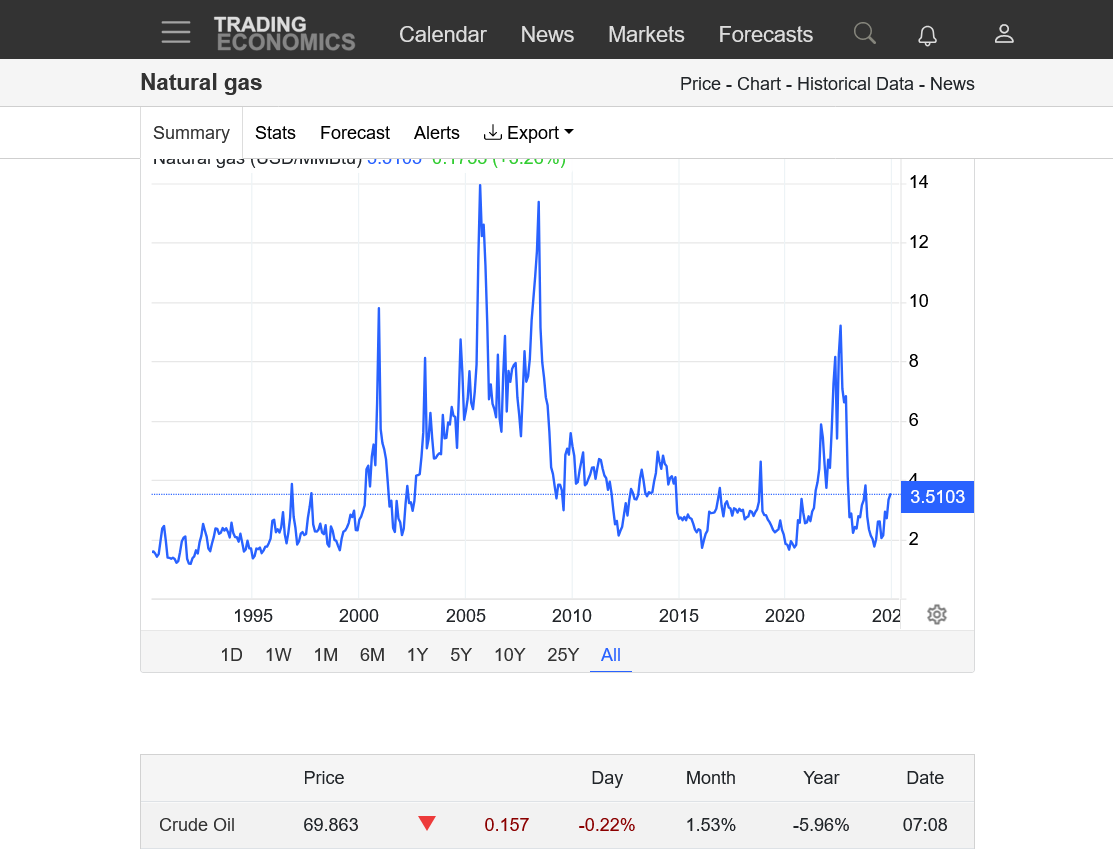
The EIA drawdown was very robust and more bullish than I thought, -125 Bcf! We've eroded the near record surplus the last 2 weeks.
https://ir.eia.gov/ngs/ngs.html
Working gas in storage was 3,622 Bcf as of Friday, December 13, 2024, according to EIA estimates. This represents a net decrease of 125 Bcf from the previous week. Stocks were 20 Bcf higher than last year at this time and 132 Bcf above the five-year average of 3,490 Bcf. At 3,622 Bcf, total working gas is within the five-year historical range.
For information on sampling error in this report, see Estimated Measures of Sampling Variability table below.

. Larry, do you know what the guesses were?
The market is holding on to some substantial gains!
Mike, actual of -125 was neutral vs guess range of -147 to -115 per NGI.
——————-
**Edit: NG hit a high of 3.561 so far today (at 11:10AM CST). If it exceeds 3.563, it would be reach the high of 2024 and highest since Oct of 2023!
**Edit at 12:30PM CST: It appears to me that NG hit so much/repeated resistance at/near 3.561 that enough folks decided to sell off to cause it to fall back ~2%. I don’t think that selloff was largely wx related but rather I think was mainly technical related.
***Edit 12:39PM CST: 12Z EE already fully out. Is TrueWeather out as of this time? If so, how much?
EE per eyeballing is if anything perhaps had a small drop in HDD but still has about the same bullish pattern late
TrueValue hasn't even started their EE 12z run data stream yet.
Their E operational run just now finished.
12:51 pm CST: They just now started the EE 12z run!
++++++++++++++++
The 12z Canadian ensemble was clearly COLDER than the previous 0z run, with a distinctive cross polar flow! A few of the members are BRUTALLY cold!
https://weather.gc.ca/ensemble/charts_e.html?Hour=384&Day=0&RunTime=12&Type=gz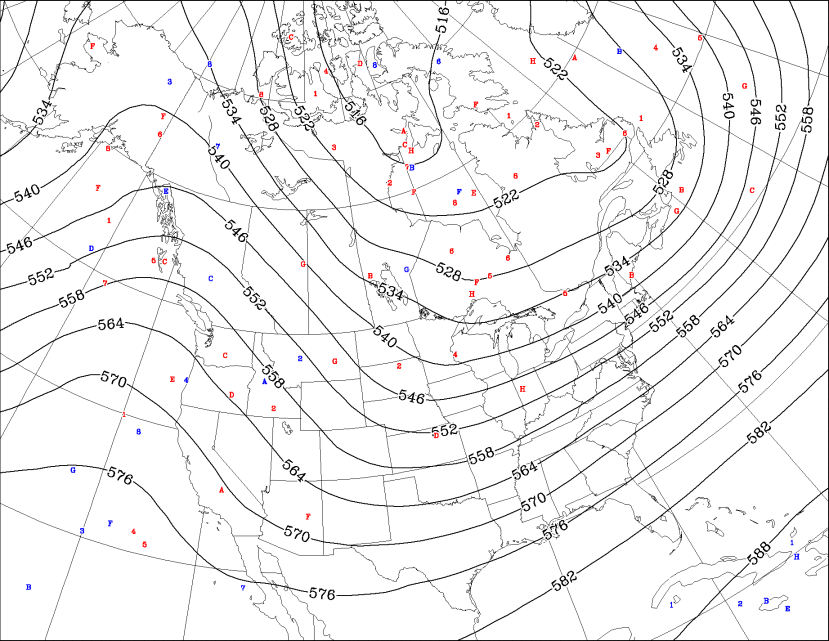
EE was -1 HDD.
+++++++++++
4pm CST: Price chart update. After the gap and crap on Tuesday(filling the Sunday downside gap), NG has gone on an incredible rally of $5,000/contract+ since Tuesday morning!!!!
https://tradingeconomics.com/commodity/natural-gas
1. 1 week-sight to behold!!!
2. 5 year- highest price since Oct 30, 2023. That was ~$3.8. At this rate, we may blow right thru that.
3. Max-35 years
Record +PNA non-Nino Dec progged/Jan +PNA favored By metmike - Dec. 20, 2024, 10:54 a.m.
Getting extremely volatile. We sold off $1,500/contract in just over an hour after 7am and have recovered most of that now at 11:45 am.
Hey Mike,
The 12Z model consensus looks to me bullish/colder late in the runs.
Yes, Larry!
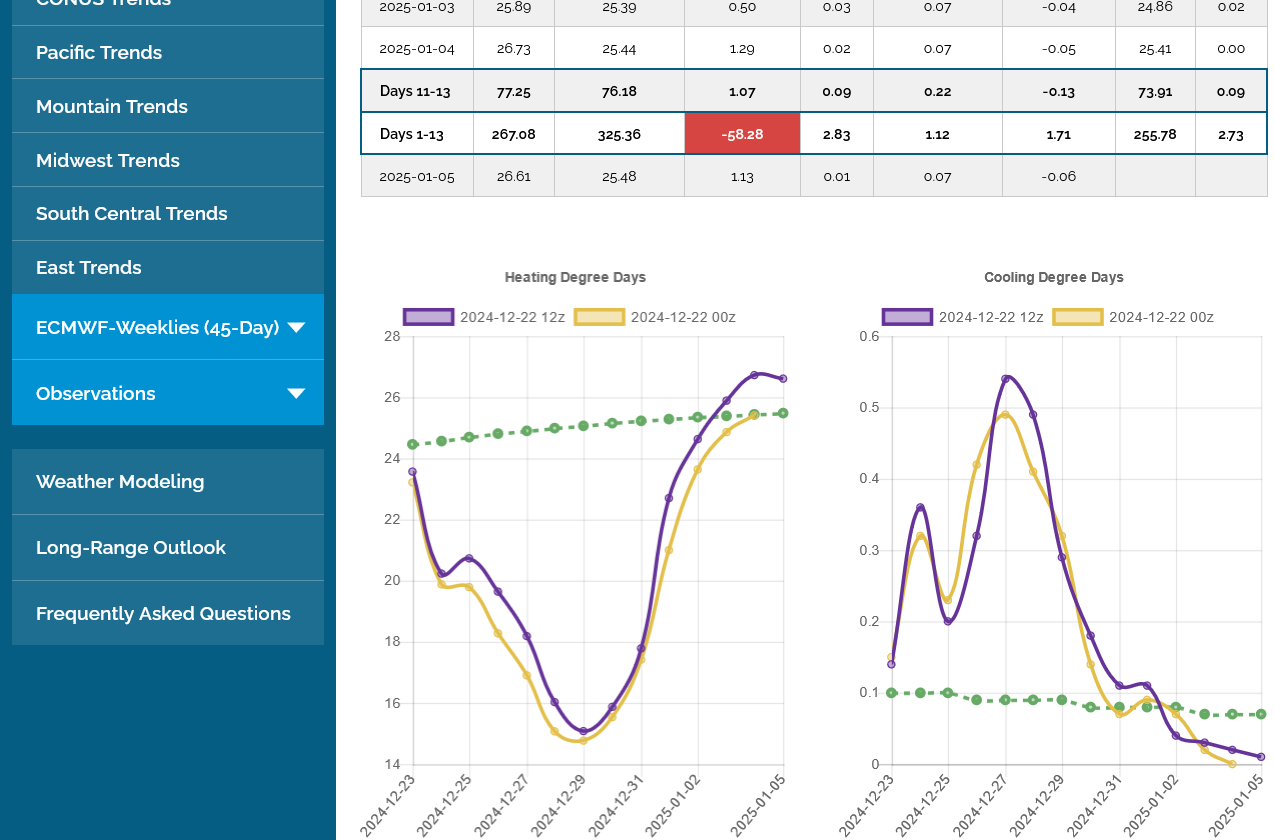
12z EE was +6 HDDs vs the previous 0z run.
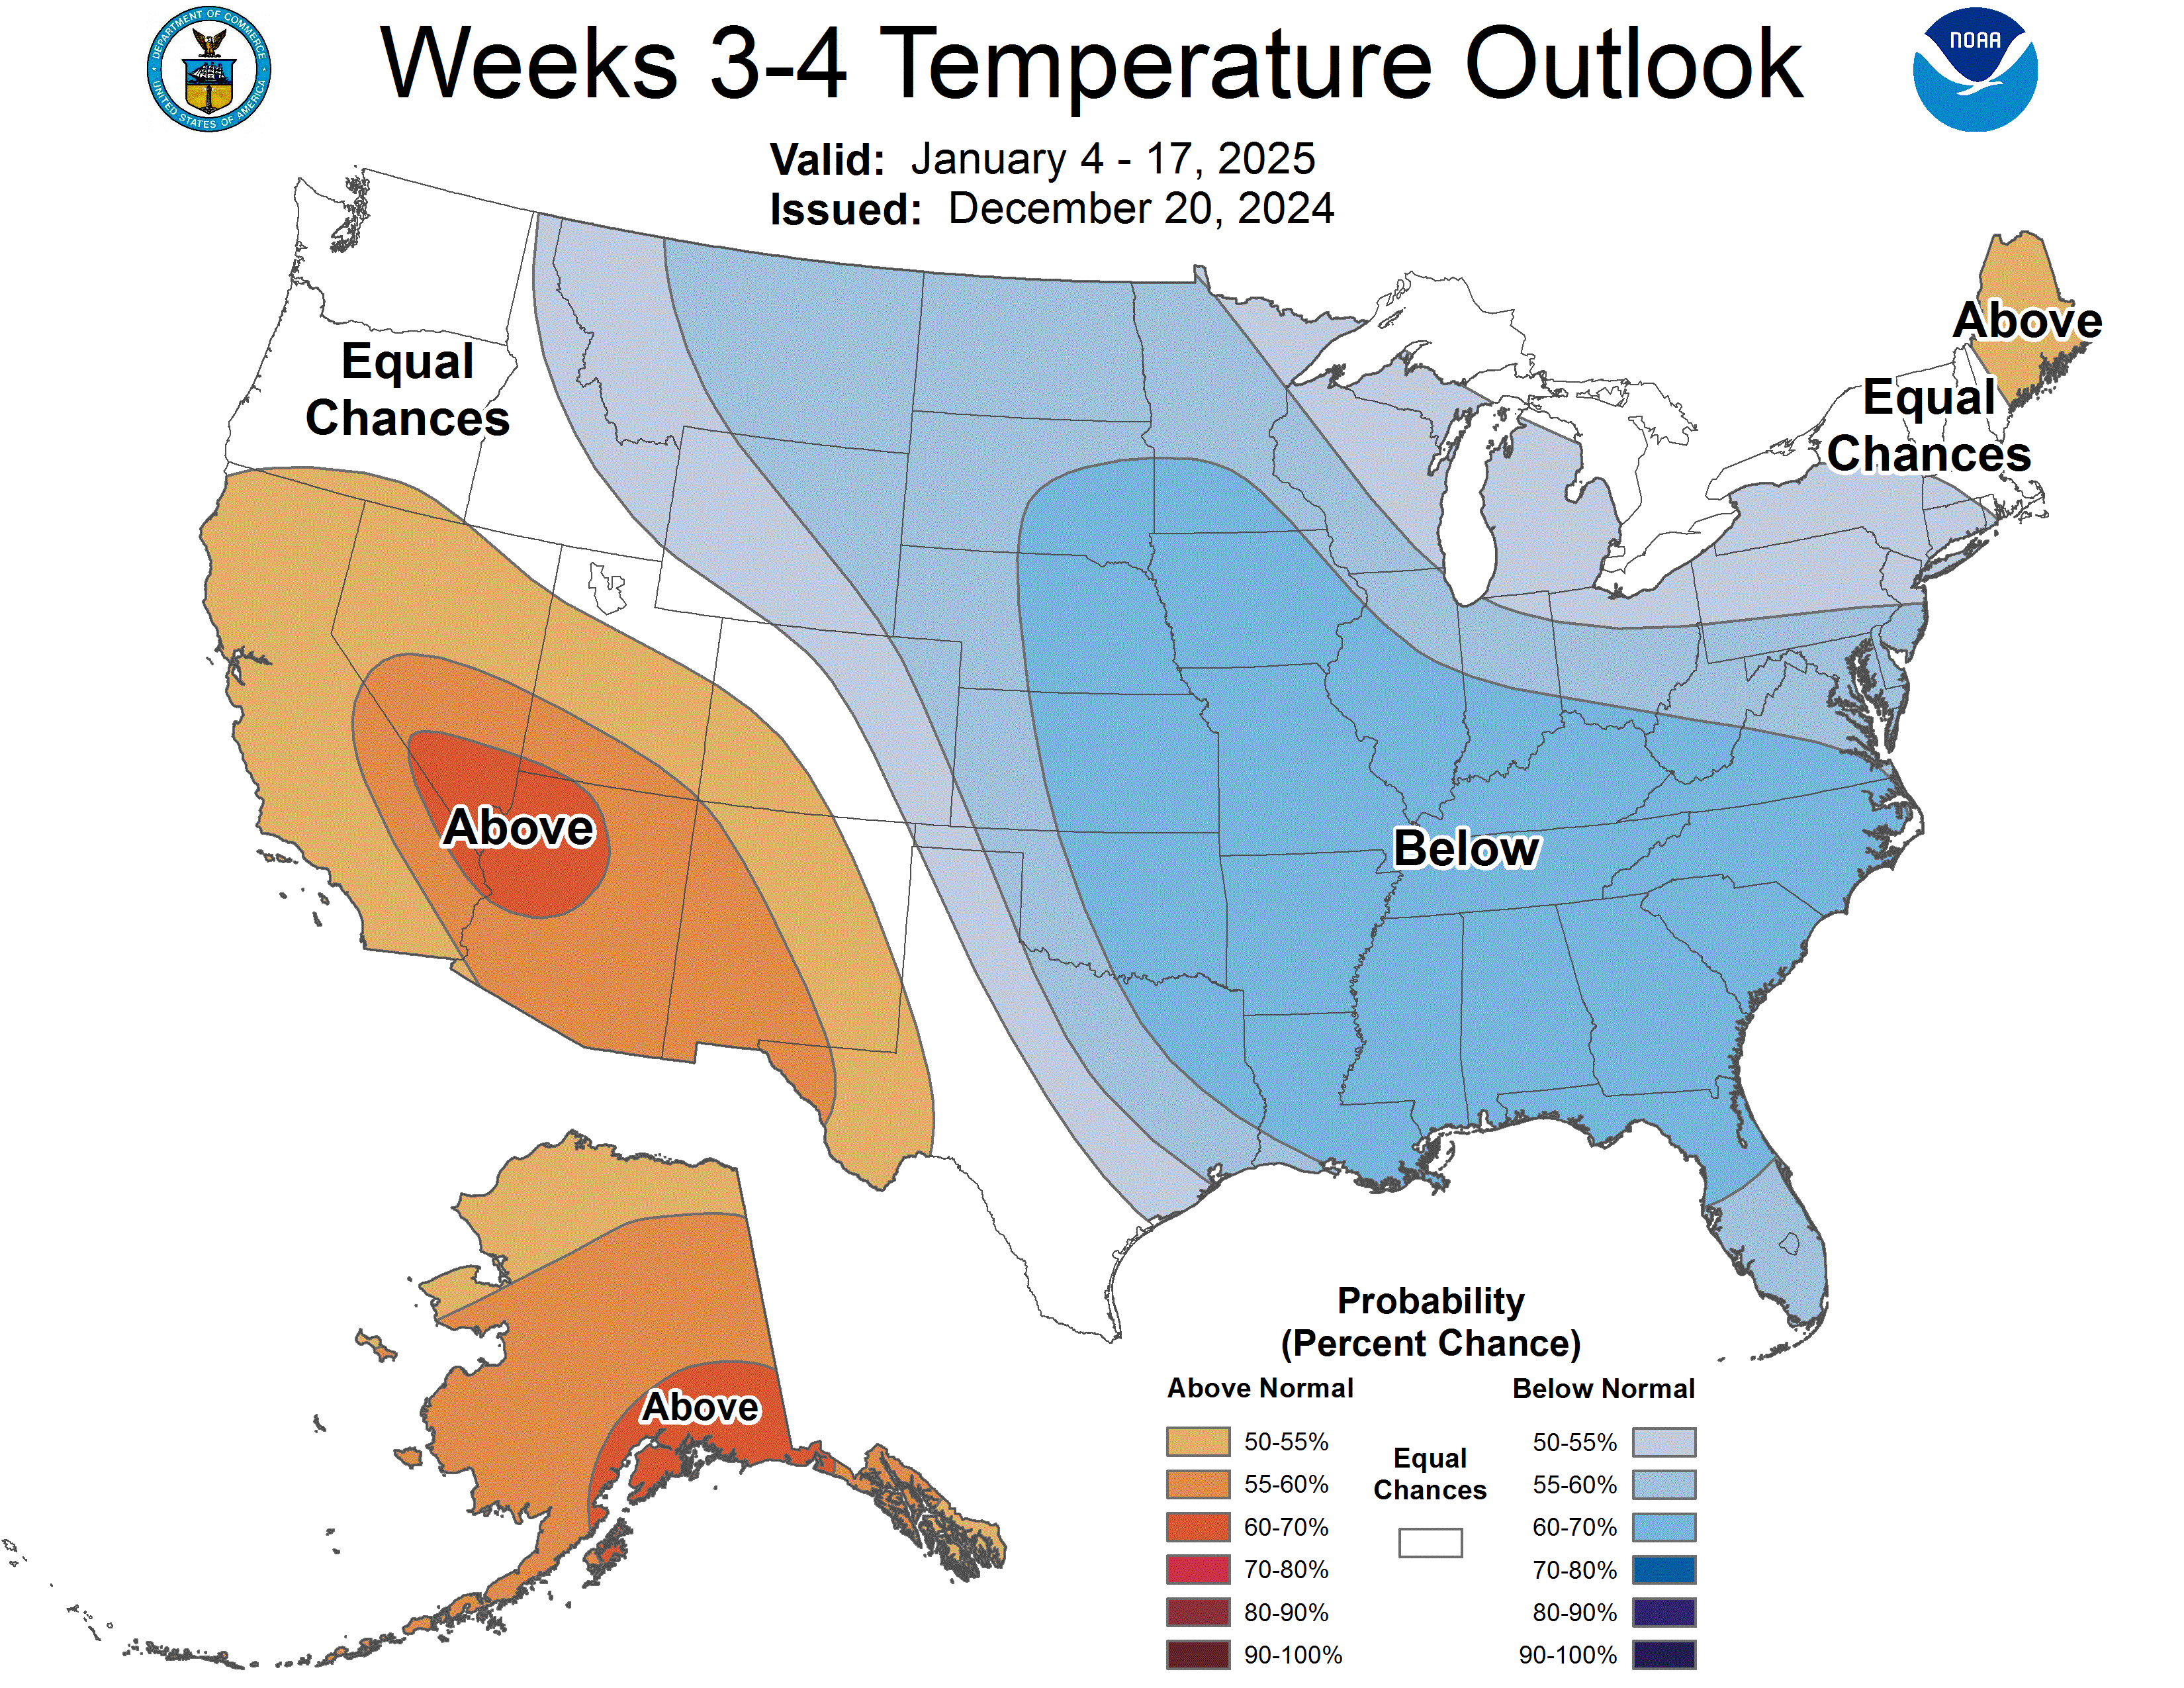
Low skill weeks 3-4 just out.
https://www.cpc.ncep.noaa.gov/products/predictions/WK34/
Hey Mike,
It appears to me that todays high of ~3.827 (hit between 12:25 and 12:30PM CST) is a whopping 24% higher than the Tue AM (12/16) low of ~3.09!
Thanks, Larry!
And yes, I remember many dozens of forecasts for this extended time frame turning out very wrong.
Not sure how much technical indicators will be guiding the price path forecast with a very bullish weather forecast like this.
The main thing making this EXTREMELY bullish is the cross polar flow!!!!
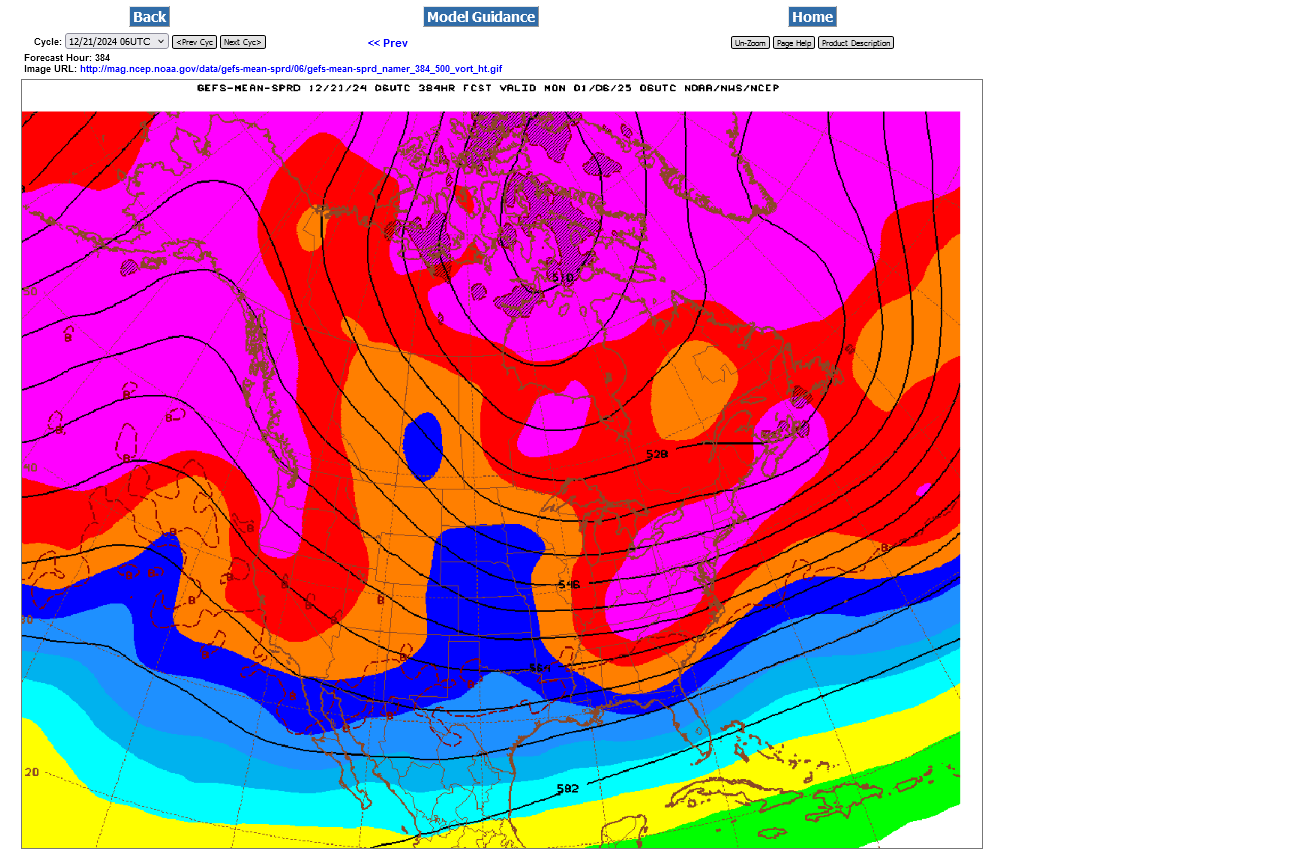
Look at the streamlines/contours of this last 6z GEFS 500 mb map. The air tends to flow parallel to and with the contours/streamlines. They are a metric that helps show where the upper level steering currents will be.
Note below, there are 5, tightly packed contour lines in northwest Canada that show steering currents strongly coming from Siberia, crossing the Arctic/Polar regions to our side of the Northern Hemipshere and DUMPING the coldest air on the planet into Canada.
Tracking them farther south shows they are aimed at the United States.
So our air masses in January will be coming from THE SIBERIAN EXPRESS!
Mike said:
Low skill weeks 3-4 just out.
https://www.cpc.ncep.noaa.gov/products/predictions/WK34/

———————————-
Hey Mike,
The week 3/4 outlook website has a great archive section. I just took a look at all winter week 3/4 outlooks since they started 2015-6. I can confirm that this one, with all but the S 1/2 of FL in 60-70% BN chances, is easily THE coldest week 3/4 outlook for the SE as a whole for Jan on record!
The 2nd coldest for Jan was issued for Jan 16-29, 2016:
1/16-29/2016 verified very well with the solid cold of 4-6 BN. Also, there was a major winter storm N GA/Carolinas. In addition, flurries fell as far S as Gainesville, FL. (I was there as my bro was there for a medical reason.)
great work, Larry!
And we can note, in January 2016, that the PNA was near record positive at +2 that month, the AO was -1.44 and very cold but the NAO was just neutral, slightly positive and mild.
Don’t quote me exactly as I’m not on my computer and just took a quick glance.
The upcoming pattern is shifting the axis of the upper level ridge, causing the +PNA to drop towards 0 or even below 0 In January.
Larry,
I've been trying to sign up with Weatherbell since yesterday late afternoon but not heard back.
Put in all my credit card info to and picked the service along with email and password. No go.
Left several messages but heard nothing back.
Hey Mike,
Im guessing either they’re short on staff due to the holiday season or the person who does this got off earlier than when you contacted them. Hopefully they can get you set up Monday morning.
Thanks, Larry!
Still no luck with WeatherBell.
As mentioned previously, the rapidly changing indices are telling the story. The +PNA stays slightly +PNA but the NAO drops to slightly negative and the Big Cahoona is the AO crashed to LESS THAN -2 and is still falling at the end of the period.
The --AO is the result of the 500 mb map being extremely impressive with high latitude blocking and POSITIVE anomalies, in tandem modest mid latitude NEGATIVE anomalies. This is a powerful couplet/teleconnection that very effectively flushes cold from high latitudes to mid/lower latitudes.
When extreme, it can cause the polar vortex to shift unusually far south or reform unusually far south. Polar vortex intrusions, bodily into the northern US, ALWAYS feature this pattern. ALWAYS as in every single time in history.
One of the questions now is.......how much farther south than usual will the Polar Vortex go in early January!
This will help define the intensity and length of time for the cold.
https://www.marketforum.com/forum/topic/83844/#83856
I'm guessing that the open tonight COULD be a gap higher. However, we do have a week of very mild weather to go, and if the market senses that this upcoming cold will only last for a week or so or starts looking LESS intense, we could crash lower really really fast.
There's no formula that tells us X amount of cold = X price for natural gas.
One metric that often works is: Are the weather models colder or warmer than they were before.
Before can be "before the weekend" or, when the market is open, it can mean "before this last model run".
We must have already dialed in a ton of cold here and powerful buy the rumor, sell the fact trading will kick in for sure at some point MUCH BEFORE the cold is even getting close.
EE was a whopping +11 HDDs vs the previous 0z run.
Gap higher on the open? The formation and close on Friday suggests that POSSIBILITY.
HOWEVER:
It's going to get tricky up here. The high on Friday was up over $7,000/contract since Tuesday's low and we still have over a week of very mild temps to go before the MAJOR cold starts hitting.
Additionally, the next 2 EIA reports will be seasonally BEARISH.
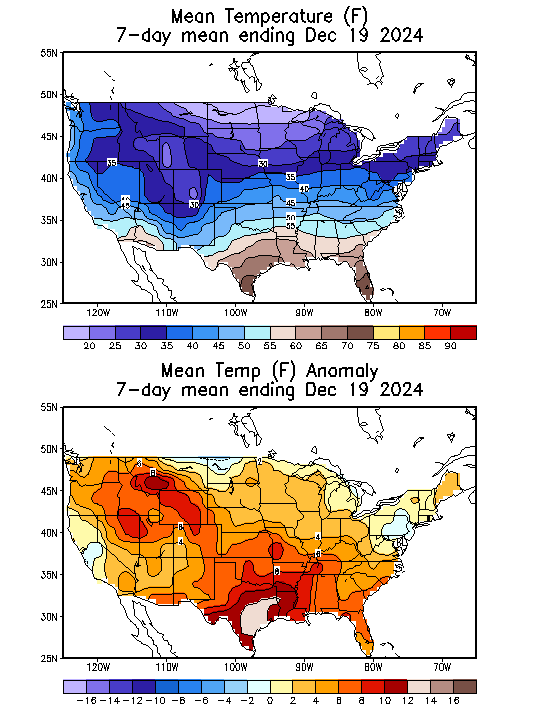
7 day temps last week for this next one:
https://www.cpc.ncep.noaa.gov/products/tanal/temp_analyses.php
++++++++++
One would think that MUCH of this cold is already dialed in if this is mostly about the much colder weather coming up in January.
https://tradingeconomics.com/commodity/natural-gas
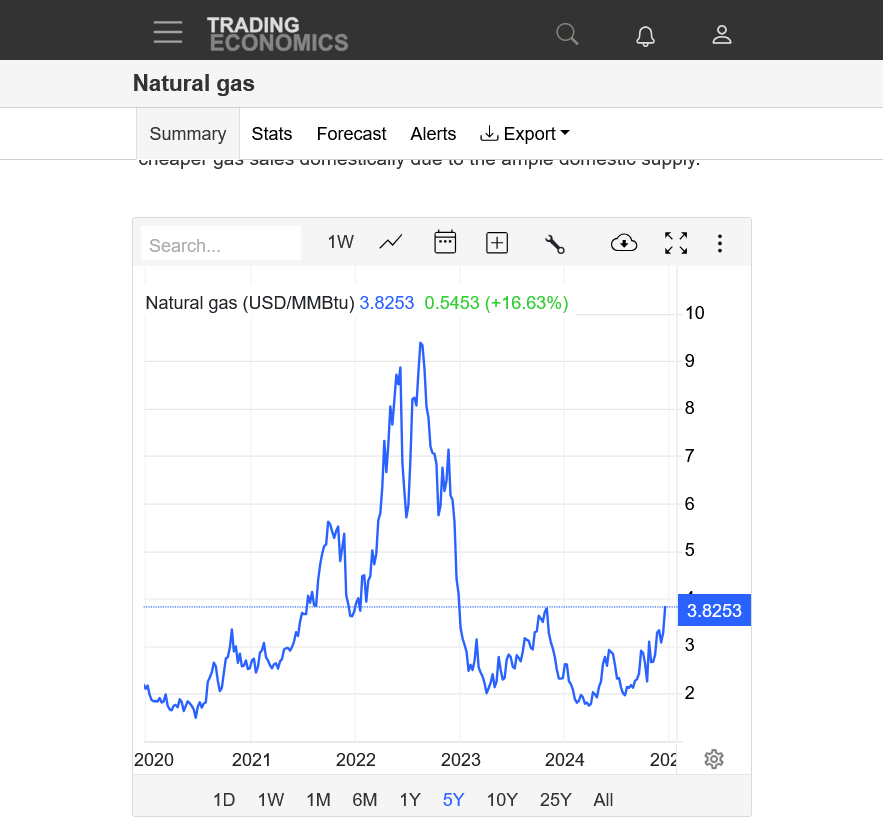
This is also about increased LNG exports to Europe to replace Russian gas.
We got the gap higher and are building on it a bit with only 3 minutes of trading so far.
+1.900/contract.
Upside break out above the October 31, 2023 high! If it holds. Highest price in 2 years, since late December 2022.
Potential double top if cold gets taken out of the forecast or if we can't hold up here.
https://tradingeconomics.com/commodity/natural-gas
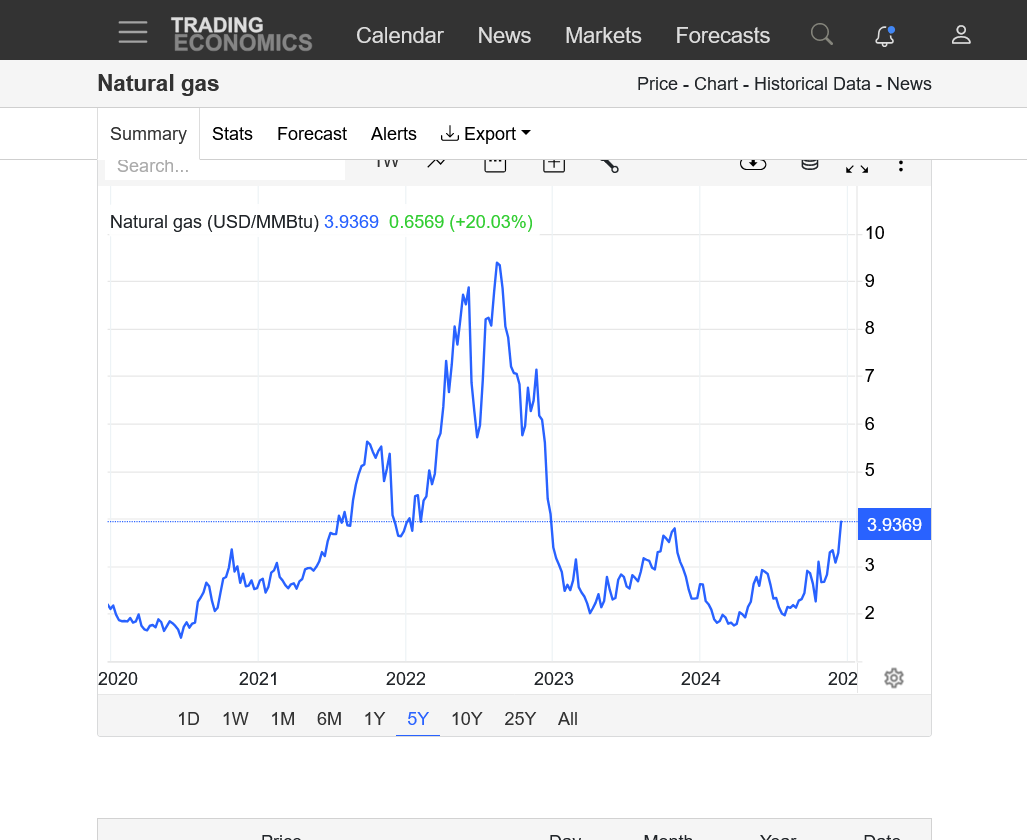
Not holding and filling the gap is a potential buying exhaustion, "gap and crap" but the volatility right now makes that a less reliable chart formation/signature.
EE was -7 HDDs and has helped take us back to,the,lows. Trying to hold on to the gap higher but vulnerable here to filling it. That gap is right at MAJOR support which last week was MAJOR resistance on the chart.
ADDED; We just filled the gap. Still higher but vulnerable to a gap and crap buying exhaustion reversal down signature on the charts.
Hey Mike,
Does it look like to you that the cold is now dumping more into the western US and less in the E US vs late last week/Saturday/early Sun, especially on the GFS/GEFS?
I’m hoping this is just a temporary head-fake as I like it cold in the SE US. MJO forecasts into the weak left side of the diagram along with (near) record Dec +PNA for cold ENSO make me feel optimistic for much of early to mid Jan. Also helping prospects is the outlook for a solid -AO in early Jan.
It does still look pretty cold in January, Larry. Any changes in the last model run did not really change the forecast philosophy from previous runs.
I think we went up way to fast and OVER reacted to the upside and just ran out of buyers after being +$8,000/contract in a few trading days.
We've corrected $3,000/contract in short order but also put in a very impressive gap and crap buying exhaustion formation on the price charts, failing at a place that leaves a double top too with the high of Oct 2023.
I have no idea where we will go the rest of today, other than the market will likely react to the latest weather models.
WeatherBell has still not contacted me and still is not allowing my credit card and sign up information to go thru.
Maybe they're off for the rest of the year for Christmas???
Edit: they finally contacted me. I tried 2 more times with different credit cards and still no luck.
Mike said:
“Edit: they finally contacted me. I tried 2 more times with different credit cards and still no luck.”
————
Hey Mike,
1) I’m trying to follow you. Are you saying they finally emailed you back and after that you tried 2 CCs and still no progress? I don’t get it.
2) My take on 12Z models: GEFS significant drop in HDDs/bearish vs 6Z but EE remains significantly more bullish with a bullish looking 11-15. The 1-10 of EE per eyeballs didn’t change much. But 11-15, itself, looked a bit colder than 0Z. That seemed to help NG to recover somewhat. 12Z Canadian ens looked warmer than 0Z.
Larry,
Tried for the 4th time doing everything the same and it finally went thru. Not sure what was going on before but I'm in. Yippee! Now to try out their products. This will be big fun. I can see the difference in speed between them and my current provider. I got a years subscription.
You are right about the 12z EE being colder. It was +3 HDDs vs the previous 0z model that was -6 HDDs milder. THe 12z GEFS was a whopping -10 HDDS vs the 0z run. Here's this last 12z EE.
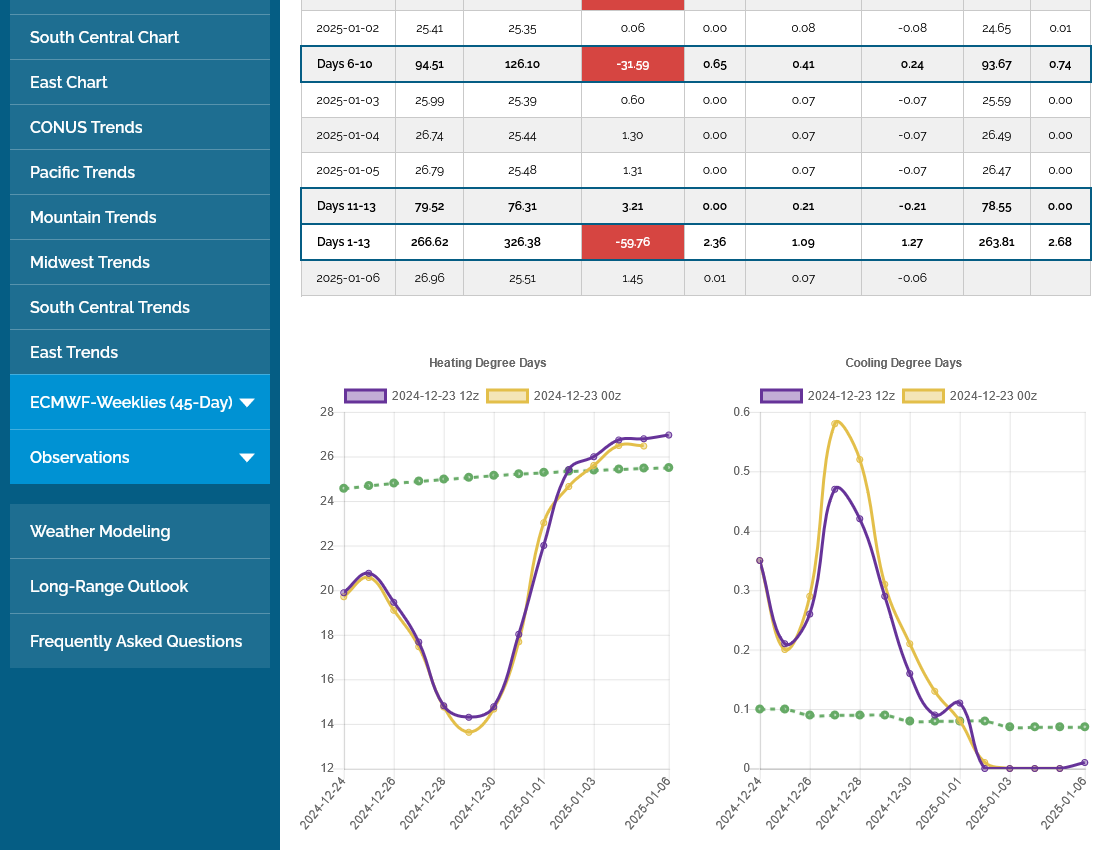
Its going to take awhile to explore all this awesome stuff but the model output comparisons from previous runs are awesome! It was a ton of work doing that before, sometimes with several pages open. NO LONGER!
-6 HDDs on the last 0z EE vs the previous 12z run but it doesn't matter because we have THE SAME very cold pattern change for January.
+4 HDDs for the last 6z GEFS compared to the previous 0z run, after being -8 HDDs on the 0z vs the previous 18z.
One big question for me(and the market) is how far south will the polar vortex meander from it's usual position in January??
Here are some possibilities from the last 0z Canadian model, with individual members.
https://weather.gc.ca/ensemble/charts_e.html?Hour=384&Day=0&RunTime=00&Type=gz
++++++++++
Pretty extreme high latitude blocking setting up.
https://www.marketforum.com/forum/topic/83844/#83856
Arctic Oscillation Index, North Atlantic Oscillation Index, Pacific North American Index.
+++++++++++++
GFS ensemble mean anomalies at 2 weeks.
https://www.psl.noaa.gov/map/images/ens/z500anom_nh_alltimes.html 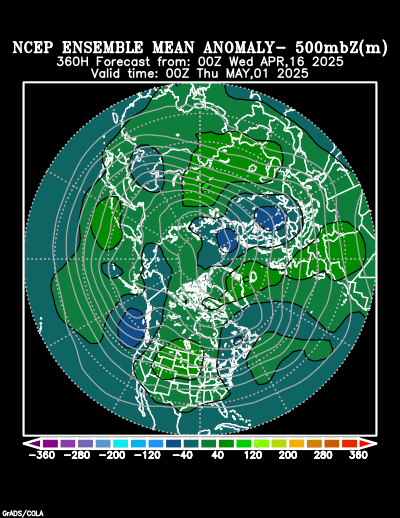
The 12Z EE is colder than the 0Z, which likely is supporting the current NG rise (up 1%+ last 20 minutes).
At 360 hours it has about as negative H5 anomalies as I can recall on any run at 360 centered in the E US. NYC is at 534 dm, which is a whopping 14-15 dm BN! Keep in mind that that is a 50 member ensemble mean out 15 days, a very difficult modeled anomaly to have.
How about earlier in the 12Z EPS (at 270)? This has at 500 mb E NC at 20 dm BN and NYC at 17 dm BN!
Thanks very much, Larry!
The last 12z EE was +7.5 HDDs vs the previous 0z run, 12 hours earlier. Colder, exactly as you indicated:
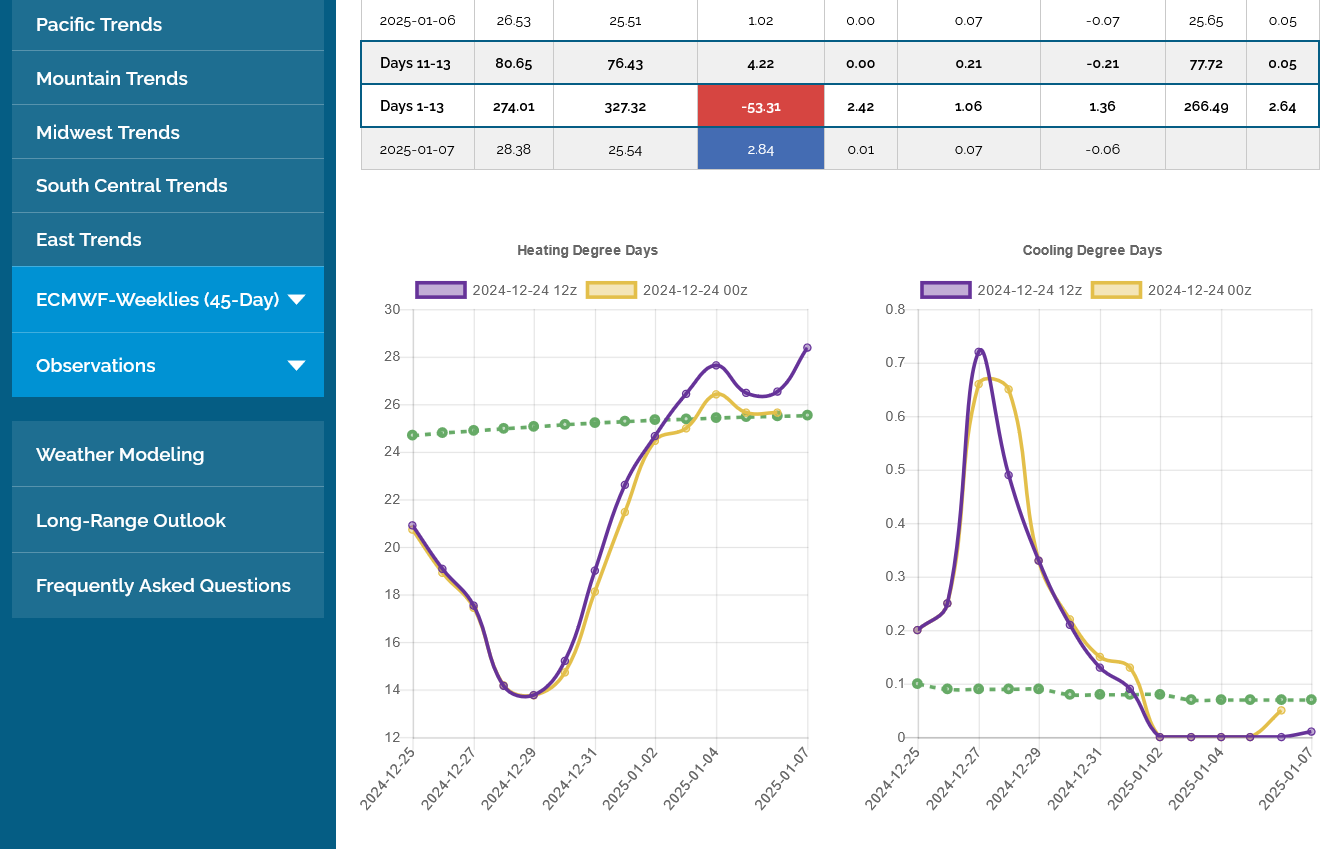
You’re welcome, Mike! What a cold run the 12Z EE was. It was one of the coldest at 500 mb in the E US I can ever recall!
As both a Christmas and Hanukkah present to the board, I’ve started a new NG thread during this time off for NG. Even NG needs a break every so often. It works very hard!