December 16, 2024
https://www.aer.com/science-research/climate-weather/arctic-oscillation/
+++++++++++++++++
This discussion is 5 days old and the weather outlook has changed a great deal since then!
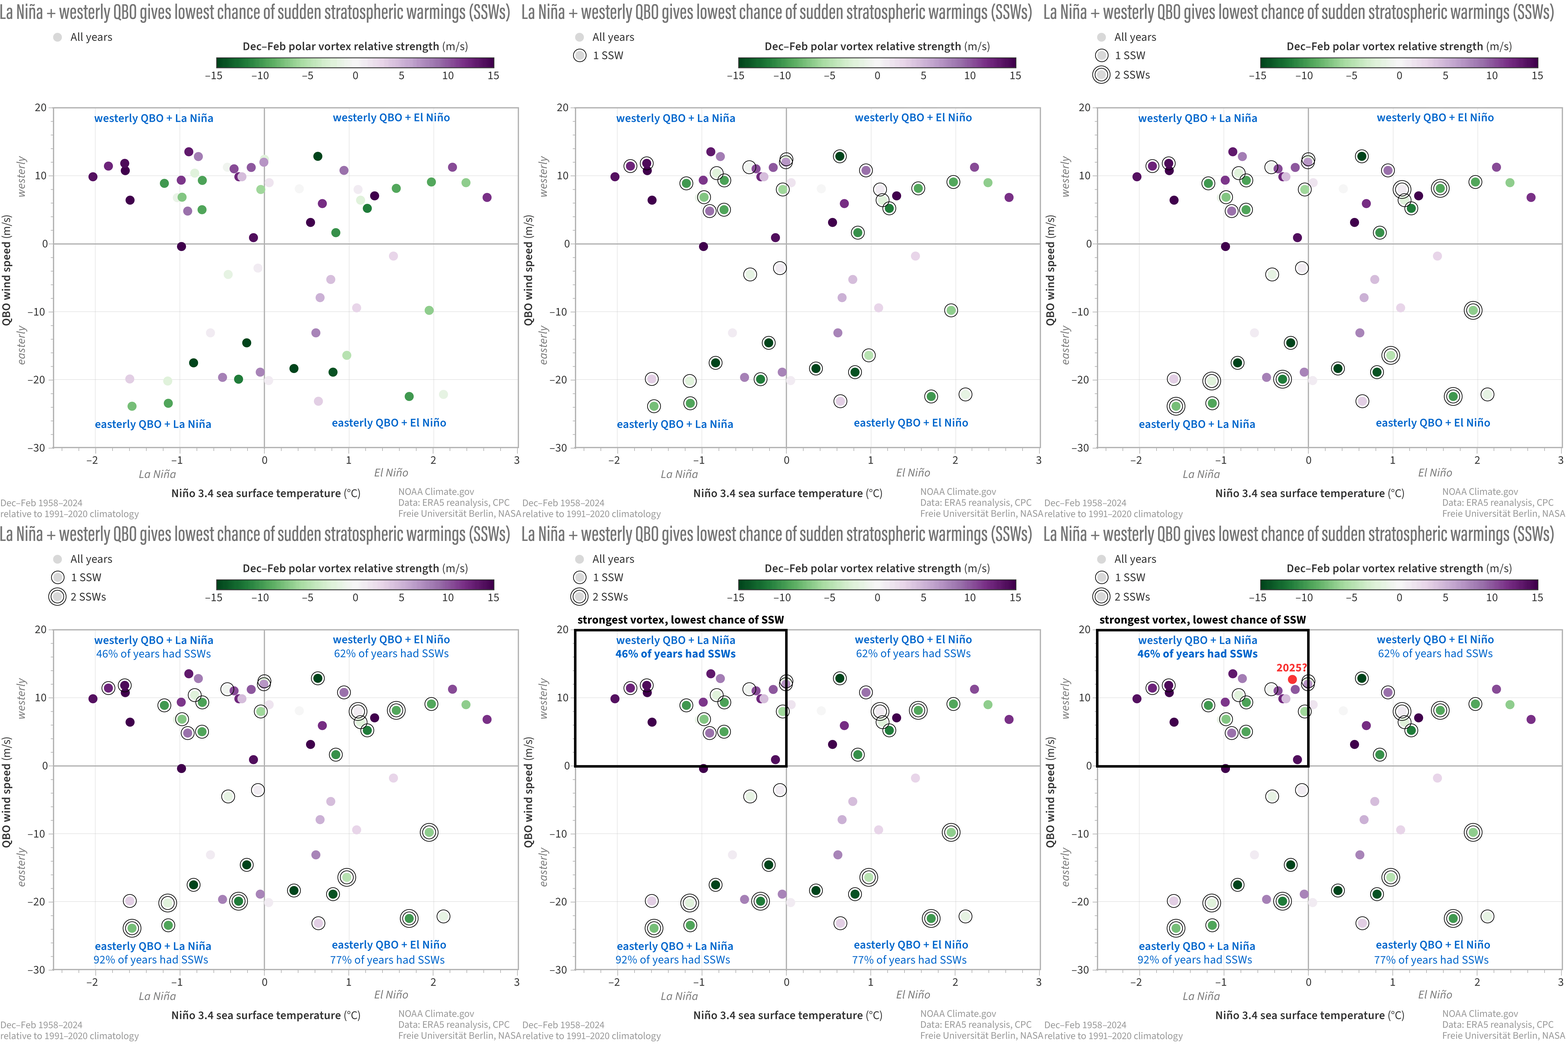
We can see where 2025 is below with the red dot. A westerly QBO and very weak La Nina. Historically these Winter conditions have produced the least amount of SSWs.
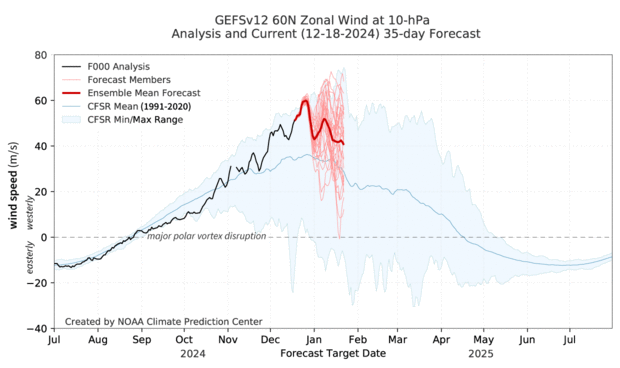
The forecast below indicates STRONGER than usual winds, which reduces the chances for a SSW the next month.
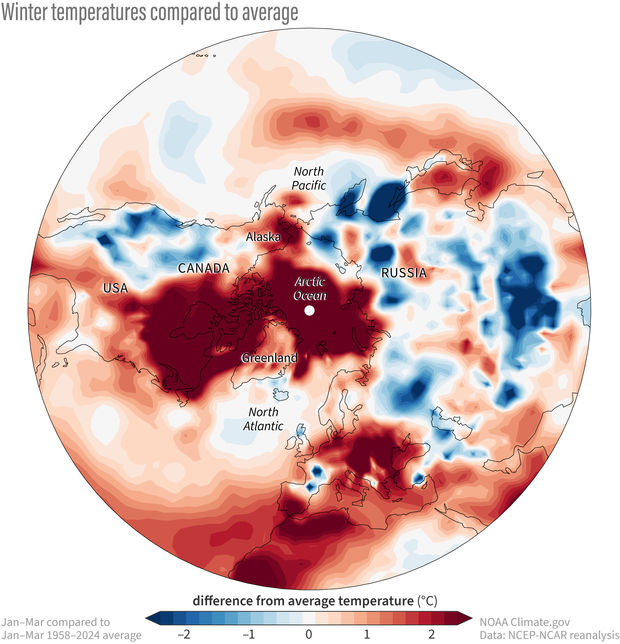
Last Winter, Jan-Mar 2024, we saw 2 different SSWs (more than usual) but the polar vortex and cold air went to the other side of the Northern Hemisphere.
Eastern North America, on the other hand experienced a record warm Winter.......by a large amount in some places.
December 16, 2024
https://www.aer.com/science-research/climate-weather/arctic-oscillation/
+++++++++++++++++
This discussion is 5 days old and the weather outlook has changed a great deal since then!
Thanks, Mike.
Joe D’Aleo (aka as Dr. Dewpoint back in the day) says there’s a connection between W QBO/high sunspots and SSWs. I checked into it further and can confirm there seems to be something to that relationship. Thus, I feels there’s a very good chance for an SSW sometime within late Jan to Mar.
Great point, Larry!
This makes some sense based on a vertical coupling in the atmosphere.
An active solar wind that impacts the magnetosphere could very well have an impact below.
https://agupubs.onlinelibrary.wiley.com/doi/full/10.1029/2023JA032027
https://en.wikipedia.org/wiki/Solar_wind
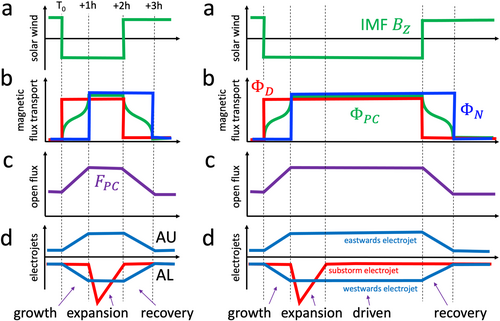
A schematic depiction of the magnetospheric response to changes in the interplanetary magnetic field (IMF) in the context of the expanding/contracting polar cap model (ECPC). (a) A southward turning of the IMF (BZ < 0) followed by a northward turning some time later. (b) The variation of day- and nightside reconnection (ΦD, red, and ΦN, blue), and the cross-polar cap potential (ΦPC, green) which is a smoothed average of ΦD and ΦN. (c) The variation of the open magnetic flux content of the magnetosphere (FPC). (d) The variation of the auroral upper (AU) and auroral lower (AL) electrojet indices in response to the eastwards and westwards electrojets (blue curves) and the substorm electrojet (red curve). The AL index is the envelope of the lower red and blue curves. The left column shows the case where the northward turning occurs shortly after the onset of nightside reconnection, such that the magnetosphere undergoes substorm growth, expansion, and recovery phases, each roughly an hour in duration. In the right column the substorm undergoes a driven phase before the eventual northward turning.
++++++++++++++++++++++++
https://agupubs.onlinelibrary.wiley.com/doi/full/10.1002/2016JD024890
https://www.science.org/doi/10.1126/science.284.5412.234
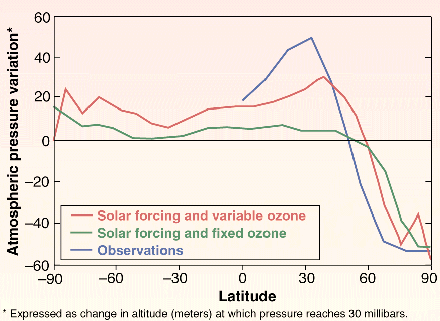 Ozone makes the match.Allowing ozone to vary with sunspots causes a model to react (red) like the real atmosphere (blue).SOURCE: SHINDELL ET AL.
Interesting article from several months ago(from one of the best sources) as we watch to see how far south of it usual position, the polar vortex tracks in January.
++++++++++++++++
Latest 12z Canadian model, with ensembles at the link, below:
https://weather.gc.ca/ensemble/charts_e.html?Hour=384&Day=0&RunTime=12&Type=gz
