As Christmas starts in the E time zone, I decided to start a new NG thread while the NG market is taking time off/napping since the previous thread already has 60 replies. Merry Christmas! Happy Hanukkah, too, as it’s starting Christmas night.
Wow, that was quite the cold Christmas Eve 12Z EE! What will the Christmas models bring? Stay tuned.
0Z eyeball check:
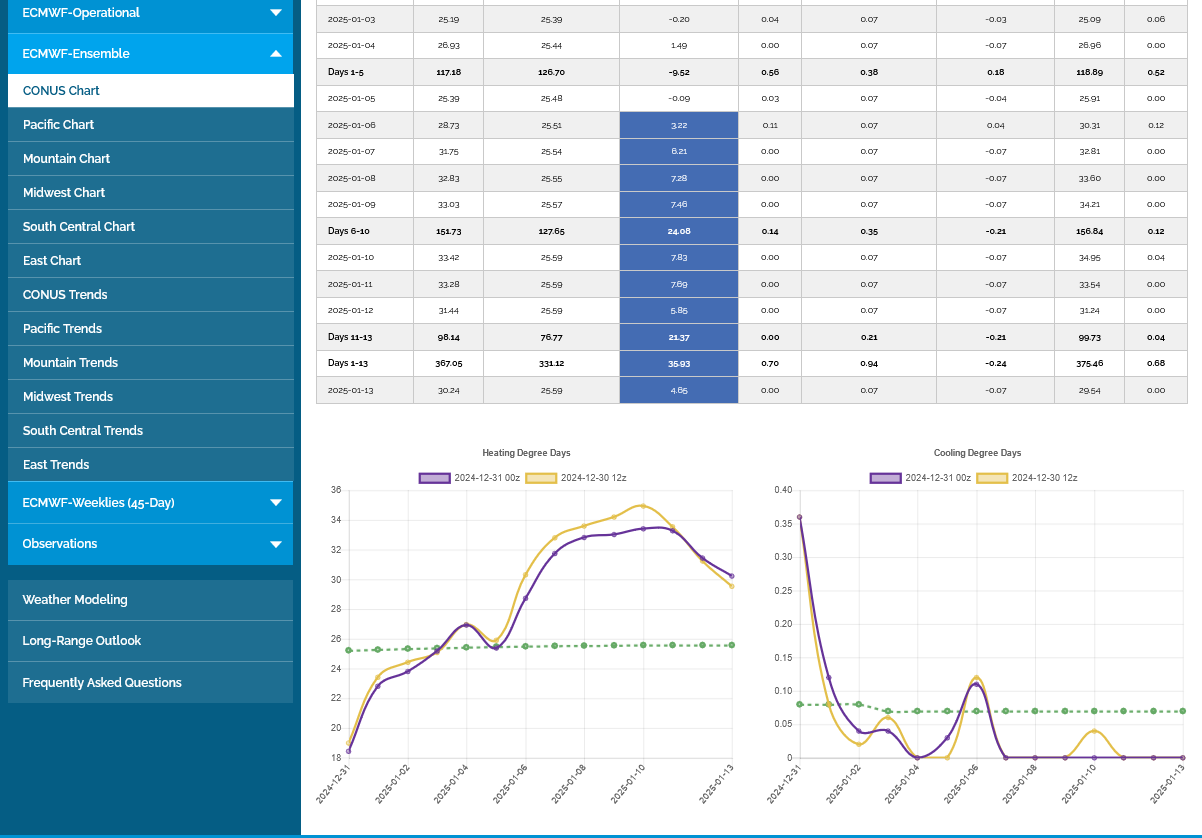
1) Whereas EE retains a very cold look at 500 mb at the end and is still cold overall, the HDDs appear to have dropped a pretty good amount. That’s not surprising considering how cold the 12Z was late in the E US. I’m guessing about a 6-7 HDD drop.
2) GEFS: clearly colder than 12Z…guessing 15 more HDD vs 12Z and 5 more than 18Z. This run at 384 is the coldest run yet vs the extended portions, which go out further at 0Z, of prior 0Z runs. At 384, 850 mb temp. anomalies are MB normal in most of the E 1/2 of the US.
Thanks very much Larry and Merry Christmas/Happy Hanuka to you too!!
Previous thread:
https://www.marketforum.com/forum/topic/109000/
++++++++++++
With regards to your assessments.
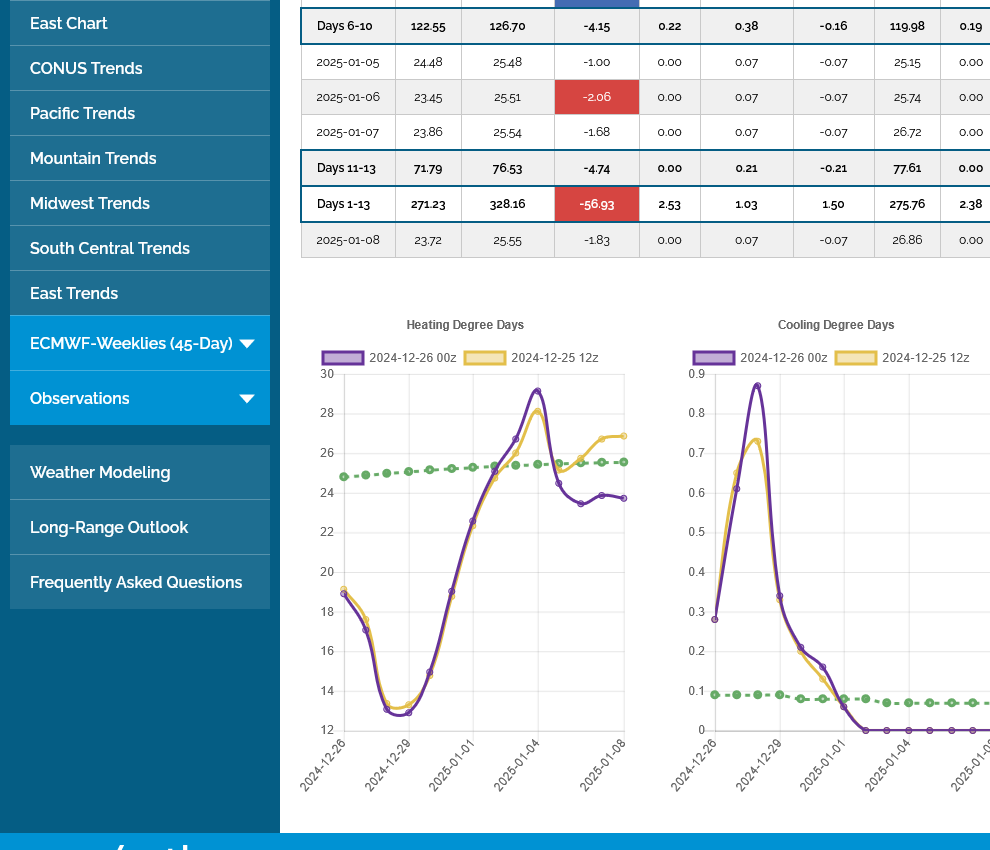
1. The 0z EE was actually -6 HDDs vs the previous 12z run that was +7.5 HDDs which makes it close to the run of 24 hours earlier.
2. The GEFS was not nearly as cold as you thought. The 0z was just +2 HDDs vs the previous 18z run from 6 hours earlier and +8 HDDs vs the 12z run from 12 hours earlier. This last 6z run was actually -4 HDDs(less cold) than the previous 0z run that was the coldest. So this last run was just +4 HDDs compared to the 12z run yesterday (18 hours earlier) when the market was still open.

Here's your Christmas present, Larry!
Thank you for all your wonderful contributions to these awesome conversations that feature a special, very cherished relationship between us.
I really don't think that individual model runs matter as much as THE PATTERN. Individual runs will cause alot of days to be colder or milder just based on model nuances handling individual systems within the pattern or different positions/locations of some important features during certain periods.
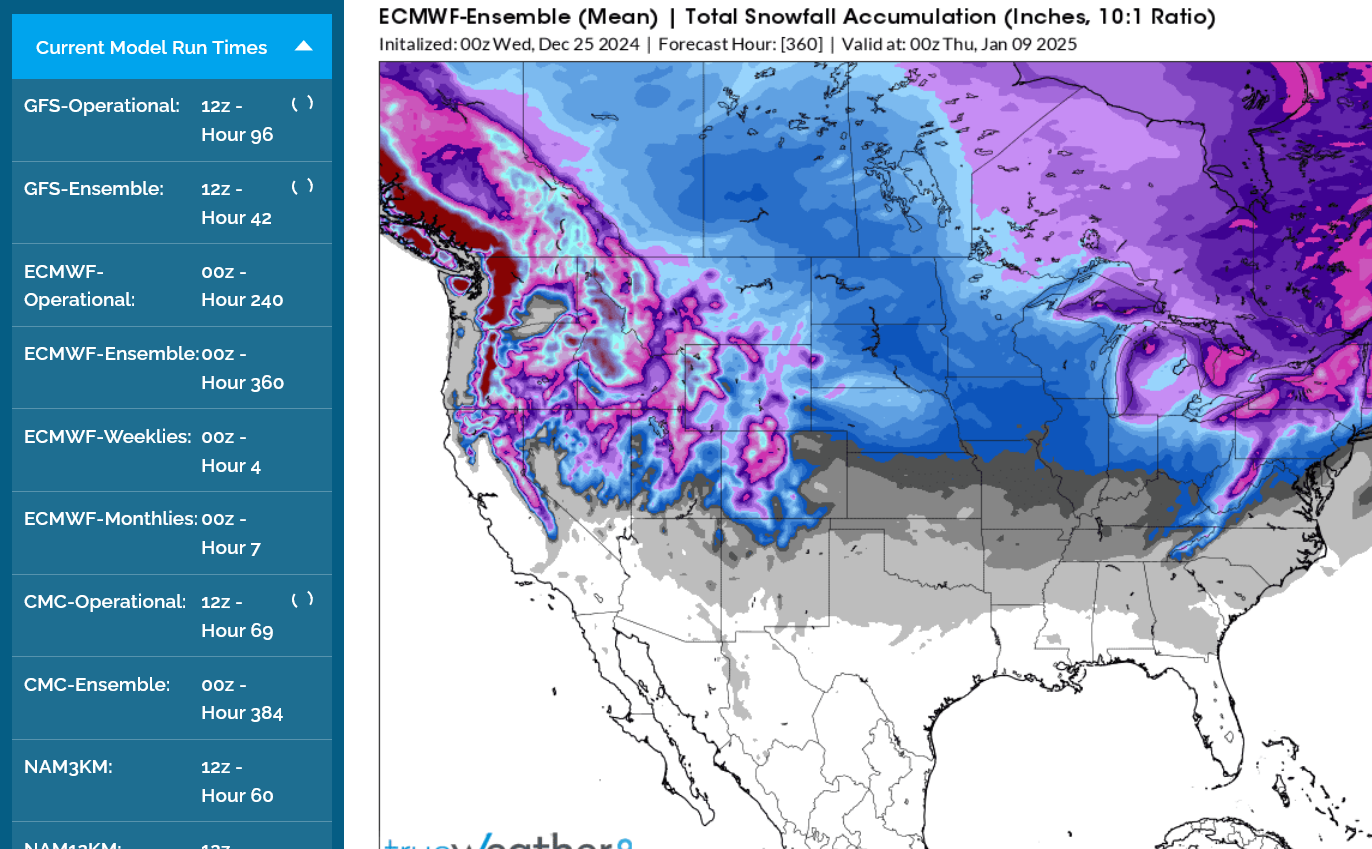
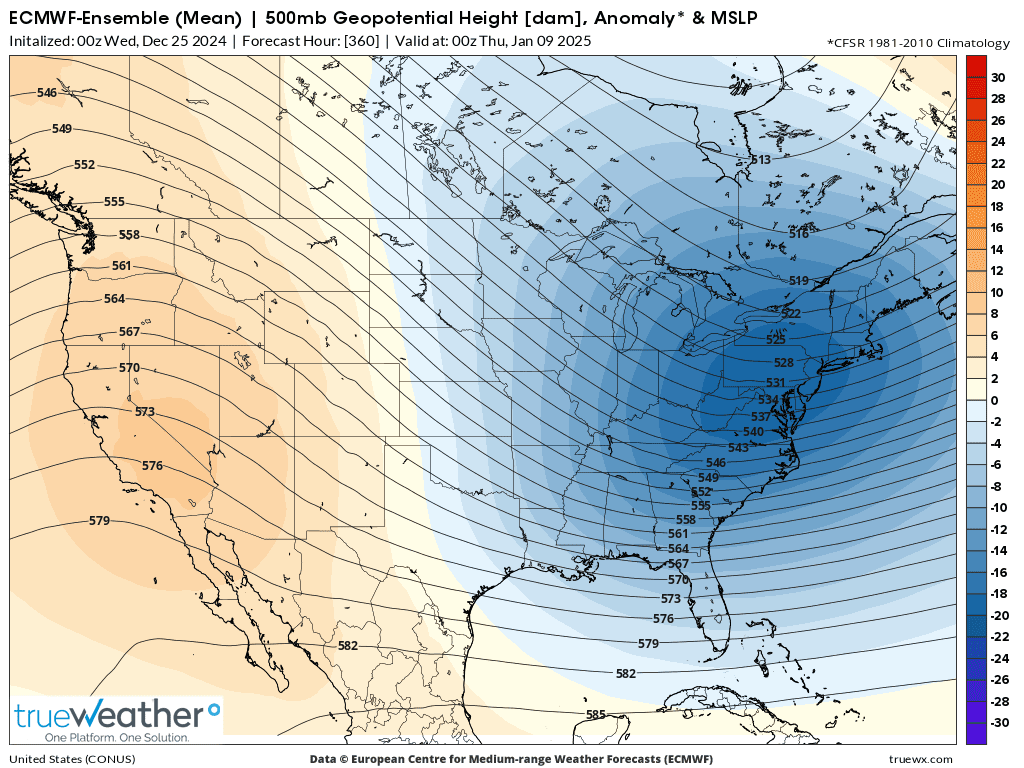
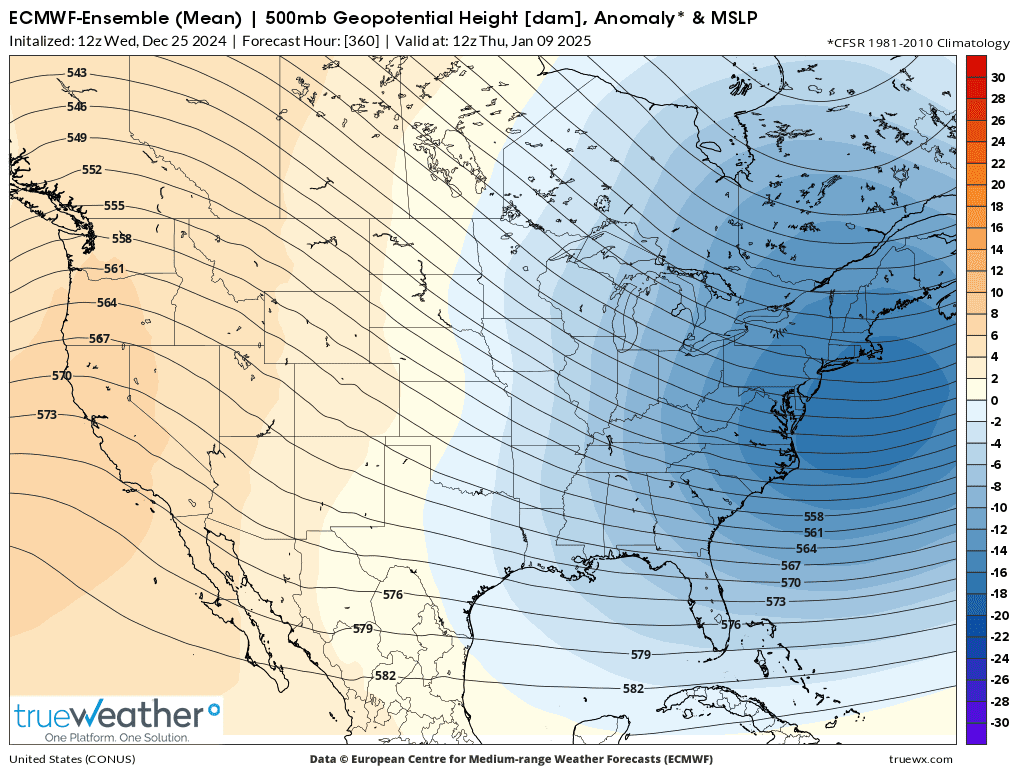
The maps below DEFINE the overall pattern. It's "cold as a Witch's teet"
https://www.mrlocalhistory.org/coldasballs/
The biggest changes from the day earlier indices are:
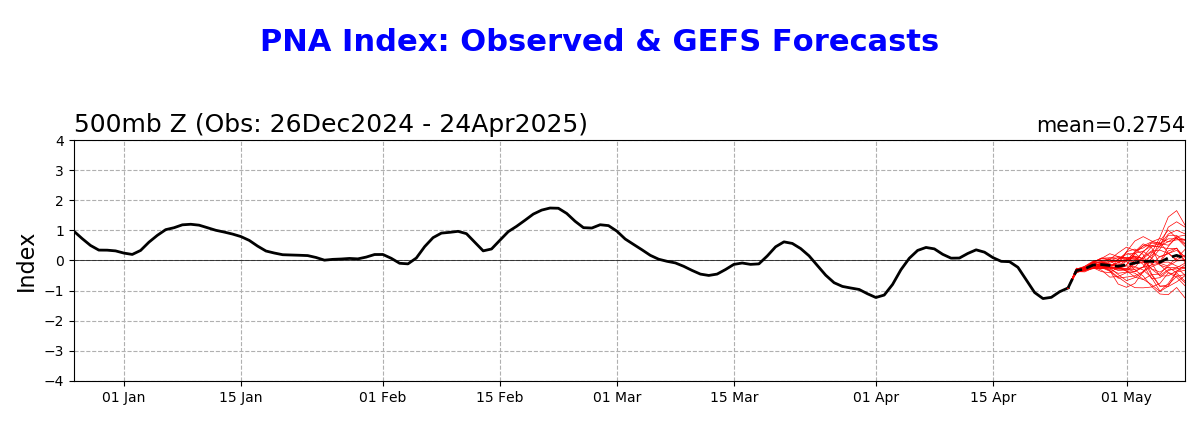
1. The PNA, that had been predicted to go back down to 0 and stay there in week 2, now increases again! This will help to greatly increase the atmospheric pushing force, from north to south contributing to how far south the cold penetrates downstream, in the Midwest and East. This is a function of the models strengthening the upper level ridge in WESTERN North America, especially at higher latitudes compared to 24 hours earlier. The origin of our air masses in mid January will be Siberia!
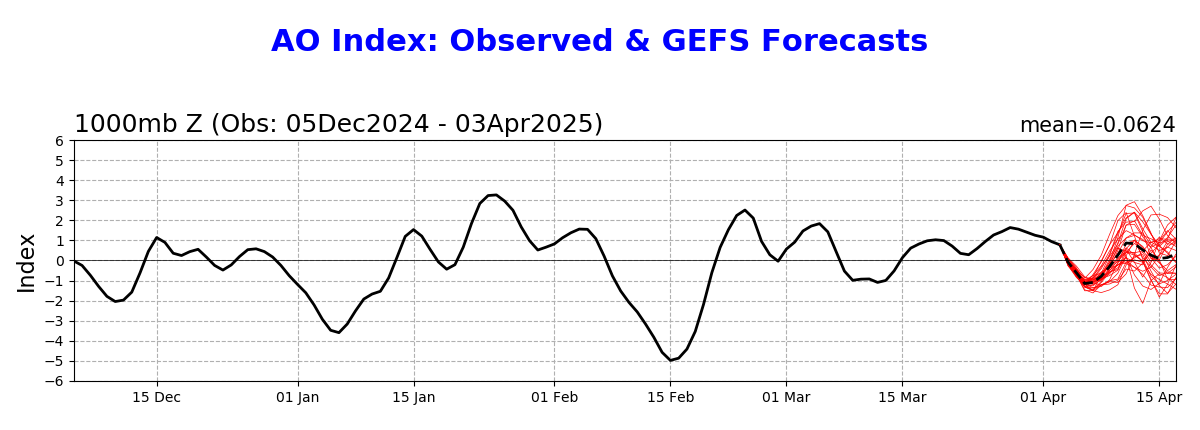
2. The anomaly map continues with very extreme, high latitude blocking(positive anomalies at high latitudes) which suggests a very far south incursion of the Polar Vortex and maximum flushing of cold air from high to middle latitudes, in tandem with the extreme --AO that would ALWAYS be the case.
3. The most extreme positive anomaly today stretches waaaay north, all the way to Siberia which will MAXIMIZE the cross polar flow. Dumping the coldest air on the planet (in Siberia-large air mass with no sun-brewing the coldest air on the planet) into Canada with the SIBERIAN EXPRESS steering currents/jet stream. From there those air masses will plunge VERY deeply into the US, all the way to the Gulf Coast, where sub freezing temperatures are likely. This will greatly impact ALL the high population centers(that burn natural gas to heat their homes) in eastern half of the country.
4. Note how warm it is in Siberia! That's what always happens when the frigid air in Siberia (extreme high latitudes) is flushed down to lower latitudes and air from lower latitudes, replacing it is always much milder./less cold in comparison to THE COLDEST on the planet.
5. That COLDEST air on the planet will modify a bit as it heads south, thru Canada then into the US but we can see that the blue, greatest cold anomalies are in the Central and Eastern US. I think this is being UNDER estimated, considering the extreme nature of the pattern.Historically, this pattern is almost always UNDER forecast by the models.
6. How much snow is on the ground will be a factor. Frigid air masses will moderate much more over bare ground. If we get a big snow event BEFORE the main body of Siberian air hits, temperatures will be 10+ degrees colder than without the snow. Right now, models do NOT have much snow over at least the southern half of the US and snow cover over the northern half is pretty skinny. This would allow for more moderation but I still expect potential for sub 0 lows south of the Ohio River! With a solid snow pack on the ground, well below 0 is possible that far south.
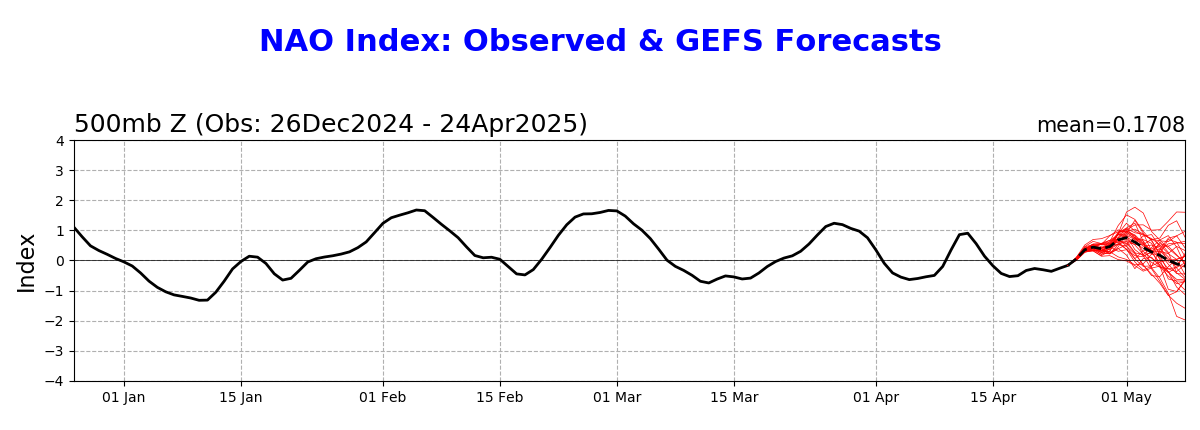
Arctic Oscillation Index, North Atlantic Oscillation Index, Pacific North American Index.
https://www.cpc.ncep.noaa.gov/products/precip/CWlink/daily_ao_index/ao.shtml
https://www.cpc.ncep.noaa.gov/products/precip/CWlink/pna/nao.shtml
https://www.cpc.ncep.noaa.gov/products/precip/CWlink/pna/pna.shtml
++++++++++++++++++++++++++++++++++++++++++++
GFS ensemble mean anomalies at 2 weeks.
https://www.psl.noaa.gov/map/images/ens/z500anom_nh_alltimes.html 
2 week 850 temp for ensemble mean anomaly
https://www.psl.noaa.gov/map/images/ens/t850anom_nh_alltimes.html
++++++++++++++++
2 week snow cover below:
Hey Mike,
1. You’re most welcome! I feel very much the same way about your contributions (which are even more appreciated due to you being a pro-met along with your decades of valuable experience) and how well and enjoyably we interact as human beings!
2. Thanks. Whereas I was close on the 0Z EE’s HDD change, I strongly overestimated (by ~2 to 1 factor) how much colder 0Z GEFS was than 12Z/18Z. These assessments are helpful and interesting! Also, nice point about the +PNA!
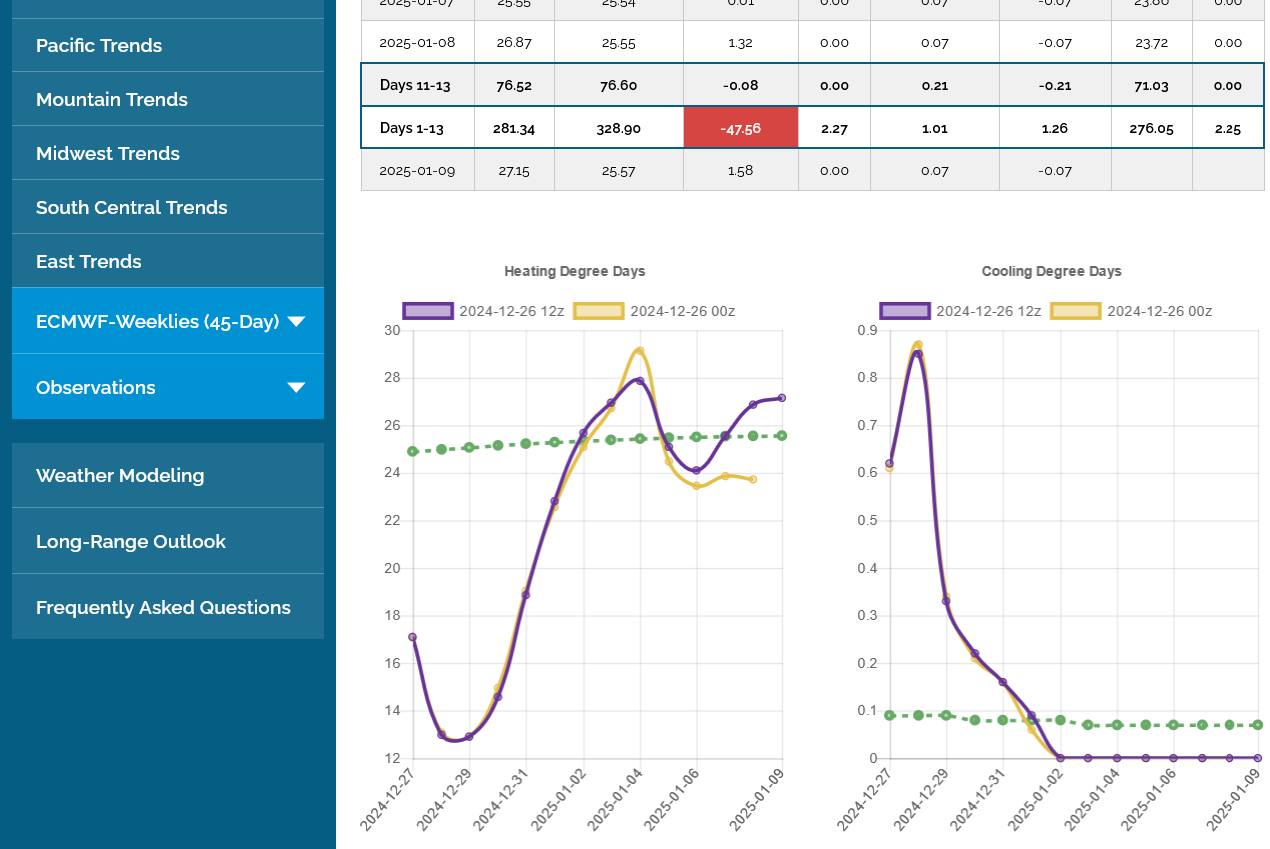
3. My 12Z eyeball update: still cold overall days 9+:
- 12Z GEFS looks colder than 6Z and back at least as cold as 0Z. Did it gain at least the full 4 HDD back? I’m guessing yes, which would mean at least tied for coldest run yet.
- 12Z EE looks colder than 0Z and back at least as cold as 0Z. Did it gain at least more the full 6 HDD back? I’m guessing yes, which would mean at least tied for coldest run yet.
Thanks, Larry.
At my daughter’s house all day celebrating Christmas, so I’m not watching as close as usual but the HDDs were a bit higher like you said!
Another gap higher tonight possible!
Added after the open:
Small gap higher IMMEDIATELY met with selling and closed the gap, now modestly lower.
The next 2 EIAs will be bearish and maybe most of this cold is dialed in for now. Up 9,000/contract on the open since we reversed higher earlier this month.
ADDED at 8pm, after getting back home:
I see why we are lower. The last 12z EE was MUCH less cold at the end compared to the previous 0z run 12 hours earlier!
1. 850 temps from the EE 0z run(12 hours earlier). 0 deg. C isotherm almost down to the Gulf Coast! Coldest yet?
2. 850 temps from the last LESS COLD 12z run of the EE. 0 Deg. C isotherm thru Memphis TN, which was -5 Deg. C on the prior run. So almost +5 Deg. C on the last run in some key, high population centers. Milder EVERYWHERE in the MIdwest/East/South. A tad colder in the Northeast but the cold


++++++++++++
The trough along the East Coast is not AS deep.
1. 0z 500 mb- 10 shades of blue deep
2. 12z 500 mb, 12 hours later........MODERATING from west to east. 9 shade of blue and farther east!
Is this an indication of moderation already at the end of 2 weeks, INSTEAD OF amplification? If so, then this much colder pattern would be transient and only last for 10-15 days or so.
We started dialing it in before it was even showing up at the end of the 2 week period(bullish news on LNG exports really got things ignited). So maybe all the cold is dialed in and now we trade what's AFTER 2 weeks???
The 0z EE was -4.5 HDDs vs the previous 12z run. Despite that, ng spiked to new highs, just above $4 after 2am CST.
Then dropping hard by $3,000/contract by 7am. Maybe just too much too fast with the bitter cold being a week away???
Also, the last EE below is showing HDDS FALLING at the end of the period, NOT continuing to climb. EIA out in less than an hour.
+++++++++++
EIA INFO BELOW:
By metmike - Dec. 22, 2024, 5:49 p.m.
Gap higher on the open? The formation and close on Friday suggests that POSSIBILITY.
HOWEVER:
It's going to get tricky up here. The high on Friday was up over $7,000/contract since Tuesday's low and we still have over a week of very mild temps to go before the MAJOR cold starts hitting.
Additionally, the next 2 EIA reports will be seasonally BEARISH.
7 day temps last week for this next one:
https://www.cpc.ncep.noaa.gov/products/tanal/temp_analyses.php
++++++++++
update: The EIA report is delayed 1 day because of Christmas. Out on Friday, 12-27-24 at 9:30 am CST.
Hey Mike,
1. 6Z/12Z eyeballing:
GEFS: 6Z colder than 0Z and 12Z colder than 6Z
EE: 12Z maybe slightly colder than 0Z but should be close
2. I’ve got a hypothesis:
0Z EE tends to be warmer than preceding 12Z
12Z EE tends to be colder than preceding 0Z
Any thoughts? Have you noticed these tendencies?
Looking back through the last 2 threads alerted me to this. I plan to research this further as I get time.
You could be right, Larry. Sometimes there could be model tendencies that take that form. I hadn't noticed it in this case but I've been really busy with holiday gatherings and my family/kids/grandkids.
On this last run, you nailed it: 12z GEFS was +4 HDDs, the 12z EE(below) was +5 HDDs. This gave NG ZERO bullish traction which is an extremely bad sign(market no longer able to go up on bullish news).
I will assume that we had a short term buying exhaustion and $4 was an impossible wall of resistance to overcome with buying drying up at that level.
Larry,
I quickly went thru previous posts like you did and observed this same trend with recent EE runs.
12z =colder. 0z =milder.
I can't readily explain it. There could be something related to the initial conditions or model bias. Or it could be random variation with independent odds, like what happens when flipping a coin that results in 5 or even 10 coin flips in a row that land on heads(or tails). Each time, the chance for heads is still 50%.
In this case, your highly trained observation skills observed something that has REALLY been happening. Now we can continue to track it to see if it continues or if it was mostly random variation.
This was the last post from 2 weeks ago which completely contradicted that pattern(many of the HDD numbers during these 2 weeks were NOT reported by me and its possible others could be included in this contradiction).
https://www.marketforum.com/forum/topic/108738/#108936
By metmike - Dec. 11, 2024, 1:54 p.m.
Will the EE tonight be milder/have less HDDs???
Mike asked based at least partially on my hypothesis that the 0Z EE tends to be warmer than the 12Z:
“Will the EE tonight be milder/have less HDDs???”
———-
Hey Mike,
It is almost as if the wx model gods decided to shut me up with an exclamation mark! <G>:
The 0Z EE per my eyeballs looks drastically colder than the 12Z! I’m guessing 20 HDD colder than the 12Z, meaning 25 colder than yesterdays 0Z! This has to be the coldest EE yet.
NG rose a whopping 3% on this!
For sure the coldest yet, Larry!
+14 HDDs for this last 0z EE compared to the previous one.
Yes, I think that does blow a big hole in the potential warm bias 0z run theory for the EE.
Whats also interesting is that the GEFS was actually -2 HDDs milder.
But the mildest model of all was the Canadian model.
it greatly deamplified the ridge-west, trough-east pattern so there is no longer much cross polar flow.
mostly air of mild pacific origin mixed with Canadian air with a bit of southern Arctic air in at times.
Not sure what was expected for this EIA report but the last 6z GEFS was another -8 HDDs vs the previous run after that 0z run was -2 HDDs compared to the one before that.
Also, the front month, January expires in a few hours and that could be gravitating towards the cash price, which is impacted by this current, very mild weather.
+++++++++++
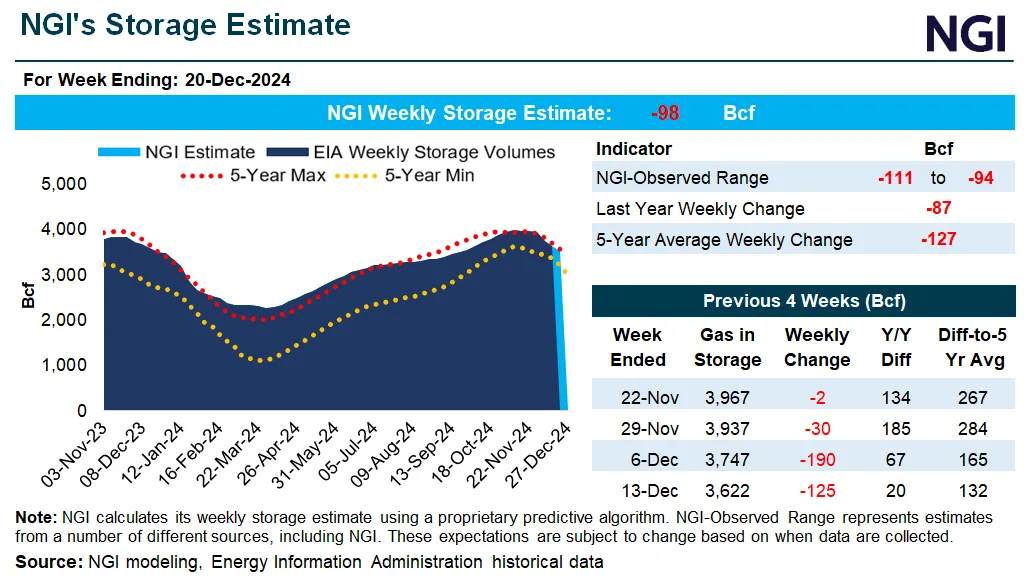
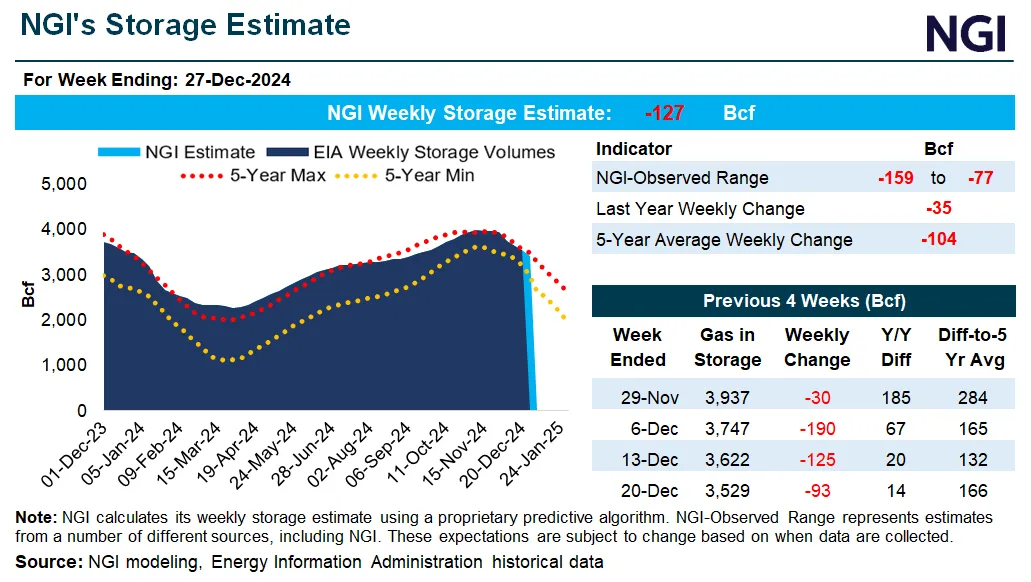
-93 Bcf
![]()
for week ending December 20, 2024 | Released: December 27, 2024 at 10:30 a.m. | Next Release: January 3, 2025
| Working gas in underground storage, Lower 48 states Summary text CSV JSN | |||||||||||||||||||||||||
|---|---|---|---|---|---|---|---|---|---|---|---|---|---|---|---|---|---|---|---|---|---|---|---|---|---|
| Historical Comparisons | |||||||||||||||||||||||||
| Stocks billion cubic feet (Bcf) | Year ago (12/20/23) | 5-year average (2019-23) | |||||||||||||||||||||||
| Region | 12/20/24 | 12/13/24 | net change | implied flow | Bcf | % change | Bcf | % change | |||||||||||||||||
| East | 792 | 822 | -30 | -30 | 813 | -2.6 | 801 | -1.1 | |||||||||||||||||
| Midwest | 960 | 1,007 | -47 | -47 | 995 | -3.5 | 959 | 0.1 | |||||||||||||||||
| Mountain | 267 | 274 | -7 | -7 | 233 | 14.6 | 195 | 36.9 | |||||||||||||||||
| Pacific | 293 | 296 | -3 | -3 | 281 | 4.3 | 250 | 17.2 | |||||||||||||||||
| South Central | 1,217 | 1,222 | -5 | -5 | 1,192 | 2.1 | 1,157 | 5.2 | |||||||||||||||||
| Salt | 349 | 338 | 11 | 11 | 330 | 5.8 | 327 | 6.7 | |||||||||||||||||
| Nonsalt | 868 | 884 | -16 | -16 | 862 | 0.7 | 830 | 4.6 | |||||||||||||||||
| Total | 3,529 | 3,622 | -93 | -93 | 3,515 | 0.4 | 3,363 | 4.9 | |||||||||||||||||
| Totals may not equal sum of components because of independent rounding. | |||||||||||||||||||||||||
Working gas in storage was 3,529 Bcf as of Friday, December 20, 2024, according to EIA estimates. This represents a net decrease of 93 Bcf from the previous week. Stocks were 14 Bcf higher than last year at this time and 166 Bcf above the five-year average of 3,363 Bcf. At 3,529 Bcf, total working gas is within the five-year historical range.
For information on sampling error in this report, see Estimated Measures of Sampling Variability table below.

Note: The shaded area indicates the range between the historical minimum and maximum values for the weekly series from 2019 through 2023. The dashed vertical lines indicate current and year-ago weekly periods.
Hey Mike,
1. Per NGI, the range of guesses was -94 to -111. So, the -93 actual was a bit bearish vs the midpoint.
2. From NGI:
“Natural gas futures rose sharply in early trading Friday as the European weather model for early January trended colder overnight.
The European model, which had been showing less severe cold for January than the U.S. ensemble, added a stout 17 heating degree days overnight for the first 10 days of January, putting the two models in better agreement, said NatGasWeather.“
Thanks, Larry!
++++++++
Next Thursday's EIA will be very bearish compared to most historical late December numbers.
I'm not sure where we go from here. The market keeps giving strong signals of wanting to go in either direction but the complete lack of any bullish follow thru on bullish weather updates is a warning sign for the bulls, especially since seasonals turn pretty negative here and we've had a nice bullish ride to dial in a ton of cold and storage remains very robust.
However, if the cold LASTS in January, its hard to imagine prices NOT responding to the upside with higher highs.
It's Friday, too. Traders will be placing bets on the weather maps the market uses for the Sunday open........which very often features A GAP higher or lower.
We need MORE cold to keep going higher, which is still very possible.
I’d bet very heavily on the 12Z EE being less cold than the very cold 0Z because of how much colder the 0Z was vs the prior 12Z and even moreso because it’s significantly less cold for Jan 3-7 overall.
Edit: I still say this despite Jan 9-10 looking colder overall/very cold end. Mike, what day you?
I've been so busy that I'm not fully tapped into the EE products but will look in a second.
The 12z GEFS was a whopping +13 HDDS vs the previous 6z and +3 HDDs vs the 0z run. We are near the lows now.
OK, I looked at the 12z EE compared to the 0z EE on WeatherBell.
It looks a bit COLDER to me at the end of the period!!
TrueWeather has just started the first couple of maps, only out 2 days. WeatherBell is done with the run thru 360 hours. Thanks very much, Larry for posting here to make me aware of this. It's a HUGE deal for trading where timing and positioning BEFORE the market reacts is EVERYTHING!
++++++++++
Added:
This is bouncing the market off the lows.
The colder look is because the deep trough in the Eastern US is slightly deeper/farther south AT THE VERY END OF THE PERIOD!
However, I note that the center of the polar vortex was farther south on the previous run.
Added 2pm: The HDDs are finally out and they are -1.5 HDDs total (from milder 1-2 to 1-7 = -8 HDDs) for the entire period but close to +2 HDDs at the very end.
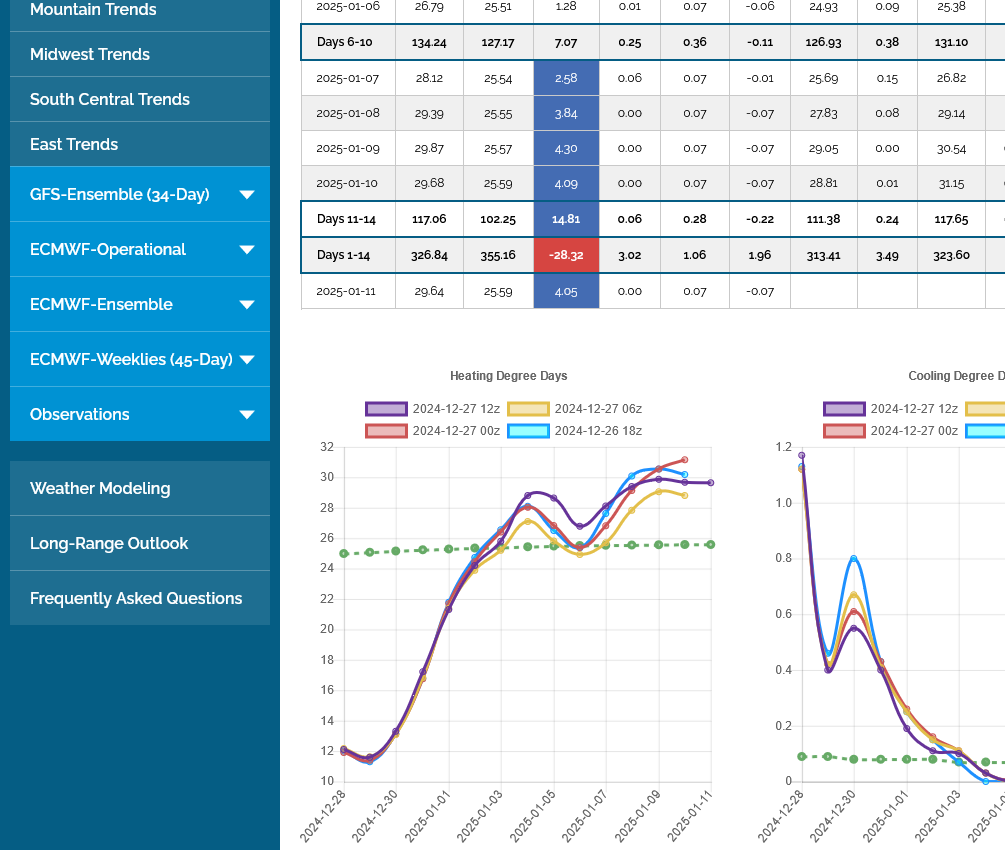
Mike,
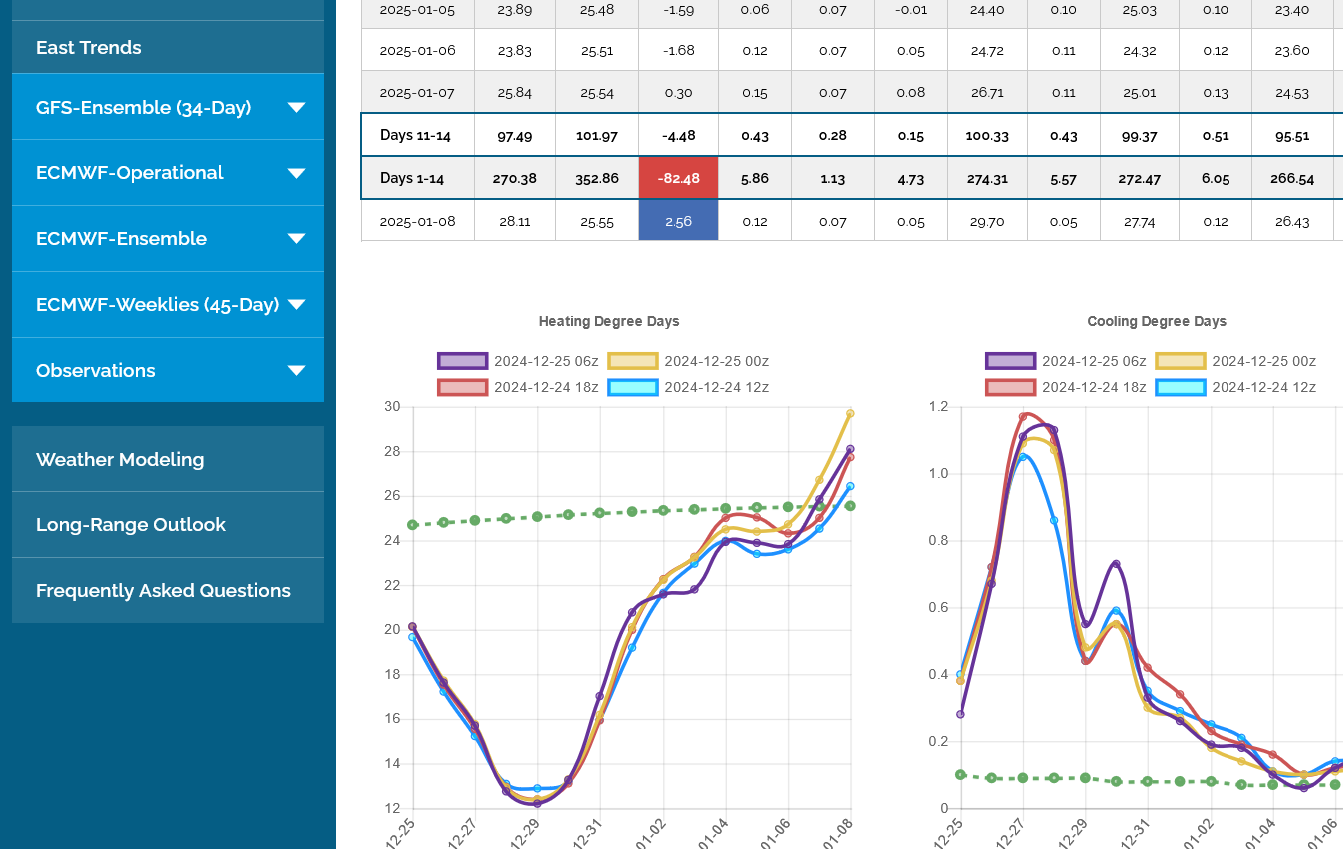
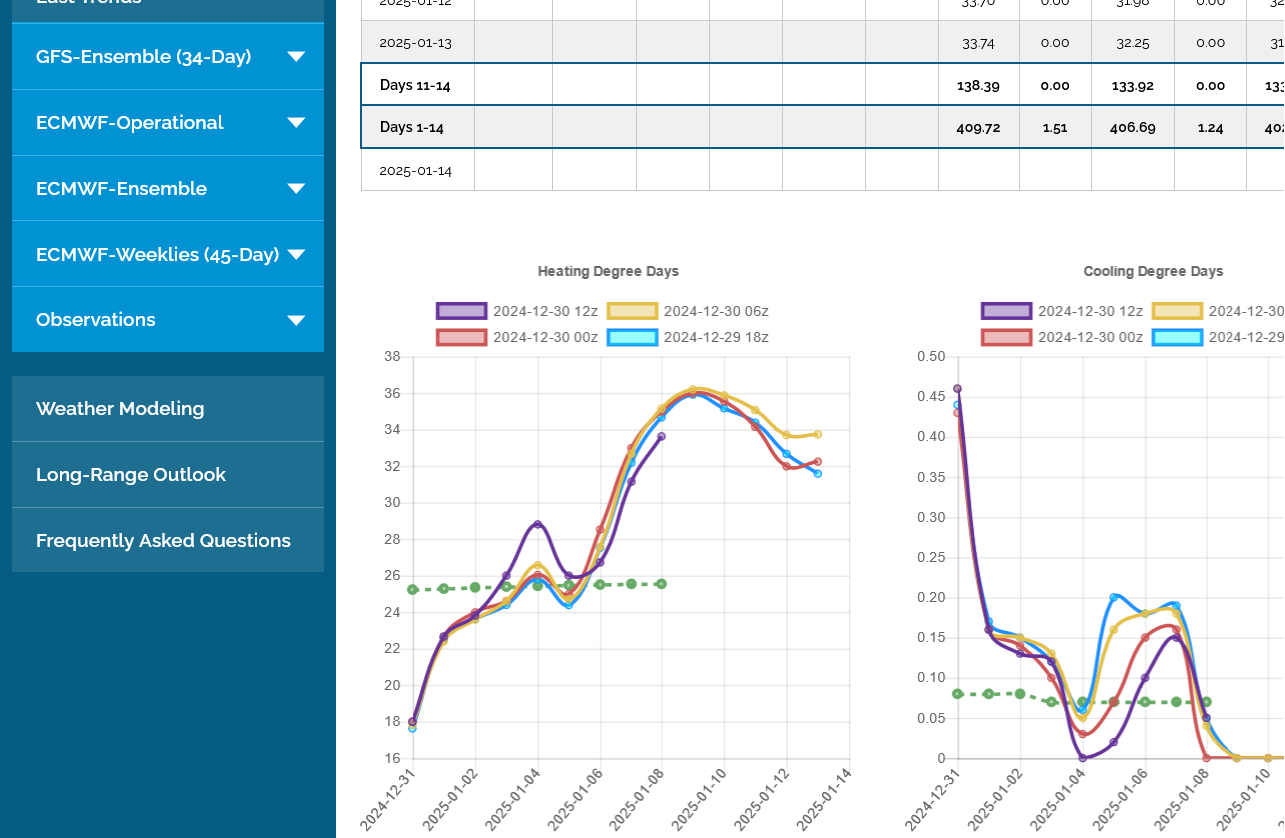
Would you please post the TrueWx HDD for just the East (EE and GEFS)? TIA
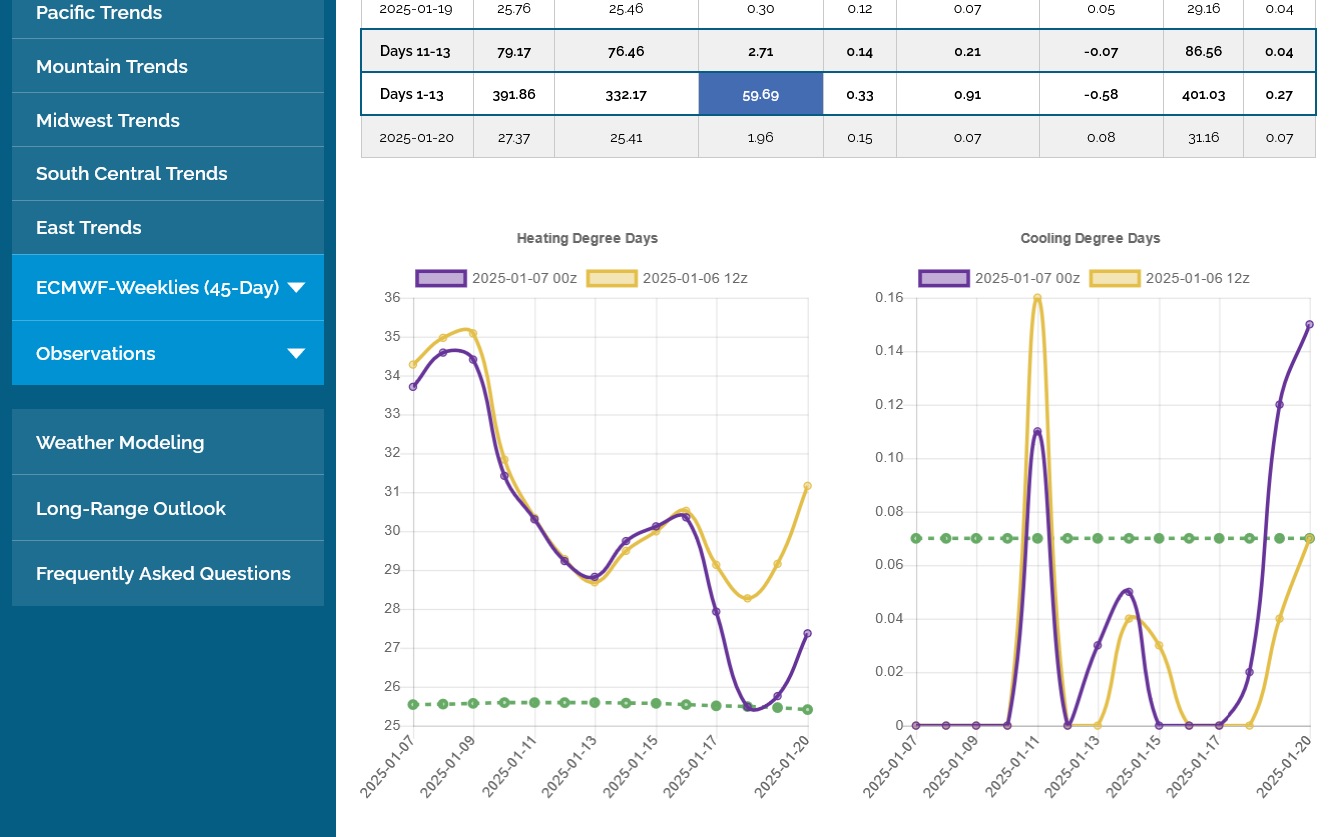
No problemo, Larry!
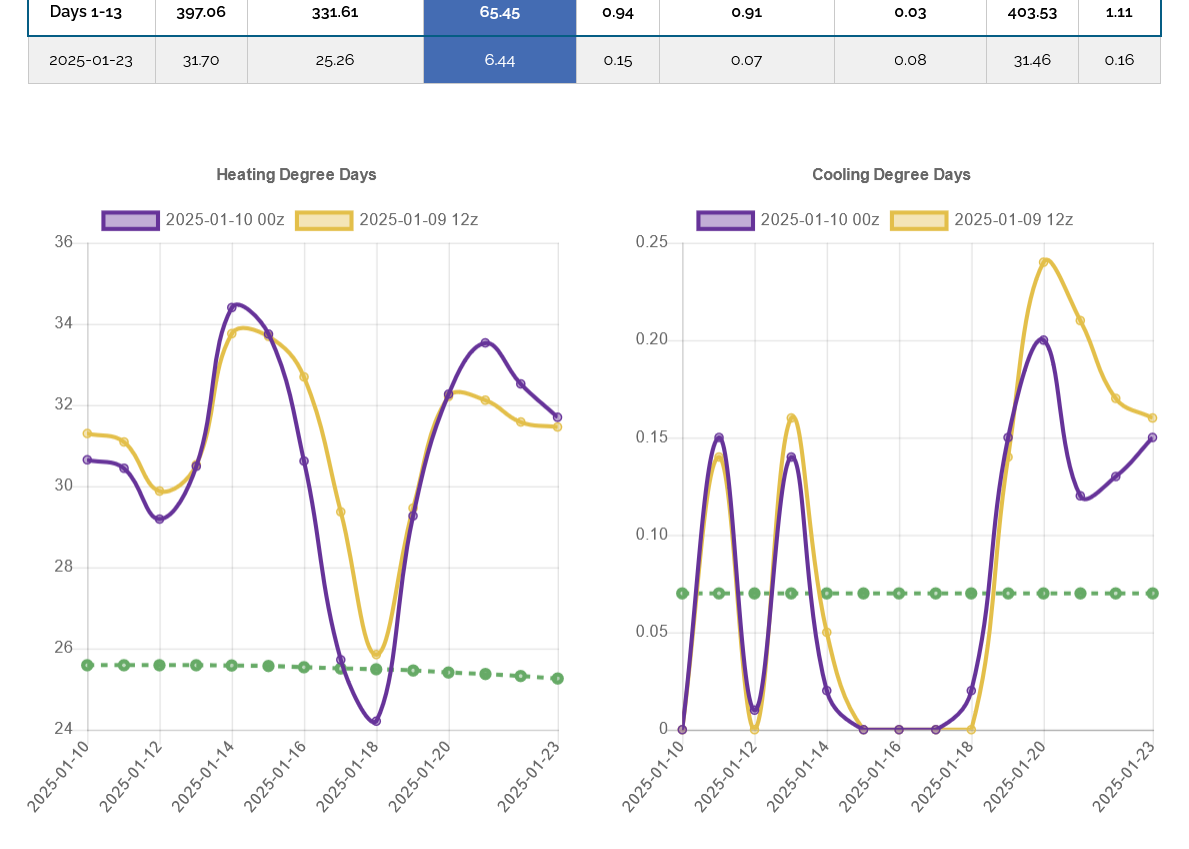
The last runs are in purple/left for new readers.
1. GEFS in the East was a whopping +20 HDDs vs the previous 6z run and +4.6 vs the 0z before that run.
2. 12z EE in the East was -4.6 HDDs vs the previous 0z run.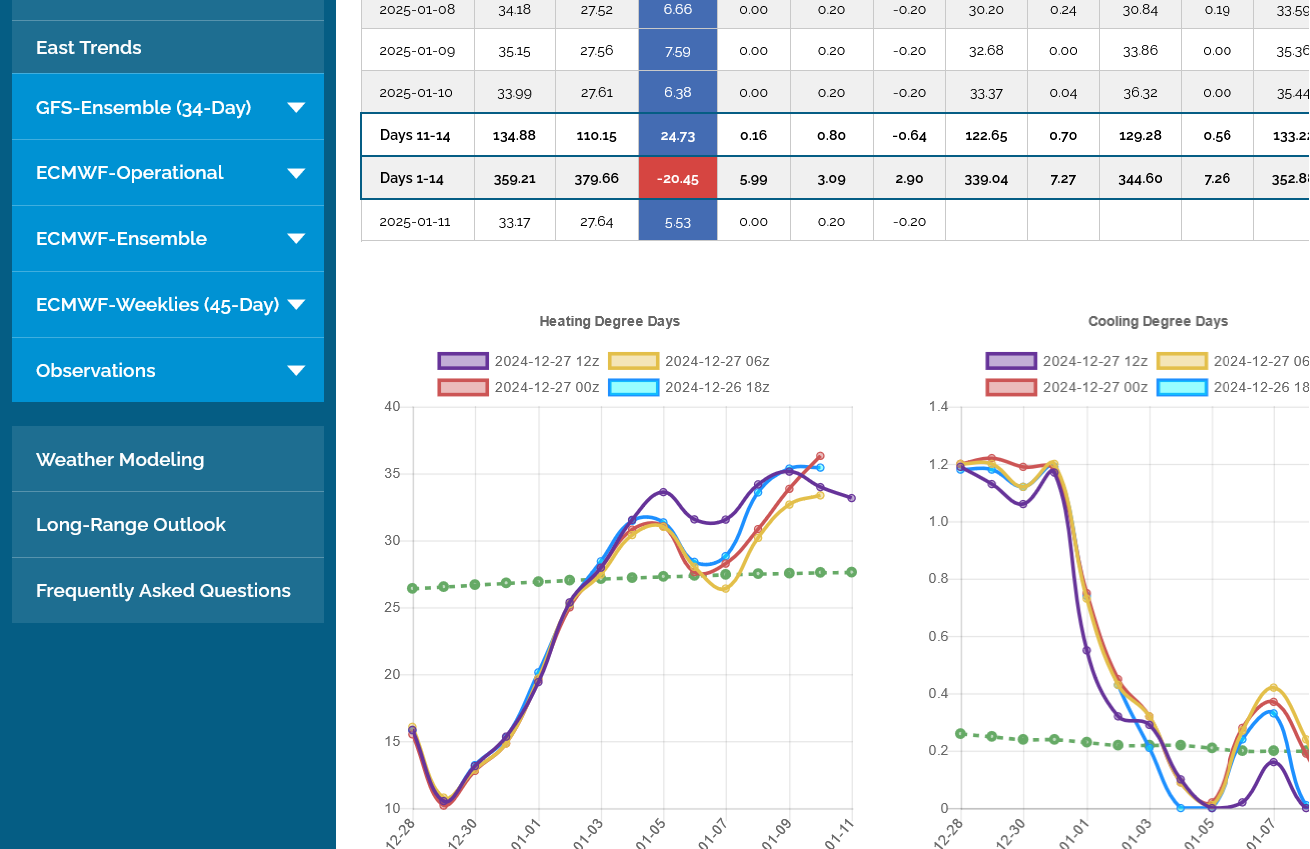

++++++
In retrospect, I would think that it was the much colder GEFS that bounced us off the lows, even though the market did not react initially.
The market could have also been waiting for the January contract to expire? since it went off the board in solid negative territory.
NOAA thinks the cold has staying power in the East, with the ridge/west, trough/east couplet remaining thru the week 3-4 period, January 11-24, 2025!
https://www.cpc.ncep.noaa.gov/products/predictions/WK34/
I finally got the chance to spend a bit more time using the WeatherBell products. Extremely impressive stuff, especially for South America too.
Surprised at how bullish the weather is for Argentina and beans still dropped today.
But here's how that goes.
I've been bullish on Argentina's weather now just about all month. Using the non WeatherBell products(GEFS), the weather isn't looking any more bullish today.
However, looking at Argentina using products NEW TO ME, makes it look much more bullish today vs yesterday.
But the market had those products all month. Traders will suddenly get or see something thats been there for awhile, for the first time and want to use that.
You have to see it BEFORE the market sees it, not AFTER the market saw it and dialed it in.
Larry and I thrive on NEW information and comparing the NEWEST information with the previous information.
-9 Hdds on the 18z GEFS compared to the 12z cold one
+2 HDDs for the 0z GEFS
+7 HDDs for the 0z EE
Sharply higher open???
NG, for me however is in a selling set up!
When models get a better grip on the end of this cold with the moderation beginning, possibly as early as late week 2.
Whoa!
We opened and spiked to more than +$3,500/contract higher in the first few seconds!!
Enormous upside gap higher. That might end up being the highs, unless the models get colder!
over 7,000 contracts traded in 6 minutes for the new front month, February.
Added: This was obviously an enormous upside breakaway gap.(clearly last evening was NOT the highs as models turned much colder overnight)
The models got colder and colder overnight.
NG spiked to over $8,000/contract higher than the close on Friday, just before 9am!
Volume for just the February contract is OVER 200,000!!!!
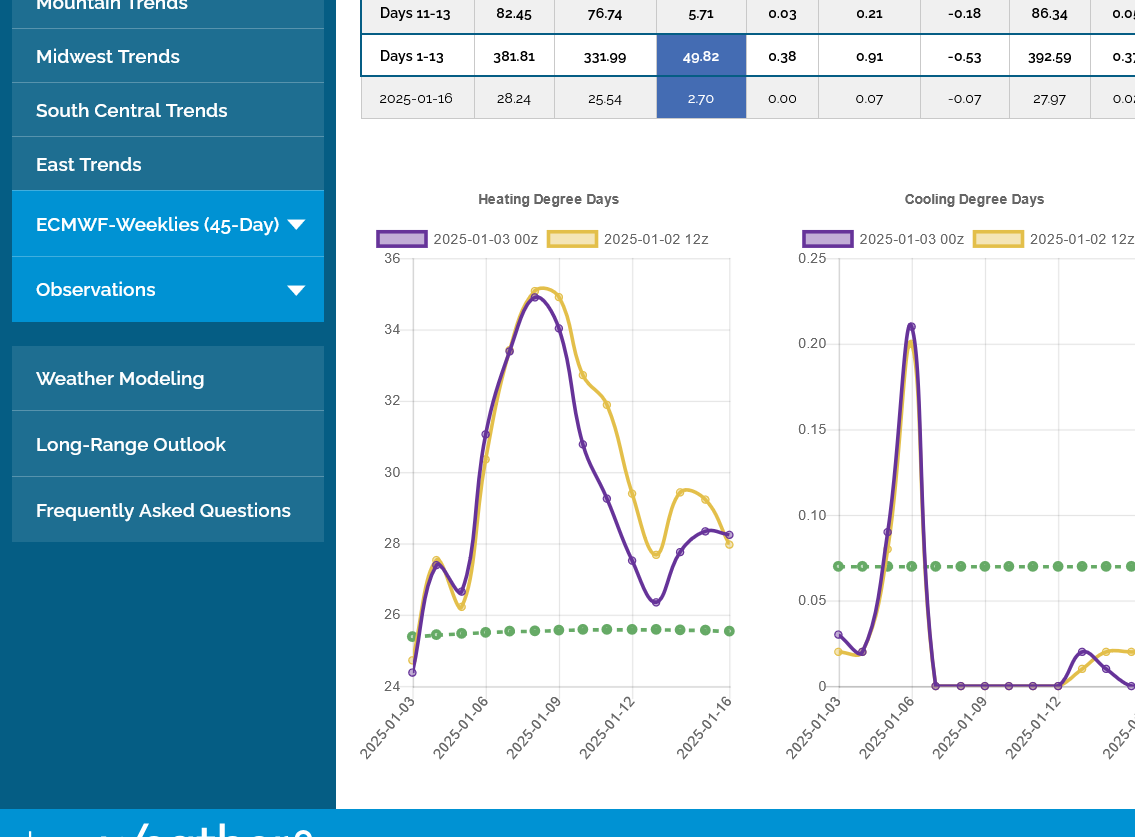
This was the last 0z EE. Another +7 HDDs vs the previous 12z EE. (Purple line on the left).

Very good chance that earlier this morning DID mark the high.........if the models are not even MUCH colder yet.
Hey Mike,
I’m no longer feeling that my initial hypothesis of the 0Z EE tending to be warmer than the 12Z will be proven true. However, only if you’re not too busy to do so, would you please post the latest US GEFS DD maps showing yesterday’s 12Z (before it’s no longer available) and today’s 0Z? I’m asking because it does seem like the EE is usually colder than GEFS. TIA.
Thanks, Larry.
When the new 12z HDD data started, (45+ minutes ago?) the 12z from the prior day vanishes forever. Sorry.
I’m asking because it does seem like the EE is usually colder than GEFS. That might be right but have not noticed that, other than random variation.
Looking at the WeatherBell EE maps, the 12z run is a bit COLDER just before day 10 but MILDER after that to the end.
12z HDDs have not even started on TrueWeather.
+++++++++++++
1:45pm. 12z HDDs from the EE just finished. -8 HDDs compared to the last 0z run! The 12z GEFS was -4 HDDs from the 0z run and -7 HDDs from the MEGA COLD 6z run.
The 12z Canadian model, however was the only COLDER model compared to the 0z run.
We are $3,000/contract off the highs right now and it looks like the top is in.
MUCH colder models can change that of course.
February natural gas futures rocketed higher Monday as frigid weather forecasts for January sent traders scrambling to position for possible freeze-offs and erasure of supply surpluses in January.
++++++++++++++
EIA temps below. Cold in the East Coast. Mild everywhere else. Last year's drawdown was a wimpy -35 Bcf, so we will continue to erode the surplus. Later this month, we will take huge chunks out of the surplus and could be approaching the 5 year average by the end of the month!
https://www.cpc.ncep.noaa.gov/products/tanal/temp_analyses.php
The 0z European Ensemble model (below) was LESS cold by -8 HDDs than its 12z run and ng crashed when it was just coming out(even after the 0z GEFS was COLDER vs the previous runs). The 6z GEFS, however was also less cold. We are $1,500/contract lower right now.
As previously speculated, the spike highs early on Monday($4,000/contract higher than this) appear to be THE highs but sustained cold in January that lasts long enough can cause NEW highs.
We’re 6,000/contract off the highs now and down 3,000/contract just today.
Also have partially filled a small part of the top of the massive gap higher from sundaus open.
this is all from the weather models turning less cold, starting with last nights 0z runs.
this last 12z EE was down another-9.5 HDDs compared to the previous run. All at the end of the period.
my focus right now is turning to the potential for our biggest winter storm in some time here in Evansville next Sunday and monday.
The chart formation likes a gap lower on the open but the weather says a bit higher to start the first session of 2025.
Update: Just a tad higher on the open and hanging close to unch in the 1st minute with fairly low volume.
Hey Mike, Are 18Z GEFS HDD significantly lower than prior runs?
You nailed it, Larry!!! -11 HDDs compared to the previous 12z run, 6 hours earlier! NG is down around $700/contract from the highs from this(make that $1,000-we just spiked down). The 18Z HDDs are the purple line on the left.
Volume of 6,300 is fairly light.
+++++++++
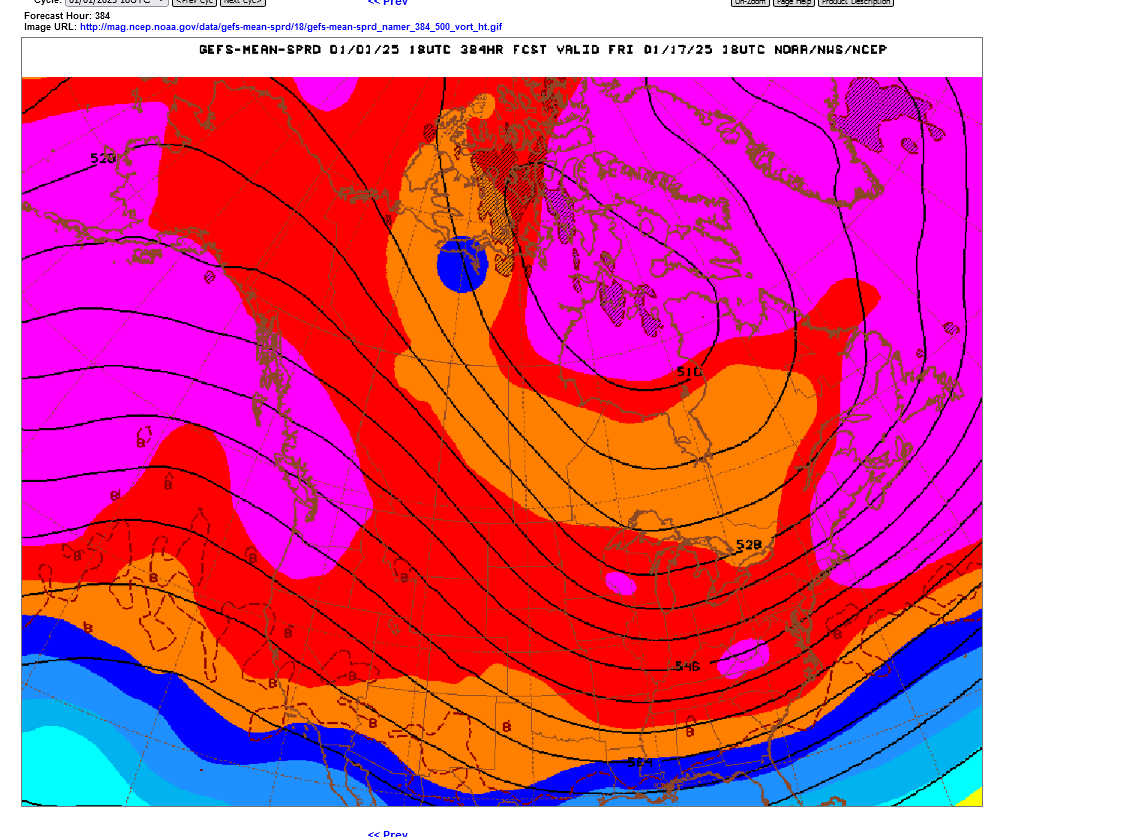
Despite this significant drop in HDDs and the purple line on the graph above looking like we are headed towards EVEN LOWER HDDs. The actual weather pattern at the very end of the period still looks VERY COLD.
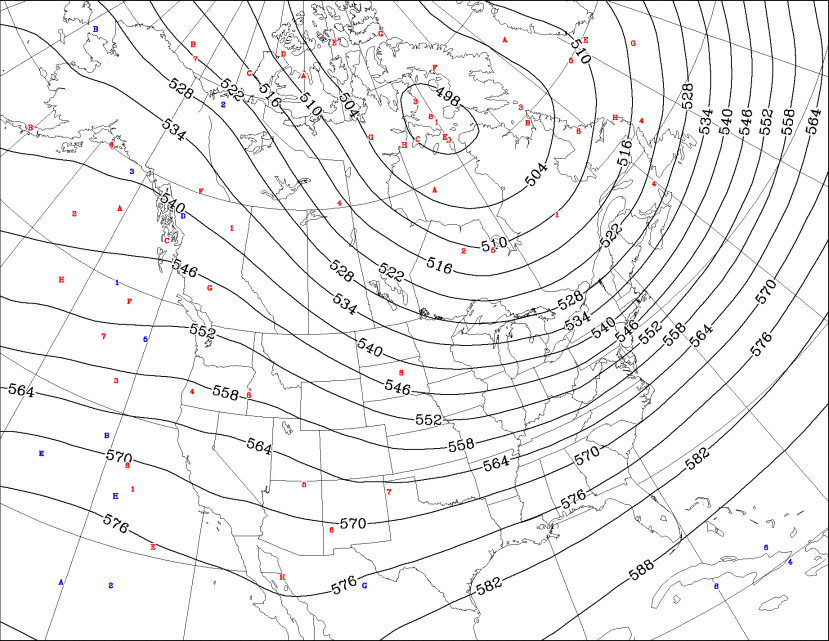
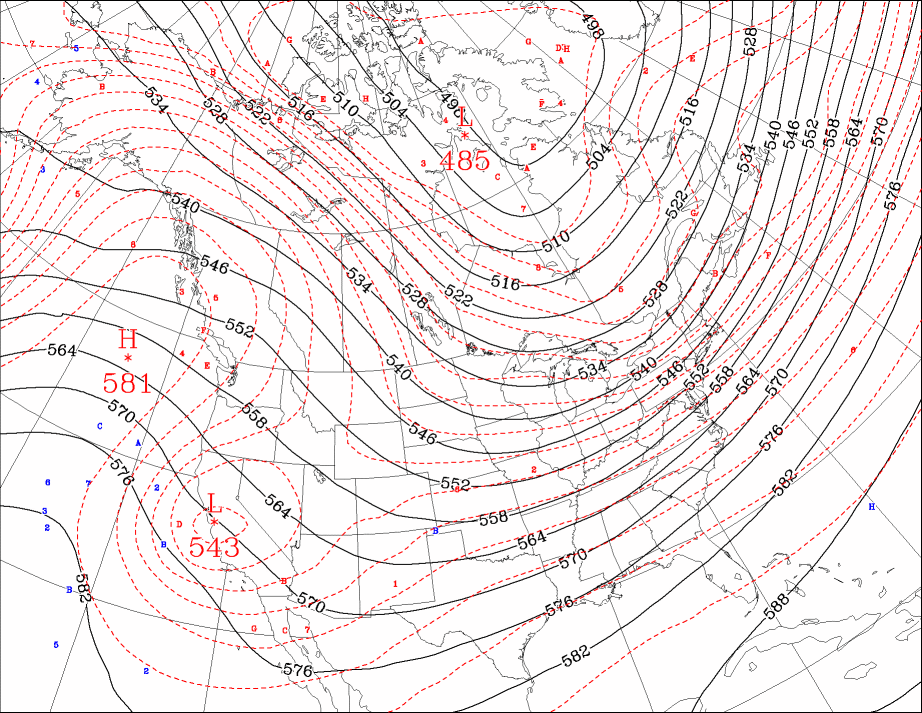
This was the last 500 mb map for 384 hours on the 18z GEFS.
We still have cross polar flow with an amplified ridge/west, trough-east couplet(teleconnection).
The polar vortex is displaced pretty far south still, over Hudson Bay in Central Canada. This is NOT bearish. However, it may take increasing cold to generate fresh aggressive buying after the extreme spike higher, buying exhaustion signature on the charts earlier this week. Also, in the 2nd half of Winter, when storage is still high, it requires MORE EXTREME cold to inspire speculators compared to the first half of Winter. That's partly because there is less and less time to draw down stocks as the heating season goes by.
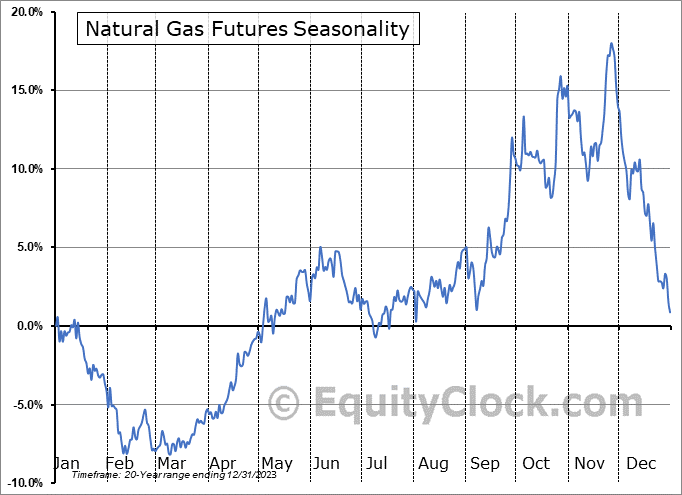
As a result, natural gas seasonals are solidly bearish in January.
Natural gas has been acting contra seasonal in December because of the extreme cold weather outlook for January.
https://charts.equityclock.com/natural-gas-futures-ng-seasonal-chart
+++++++++++++++
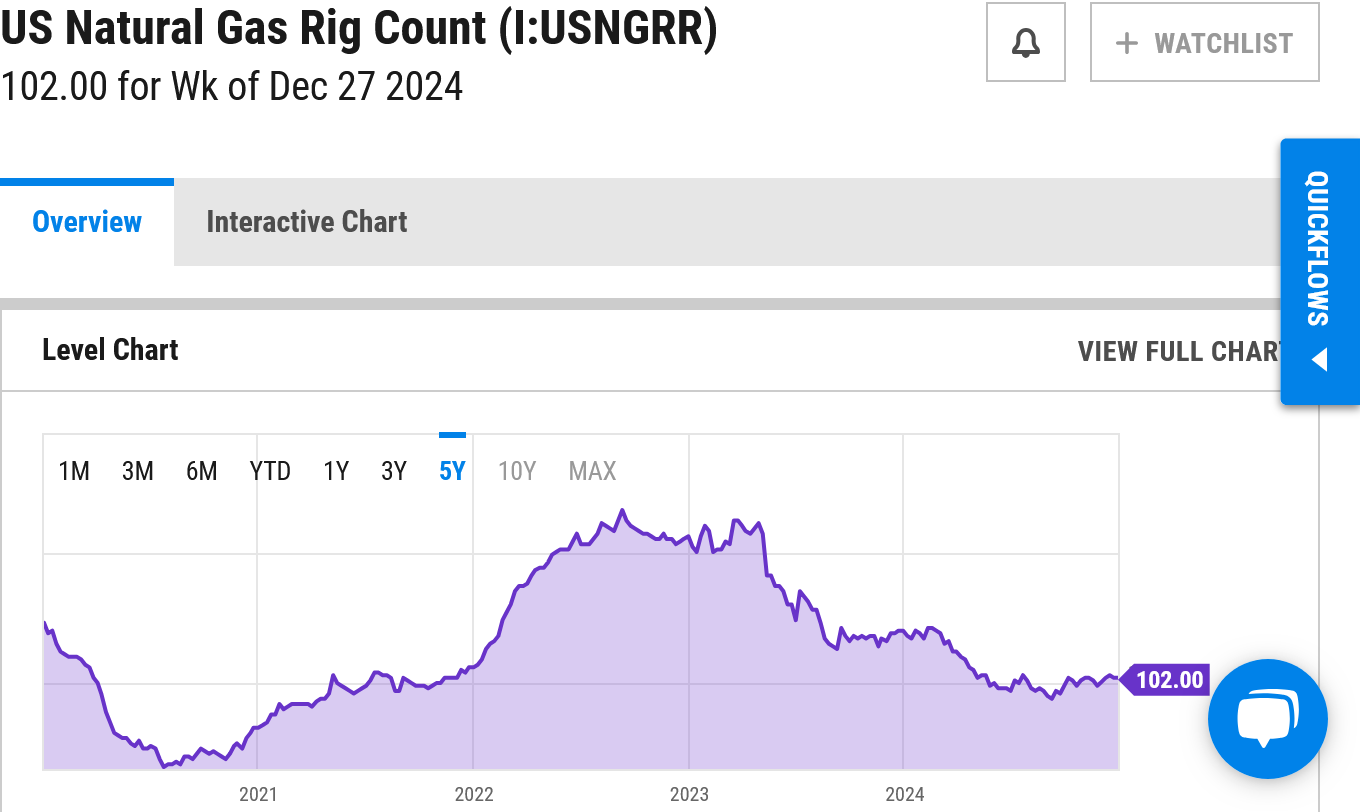
The rig count is actually a bit friendly.
https://ycharts.com/indicators/us_gas_rotary_rigs
Larry,
The last 0z GEFS was a whopping +17 HDDs!!!
-Wow! If you get a chance please post the updated HDD graph that includes the 0Z GEFS. TIA. Would that make the 0Z GEFS the coldest GEFS run yet?
-My eyeballs are roughly guessing that the 0Z EE is 3-7 warmer than the 12Z EE.
Larry,
Actually, the 0z EE was .5 HDDs COLDER than the 12z run.
The 6z GEFS was -2.5 HDDs vs the previous coldest 0z run but +14 HDDs colder than the mild outlier 18z run.
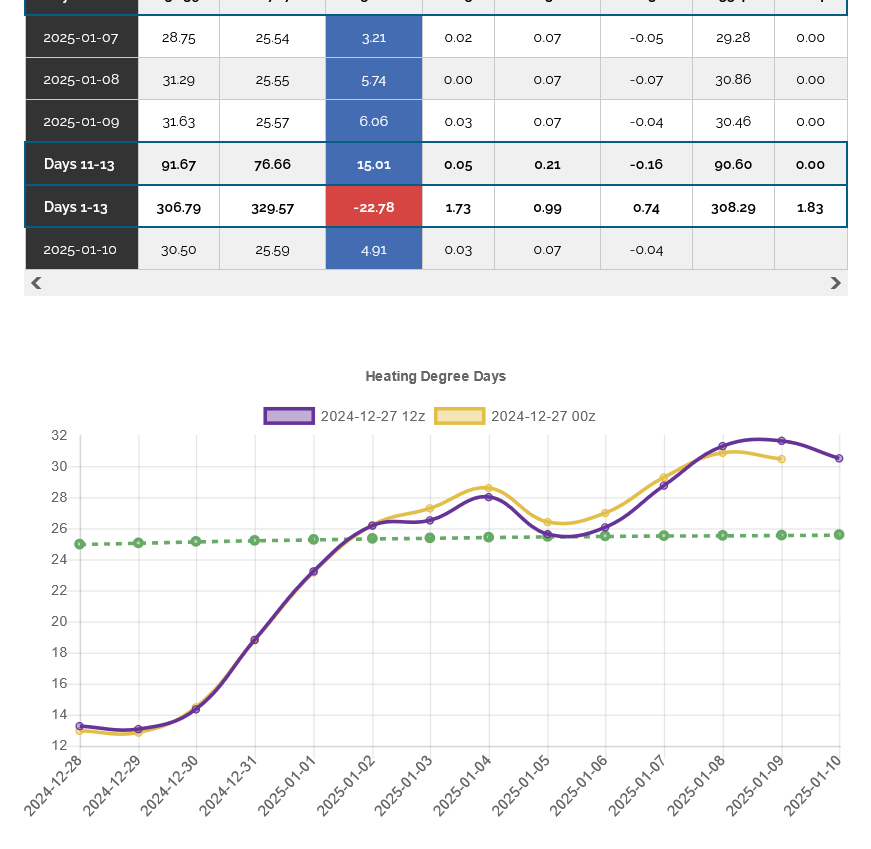
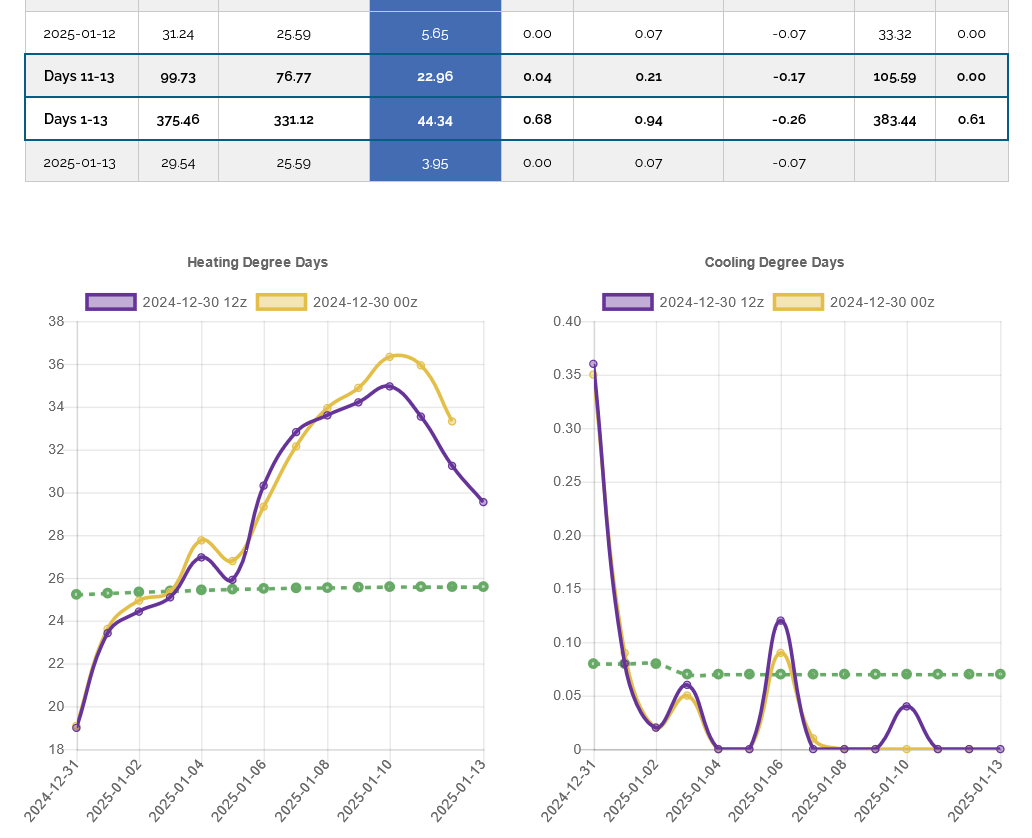
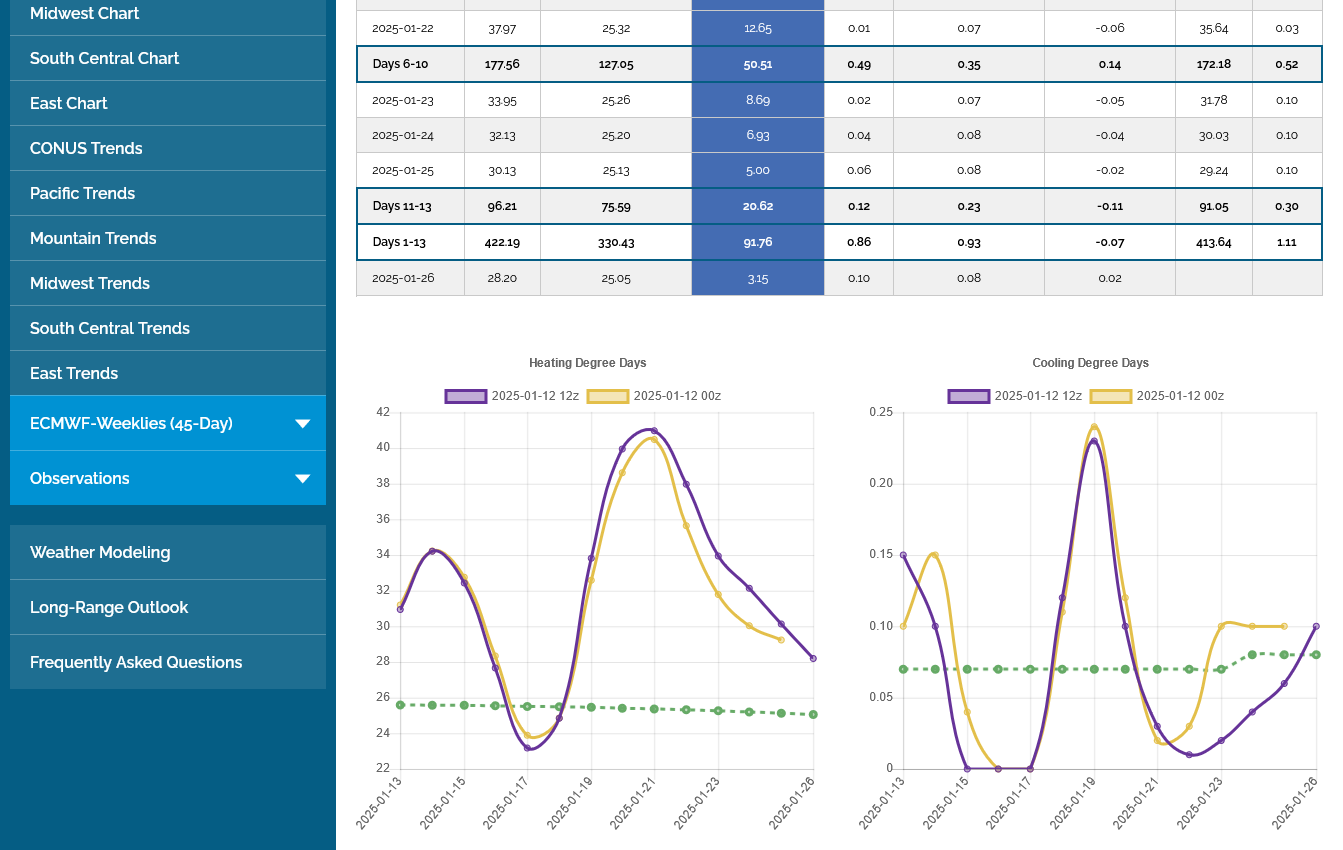
1. Last 2 EE runs.
2. Last 4 GEFS runs.

Thanks for posting those graphs!
It appears that the EE averages ~1 HDD more per day than GEFS on the runs you just posted fwiw.
NG looks like it dropped 2.5% 11:58AM-12:08PM CST on warmer 12Z EE. Do you agree?
YW, Larry!
This was the last 0z/12z HDD chart for the EE. I was busy updating chess emails and next weeks Winter Storm(tracking a bit farther north with less frozen stuff) and not watching NG extremely close. Doesn't look that different to me even though there were less HDDs in week 2. The last 500 mb map at 360 hours actually looks pretty bullish.
7 day temps for tomorrows EIA report. Extremely mild everywhere except along the East Coast, especially the Northeast.
https://www.cpc.ncep.noaa.gov/products/tanal/temp_analyses.php
https://www.axios.com/2025/01/02/polar-vortex-arctic-outbreak-us-europe-deep-freeze
+++++++++++
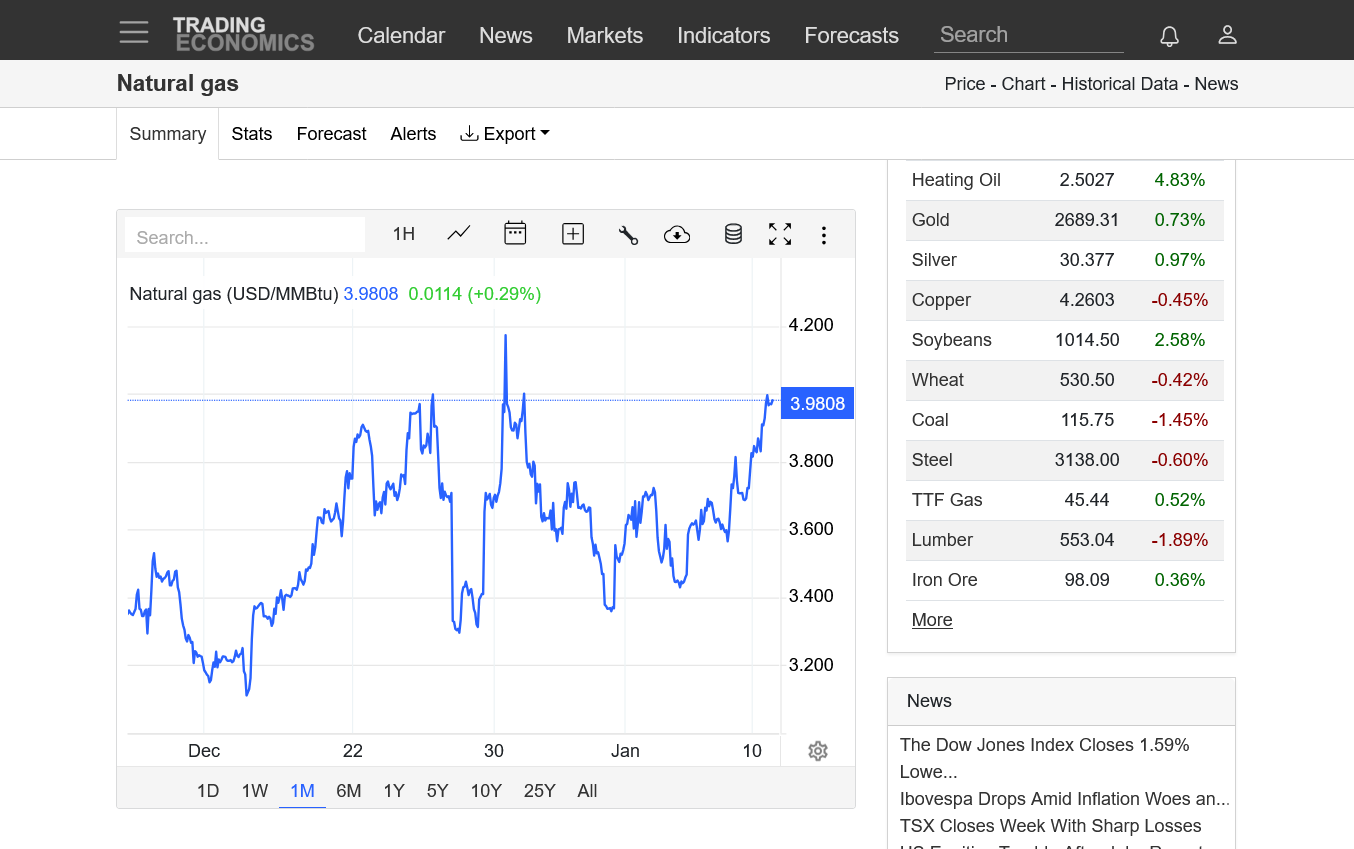
I would contend that the natural gas market has been trading this for many weeks BEFORE it hits:
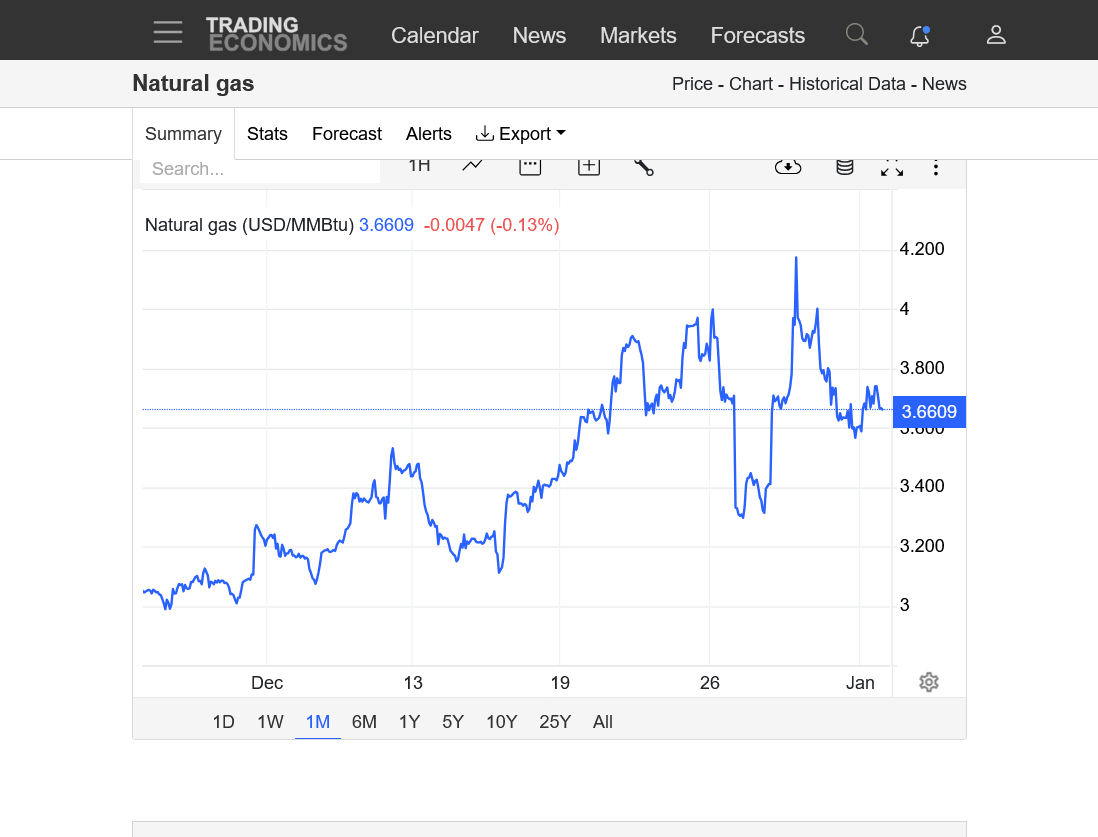
https://tradingeconomics.com/commodity/natural-gas
1. 1 month-UPTREND
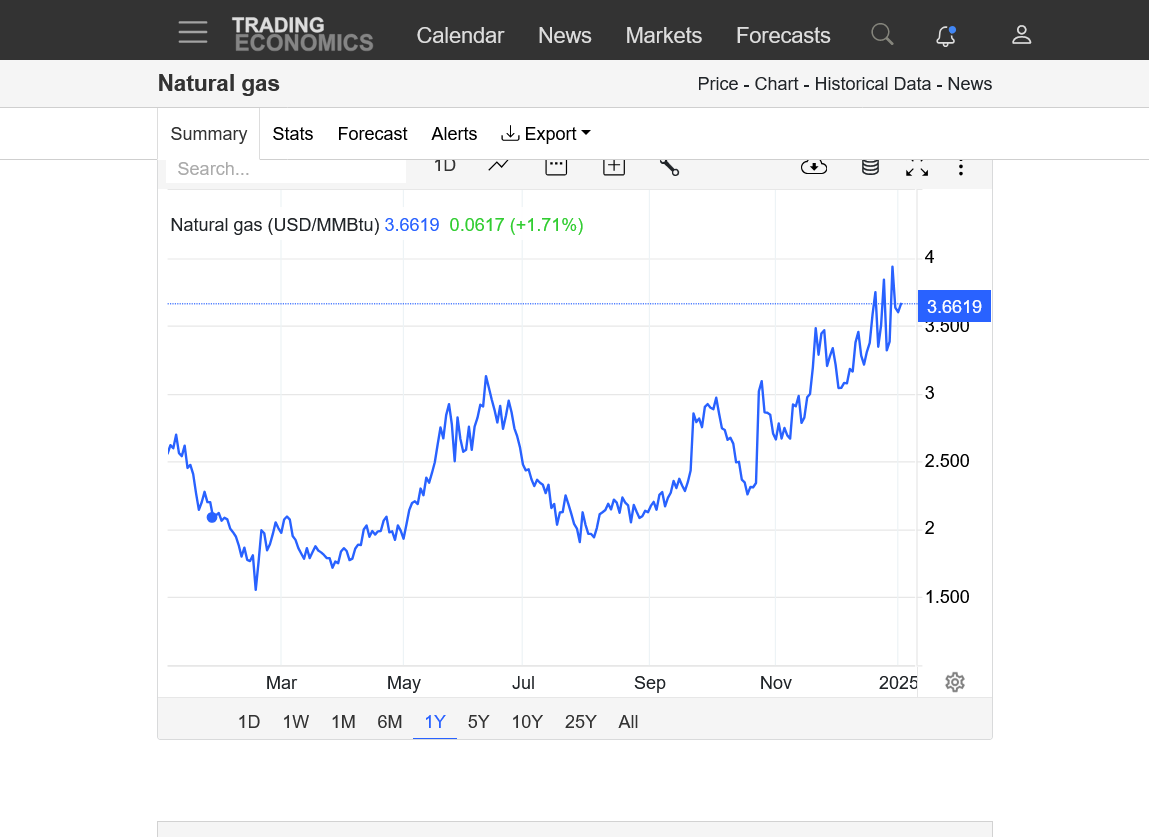
2. 1 year-does NOT show the 4.2 high earlier this week-UPTREND
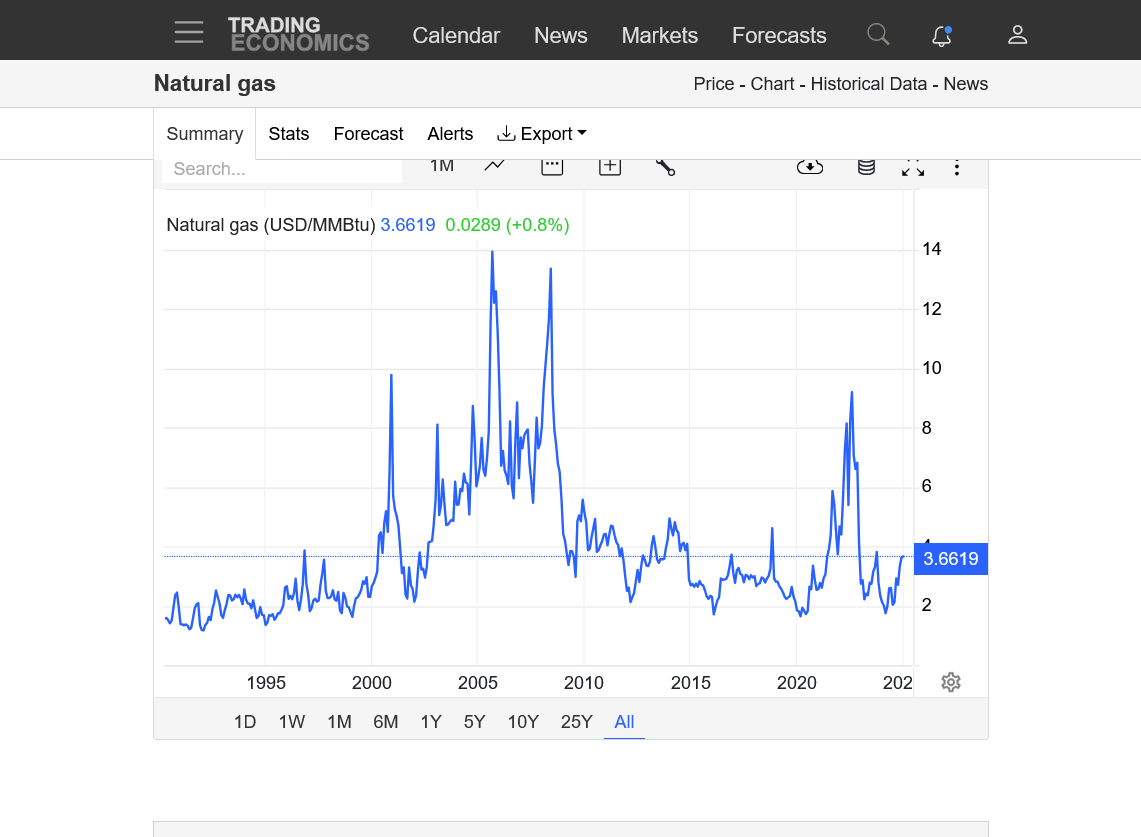
3. 35 years. Also does not show the 4.2 high. Major bottom is in. Hit strong resistance earlier this week with the enormous (PANIC) buying exhaustion causing the price to spike to 4.2 on record volume.
Hey Mike,
Are my eyeballs deceiving me or is the 0Z EE ~13-15 HDD warmer than 12Z? And is the 0Z GEFS ~6-8 HDD warmer than 18Z?
You are not imagining anything Larry. The 0z EE was actually -11 HDDs compared to the colder 12z run. Here it is:
EIA= -116 Bcf.
for week ending December 27, 2024 | Released: January 3, 2025 at 10:30 a.m. | Next Release: January 8, 2025
| Working gas in underground storage, Lower 48 states Summary text CSV JSN | |||||||||||||||||||||||||
|---|---|---|---|---|---|---|---|---|---|---|---|---|---|---|---|---|---|---|---|---|---|---|---|---|---|
| Historical Comparisons | |||||||||||||||||||||||||
| Stocks billion cubic feet (Bcf) | Year ago (12/27/23) | 5-year average (2019-23) | |||||||||||||||||||||||
| Region | 12/27/24 | 12/20/24 | net change | implied flow | Bcf | % change | Bcf | % change | |||||||||||||||||
| East | 745 | 792 | -47 | -47 | 801 | -7.0 | 771 | -3.4 | |||||||||||||||||
| Midwest | 914 | 960 | -46 | -46 | 973 | -6.1 | 922 | -0.9 | |||||||||||||||||
| Mountain | 262 | 267 | -5 | -5 | 229 | 14.4 | 188 | 39.4 | |||||||||||||||||
| Pacific | 295 | 293 | 2 | 2 | 280 | 5.4 | 242 | 21.9 | |||||||||||||||||
| South Central | 1,197 | 1,217 | -20 | -20 | 1,197 | 0.0 | 1,135 | 5.5 | |||||||||||||||||
| Salt | 349 | 349 | 0 | 0 | 340 | 2.6 | 323 | 8.0 | |||||||||||||||||
| Nonsalt | 848 | 868 | -20 | -20 | 857 | -1.1 | 812 | 4.4 | |||||||||||||||||
| Total | 3,413 | 3,529 | -116 | -116 | 3,480 | -1.9 | 3,259 | 4.7 | |||||||||||||||||
Notice: All federal offices will be closed on Thursday, January 9, 2025, in accordance with the National Day of Mourning, honoring President James Earl Carter, Jr. As a result, we will release the Weekly Natural Gas Storage Report at noon, on Wednesday, January 8, 2025. Totals may not equal sum of components because of independent rounding. | |||||||||||||||||||||||||
Working gas in storage was 3,413 Bcf as of Friday, December 27, 2024, according to EIA estimates. This represents a net decrease of 116 Bcf from the previous week. Stocks were 67 Bcf less than last year at this time and 154 Bcf above the five-year average of 3,259 Bcf. At 3,413 Bcf, total working gas is within the five-year historical range.
For information on sampling error in this report, see Estimated Measures of Sampling Variability table below.
Note: The shaded area indicates the range between the historical minimum and maximum values for the weekly series from 2019 through 2023. The dashed vertical lines indicate current and year-ago weekly periods.
+++++++++++++
The late week 2 models still have a very cold weather pattern but I realize now, why it's NOT panning out to high HDDS and in fact we've seen PLUNGING HDDS this week.
The Arctic cold and Canadian cold WILL BE DRAINED NEXT WEEK!!!!!
Milder air will replace that high latitude cold next week, so with the pattern continuing in week 2 and beyond, the air masses from higher latitudes will be milder than week 1(next week), when the source region had weeks to generate BITTER COLD.
Even more important is that the near record ----AO(4 standard deviations below average) will bounce back to near 0., with the NAO also increasing and the PNA decreasing.
https://www.marketforum.com/forum/topic/83844/#83856
+++++++++++++
We've completely closed the massive gap higher on Sunday Night, which confirms the earlier technical formation interpretation that the spike to 4.2 was a BUYING EXHAUSTION.
I’m less impressed with the E US cold overall than I was in recent days.
Pretty amazing, with this much cold still left in the forecast that it would result in $3,000/contract lower on the day and almost $9,000/contract lower from the spike higher to start the week!
NG often trades RELATIVE weather and not ABSOLUTE weather.
RELATIVE to expectations. The forecast is definitely NOT mild but traders only care that its NOT AS cold as yesterday.
https://www.cpc.ncep.noaa.gov/products/predictions/WK34/
Even though the European Ensemble was +4 HDDs colder on this last 0z run(purple/left vs the previous 12z run, 12 hours earlier,(from colder, individual days and NOT a pattern change) the continuous downward plunge in HDDs tells us why the price of natural gas collapsed at the end of the week. 
HIGHER open tonight.
Weather models and guidance turning colder and the pattern morphing back to potentially more extreme cold at the end of the 2 week period.
We opened +$2,000/contract and I didn't come close to getting filled on the buy order.
Models overnight will likely determine where we go from here. The extreme buying exhaustion, spike higher early last week, included some panic buying from vulnerable shorts no longer in the market.
If we are to get back up to $4.2 again(possible with sustained cold) it will come with LESS short covering(traders crying uncle that may have been short for awhile, that want out at any price) the 2nd time up there.
Hey Mike,
What’s driving the extension of cold? Is it looking to be anywhere near the level of cold of these next 2 weeks in the E 1/2 of the US?
The forecasts I saw had the PNA dropping and the AO/NAO rising substantially next week.
Would it be -EPO driven by chance?
Could some of the rise be due underestimating this week’s cold and snowstorms? The NE US could be looking at 2 big storms this week, alone! When was the last time that happened?
Sorry for not responding earlier, Larry.
we lost power several times and still have no internet, cable or phone FroM AT T.
my son has verizon and I’m tethering off his phone.
I’ll comment much more when i can use my computer again.
thanks
Larry,
I agree that those indices are not very cold/bullish: https://www.marketforum.com/forum/topic/83844/#83856
However the NWS did a good job today depicting week 2 temps:
This is pretty bullish, considering the widespread nature of the cold:

+++++++++++++++
Last nights 0z Canadian model was especially bullish with its potent cross polar flow, bringing Siberian air across Canada into the US. Huge spread in individual ensemble solutions=uncertainty! This was the last, 384 hour map:

The last run, 12z and 12 hours later was not as amplified with the ridge-west/trough downstream couplet. It's still there but with a flatter, slightly stronger west to east adjustment even though the pattern, if it verifies, spells below to much below temps in most of the US.
https://weather.gc.ca/ensemble/charts_e.html?Hour=384&Day=0&RunTime=12&Type=gz
+++++++++++++
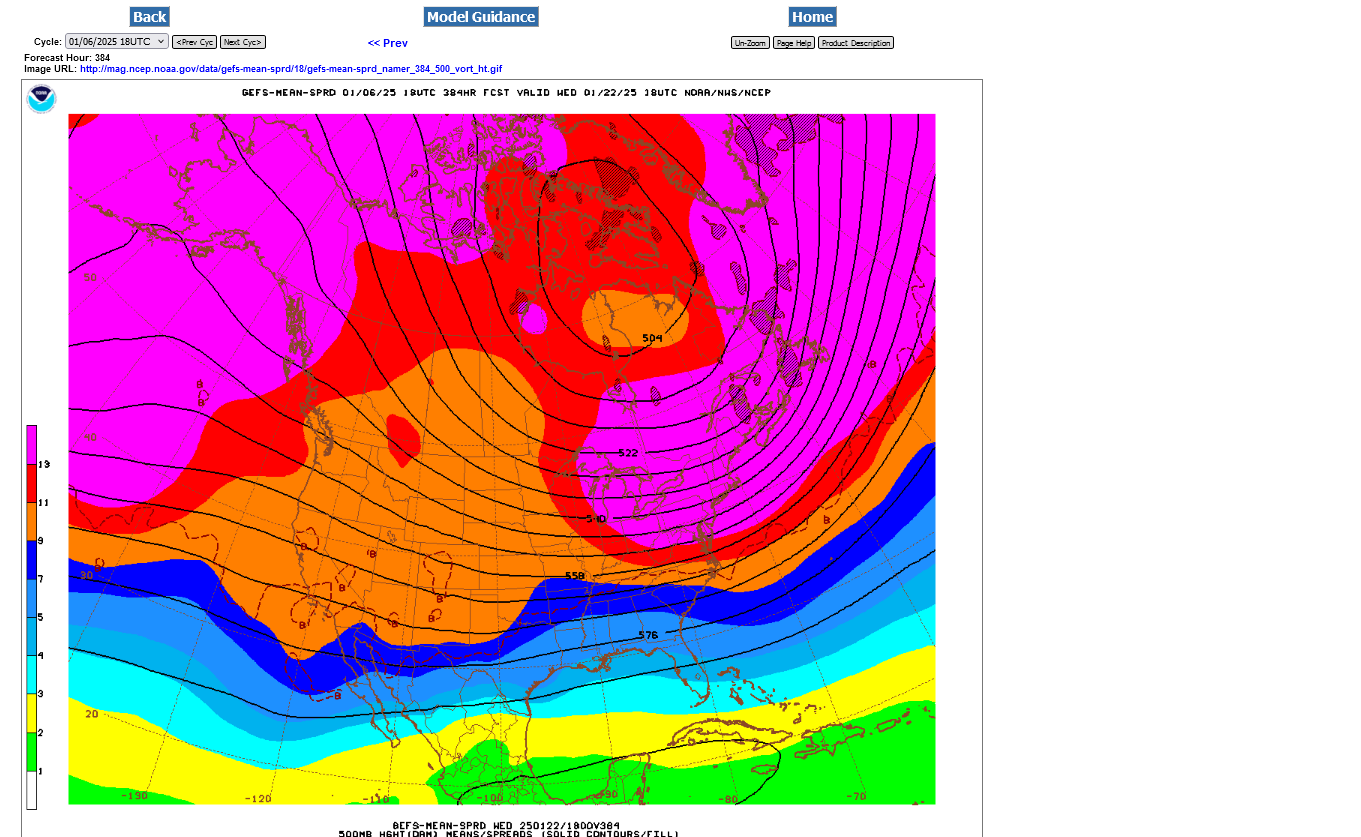
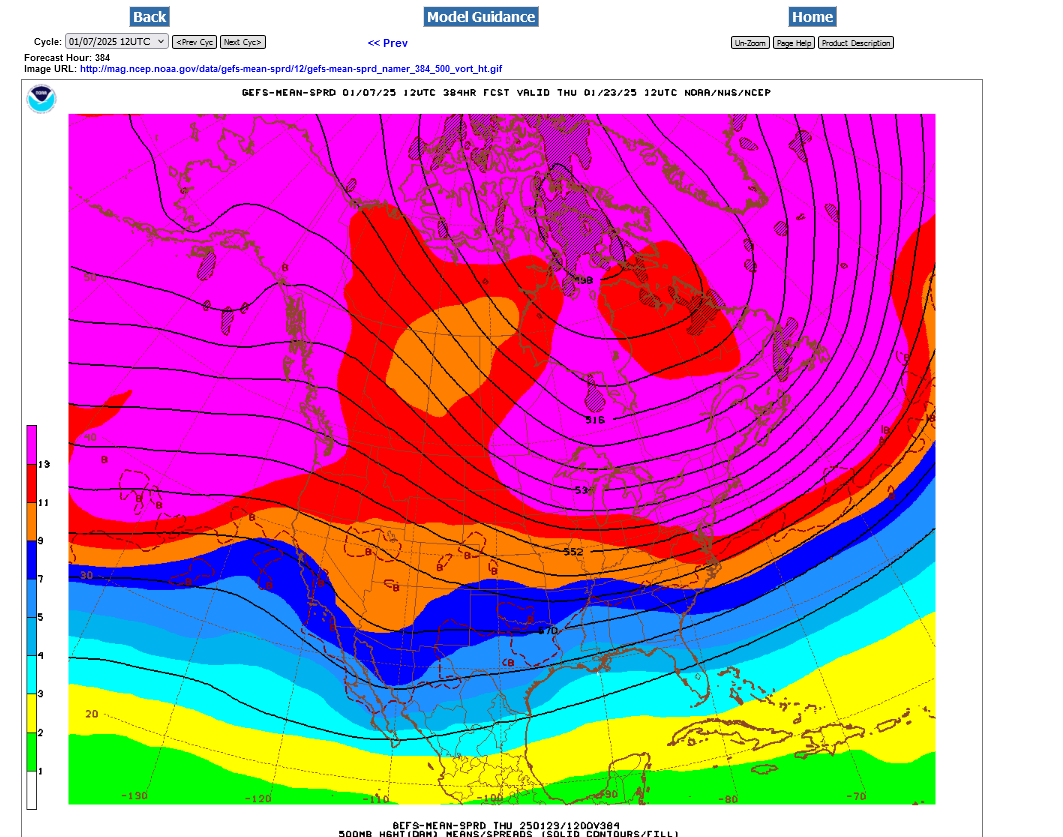
1. This was the just out 18z GEFS 500 mb at 384 hours. Very powerful cross polar flow. 5 stream lines at the top left portion of map, transporting SIBERIAN air masses across Canada, into the US.
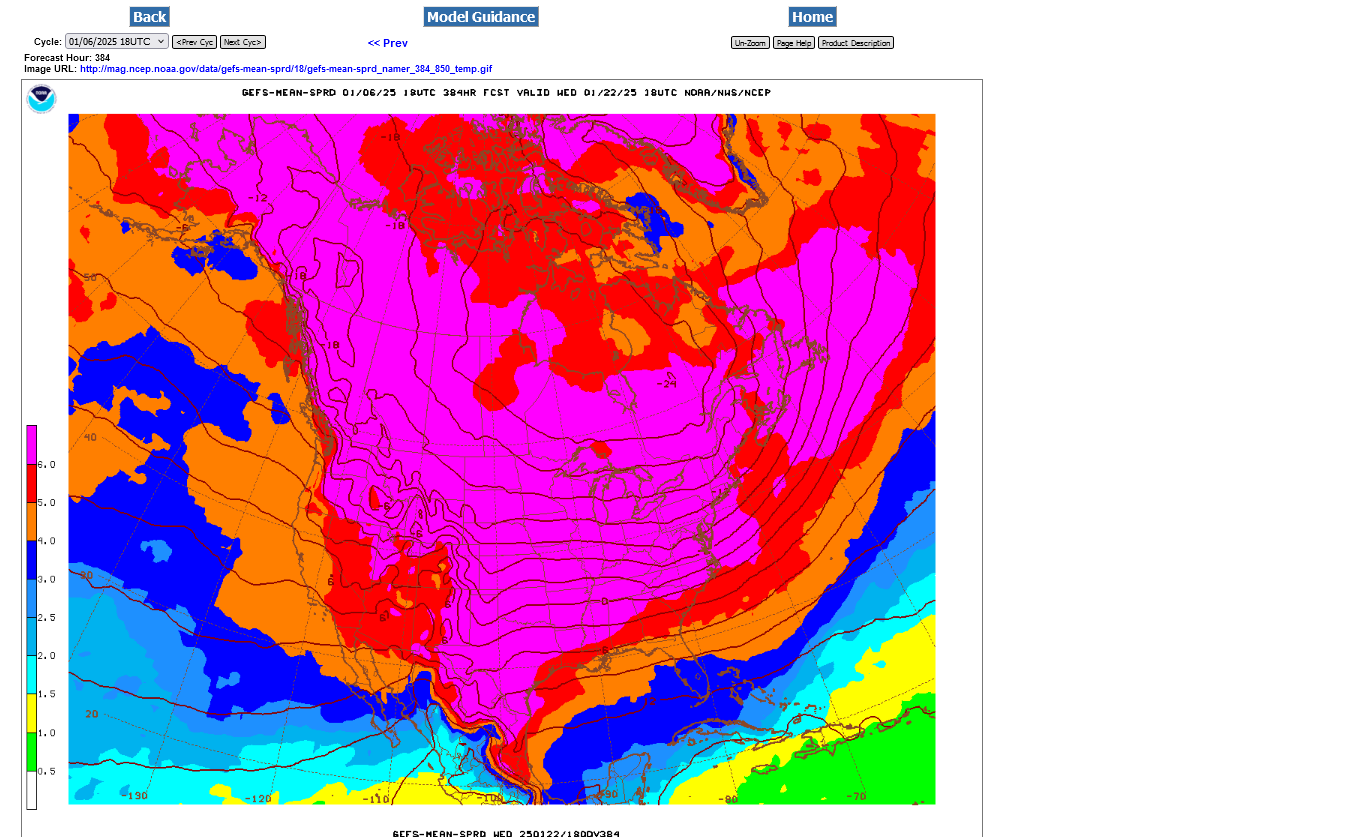
2. 850 mb -18 deg. C isotherm south of the US/Canadian border!! 0 deg. C in far northern GA! Tightly packed isotherms with steep gradient from north to south, featuring WIDESPREAD colder than average temps.
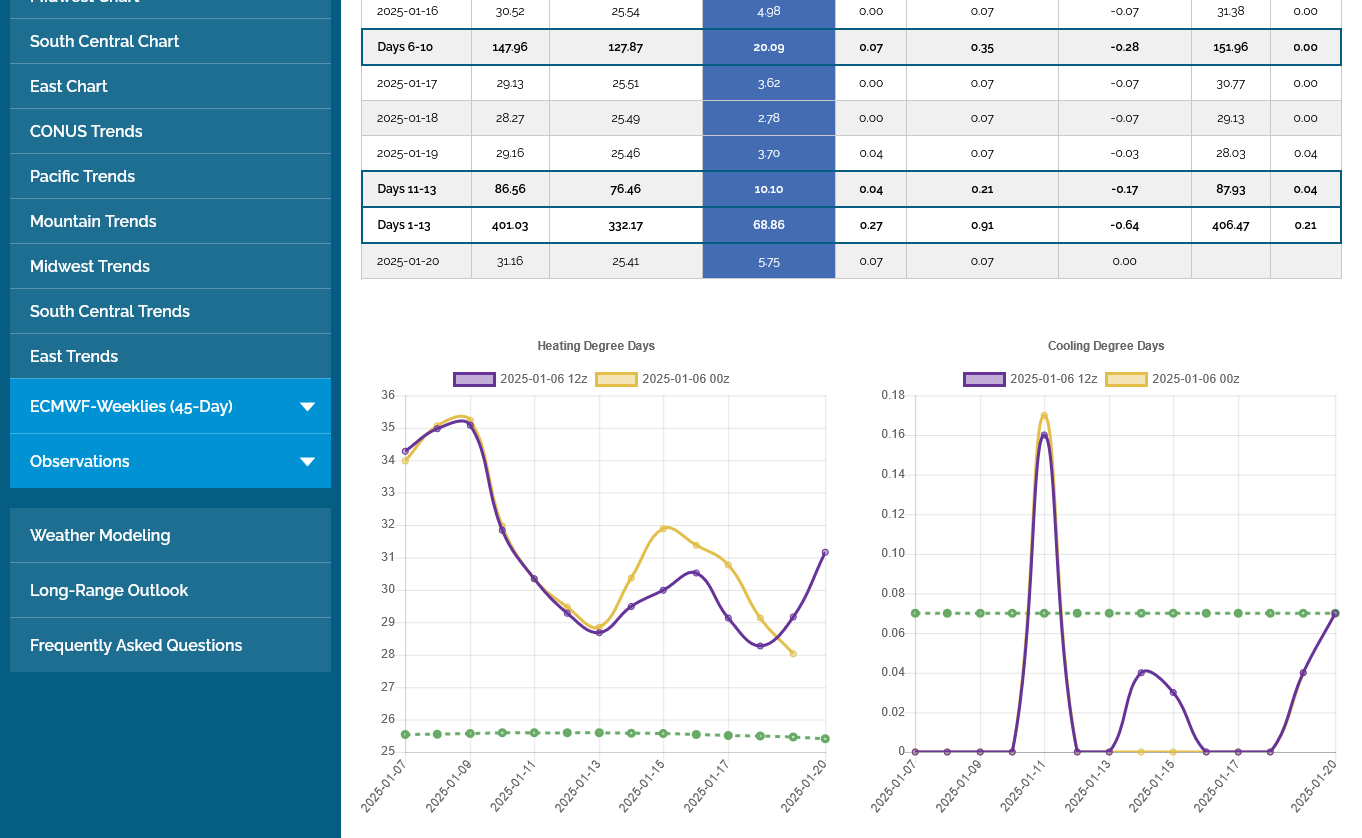
3. HDDs have jumped higher! +12 HDDs on the 12z run(tan/left) and another +1 HDDs on this last 18z run(purple).
4. However, the last EE was -5 HDDs(purple) vs the previous 0z run but it has the same COLD pattern.

Thanks, Mike!
It looks like the warmer late 0Z EE helped bring NG down a good bit (~3% on its own).
Larry,
You aren't kidding about that last 0z EE. A big -9 HDDs LESS than the previous run that was already -5 HDDs less than the run before that!
The last 6z GEFS was also not quite as impressive with the steering currents for cross polar flow.
Look at the difference between this run and the one 18 hours ago(12z on Monday):
The feature to look at is in Northwest Canada and vicinity.
1. GEFS 18 hours earlier-stream lines almost all going directly north to south, from the top of the map, across much of Canada. They started in Siberia.
2. Last run-same streamlines pushes farther east, by a jet stream out of the Pacific, which almost cuts off the cross polar flow from Siberia!
++++++++++++++++++
Added 12:30 pm. This was the last 12z GEFS. The market is close to the lows of the week right now but this still looks mighty cold for much of the US...........if its correct.
The last 12z Canadian model too looks pretty cold.
https://weather.gc.ca/ensemble/charts_e.html?Hour=384&Day=0&RunTime=12&Type=gz

1pm: the EEalso came out +7HDDS colder but the Ng market didn’t care. A very bearish reaction to accross the board, much more bullish weather forecasts From all the 12z models.
huge specs often lose interest in the long from Jan-March with very negative seasonals, even sometimes with decent colder than average temps.os
especially if storage is high and if we just blew out all the weak shorts with a panic driven buying exhaustion,last week.
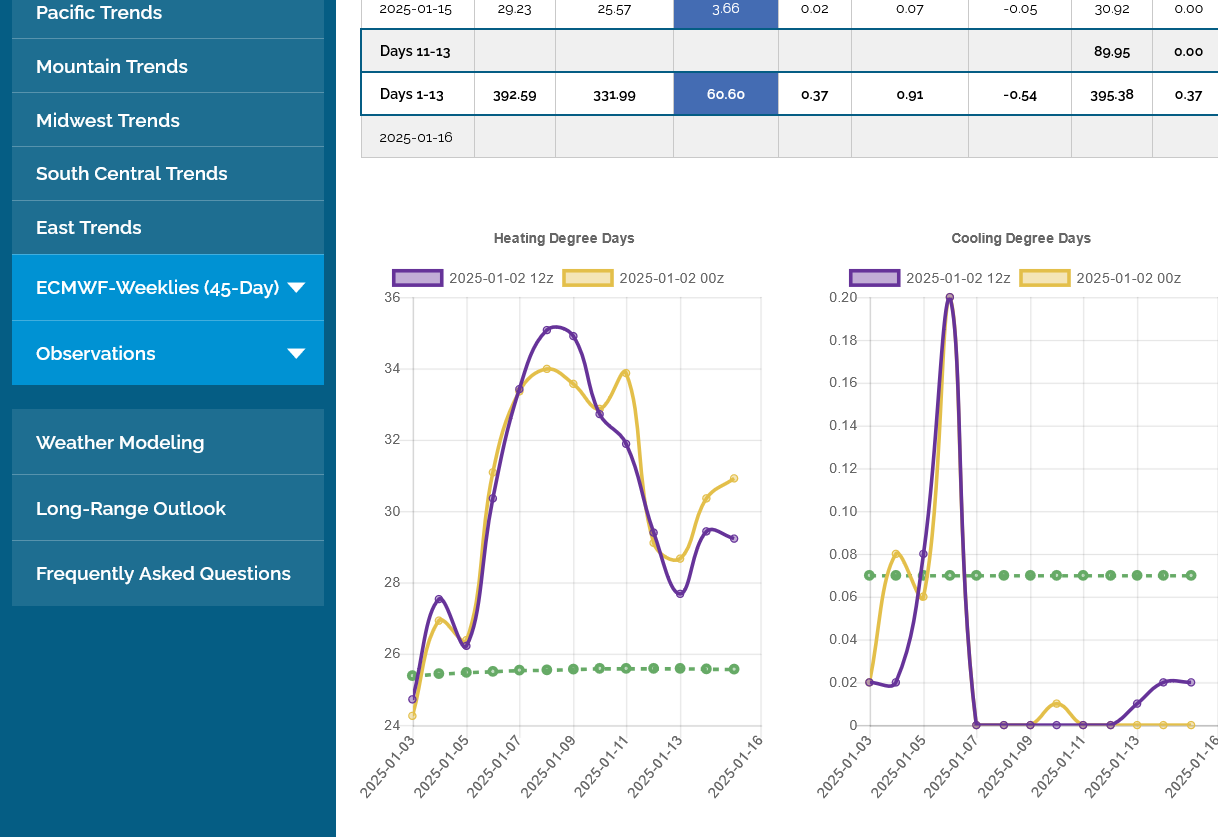
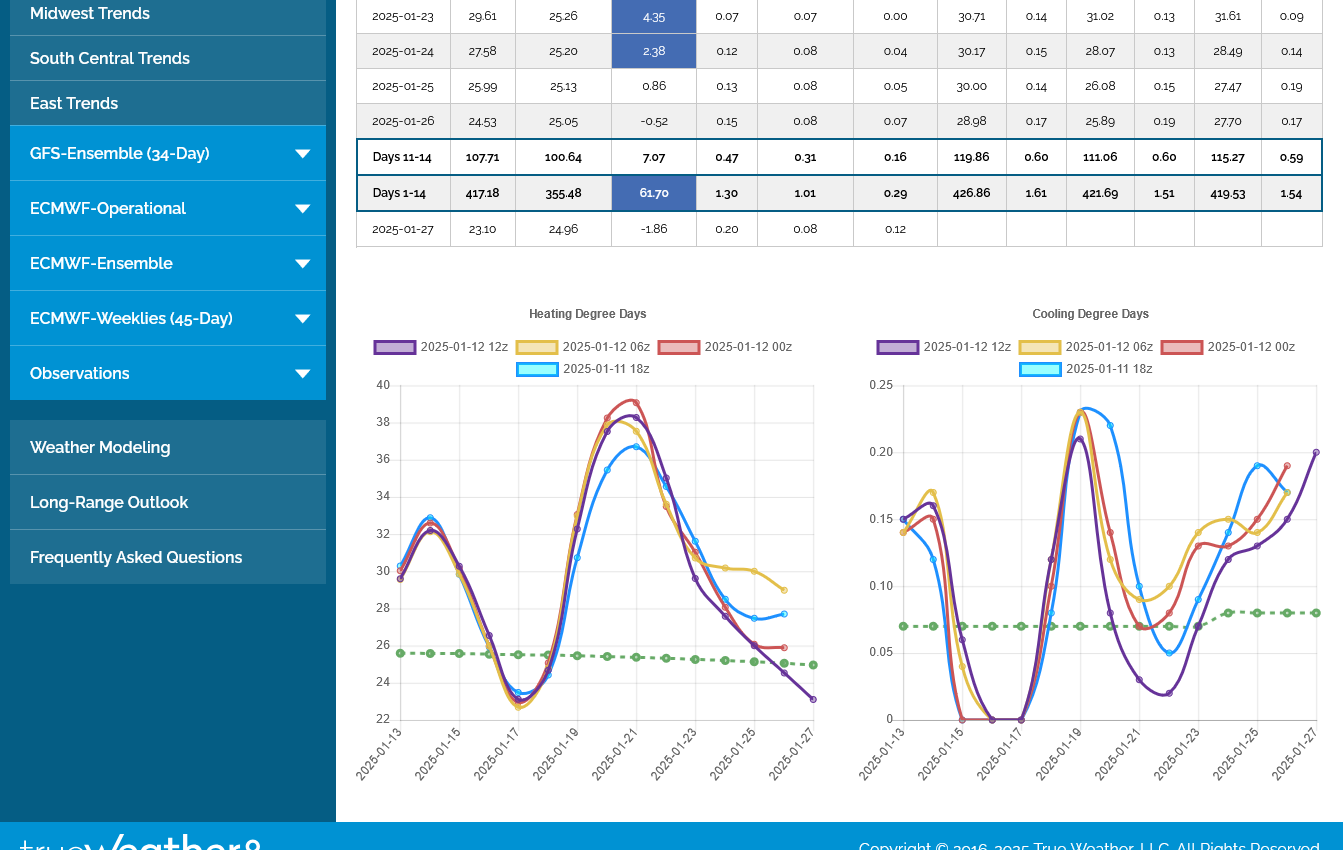
Hey Mike,
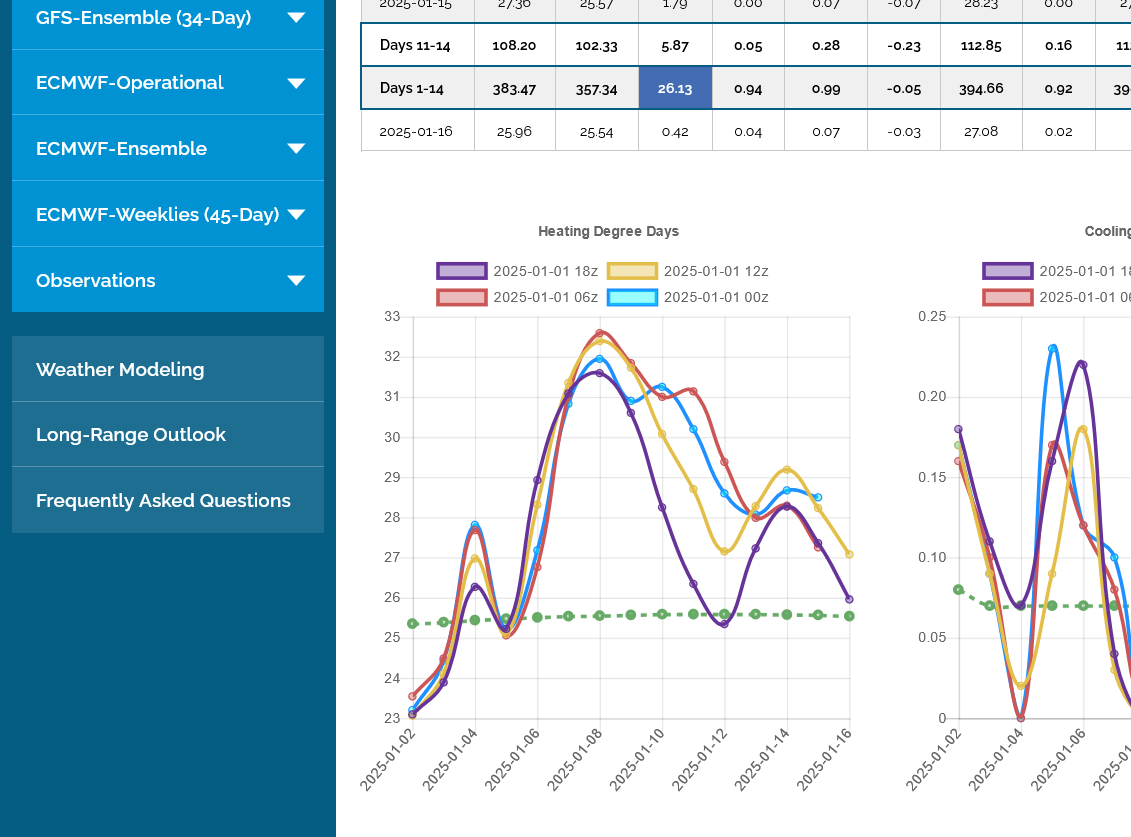
This is what tells me the EE is inherently colder than GEFS in general. Note that the first 3 days are at 32.5-33.5 on the GEFS runs vs up at 34-35 on the EE runs, ~1.5 colder.
7 day temps for Thursdays EIA storage report. VERY mild across the entire country to end December!
https://www.cpc.ncep.noaa.gov/products/tanal/temp_analyses.php
-40 Bcf is pretty dinky for this time of year. Not sure what the guesses were. The SouthCentral region actually had a rare BUILD/INJECTION for mid Winter.
![]()
for week ending January 3, 2025 | Released: January 8, 2025 at 12:00 p.m. | Next Release: January 16, 2025
| Working gas in underground storage, Lower 48 states Summary text CSV JSN | |||||||||||||||||||||||||
|---|---|---|---|---|---|---|---|---|---|---|---|---|---|---|---|---|---|---|---|---|---|---|---|---|---|
| Historical Comparisons | |||||||||||||||||||||||||
| Stocks billion cubic feet (Bcf) | Year ago (01/03/24) | 5-year average (2020-24) | |||||||||||||||||||||||
| Region | 01/03/25 | 12/27/24 | net change | implied flow | Bcf | % change | Bcf | % change | |||||||||||||||||
| East | 737 | 745 | -8 | -8 | 769 | -4.2 | 745 | -1.1 | |||||||||||||||||
| Midwest | 881 | 914 | -33 | -33 | 937 | -6.0 | 886 | -0.6 | |||||||||||||||||
| Mountain | 255 | 262 | -7 | -7 | 222 | 14.9 | 181 | 40.9 | |||||||||||||||||
| Pacific | 293 | 295 | -2 | -2 | 276 | 6.2 | 235 | 24.7 | |||||||||||||||||
| South Central | 1,207 | 1,197 | 10 | 10 | 1,172 | 3.0 | 1,119 | 7.9 | |||||||||||||||||
| Salt | 364 | 349 | 15 | 15 | 335 | 8.7 | 323 | 12.7 | |||||||||||||||||
| Nonsalt | 844 | 848 | -4 | -4 | 836 | 1.0 | 797 | 5.9 | |||||||||||||||||
| Total | 3,373 | 3,413 | -40 | -40 | 3,376 | -0.1 | 3,166 | 6.5 | |||||||||||||||||
| Totals may not equal sum of components because of independent rounding. | |||||||||||||||||||||||||
Working gas in storage was 3,373 Bcf as of Friday, January 3, 2025, according to EIA estimates. This represents a net decrease of 40 Bcf from the previous week. Stocks were 3 Bcf less than last year at this time and 207 Bcf above the five-year average of 3,166 Bcf. At 3,373 Bcf, total working gas is within the five-year historical range.
For information on sampling error in this report, see Estimated Measures of Sampling Variability table below.
Note: The shaded area indicates the range between the historical minimum and maximum values for the weekly series from 2020 through 2024. The dashed vertical lines indicate current and year-ago weekly periods.
The last 0z European Ensemble model (purple/left) was actually -6.5 HDDs bearish vs the previous 12z run but NG is up sharply today from more cold on the way in the extended.
UPDATE FRIDAY AFTERNOON:
The 12z EE basically reversed the previous run with +6 HDDs: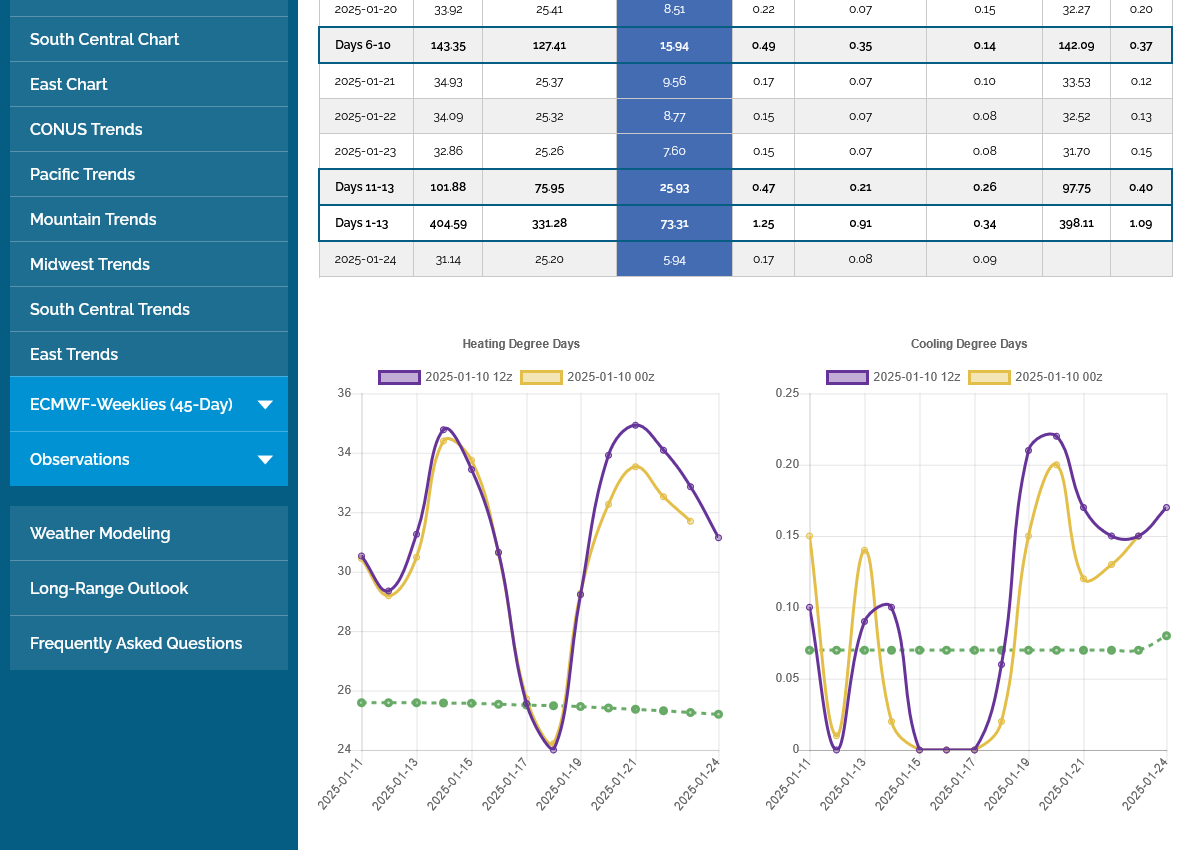
No end in sight to the cold thru 2 weeks.
The just updated, low skill weeks 3-4 looks very much like the La Nina analog signature!
https://www.cpc.ncep.noaa.gov/products/predictions/WK34/
+
+++++++++++++++++++++++++++++++++++++++
NG had a huge day up, nearly +$3,000/contract as we approach the close for the week.
The chart configuration and market suggest a potential gap higher on Sunday Night but that will only happen if the weather looks colder. That gap would be ABOVE the key, psychological price of $4(if it happened).
If the weather turns milder over the weekend, just the opposite will happen!
https://tradingeconomics.com/commodity/natural-gas
+++++++++++++++
We can see that some of the ensemble members of the Canadian model have a solution cold enough to cause that gap higher. This was the last, 384 hour map. Still featuring distinctive cross polar flow that has defined our recent cold. Some of them have the polar vortex displaced unusually far south.
https://weather.gc.ca/ensemble/charts_e.html?Hour=384&Day=0&RunTime=12&Type=gz
384h GZ 500 forecast valid on Jan 26, 2025 12 UTC
This is despite the AO and NAO becoming positive which is a bit unusual. The PNA crops to being less positive.
https://www.marketforum.com/forum/topic/83844/#83856
I hope everything is ok with Larry/WxFollower! We haven't heard from him in several days.
Hey Mike,
I’m fine. Thanks for asking. I’ve been enjoying 3” of snow, which fell in addition to some sleet and freezing rain, on a visit to the Atlanta area.
Great to read you, Larry!
Yes, that sure was a rare event for you guys!
Winter Storm in the South
+8.5 HDDs on the last 12z European Ensemble vs the previous 0z but look at the trend at the end DOWNWARD!
Look at the plunge lower in HDDs on the last 12z GEFS. -9 HDDs vs the previous 06 run.
I have never seem the models in such disagreement at the end of the 2 week period!!